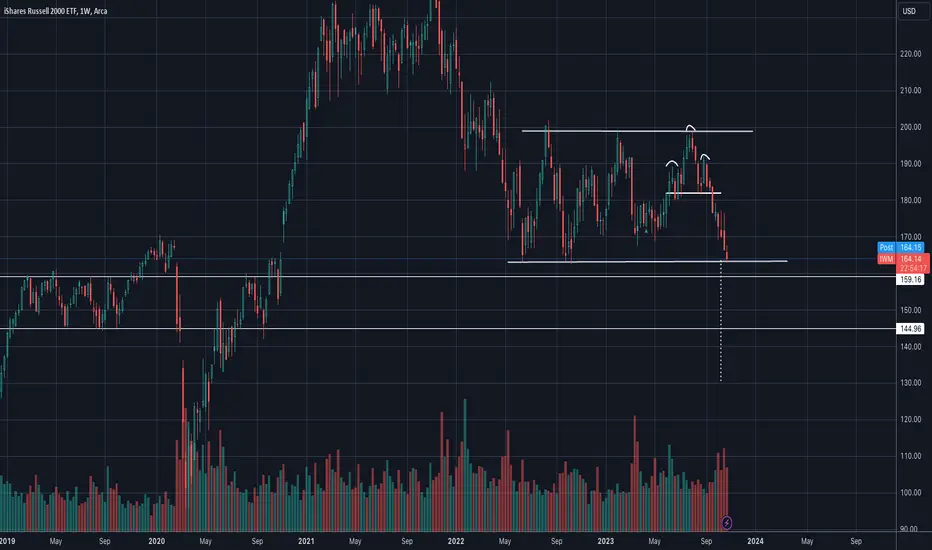
Will Russell 2000 Lose 24% of Value?Russell 2000 Testing key level. Would make sense to get a bounce from here, but the 2 year downtrend clearly shows bear pressure. If we break 159 next target is 145
If we get back inside of the triangle, I think this analysis is invalid and we might continue upwards
ps. This is weekly chart so this will take time unless we get some kind of catalyst
Active Trades GOLD , DYDX and XRP
-PalenTrade
IWM trade ideas

Spx Bounceok we're getting a recovery rally, but be aware tomorrow they could sell down to create one more low which I would think would be a bear trap. I can't say it's THE "bottom" but we could be starting to make a bottoming pattern here. RSI needs a reset, watch NQ and tech especially for an outperformance rally if I'm correct.
Good luck!

$IWM - At trendline supportAMEX:IWM Sitting on a trendline that has previously provided support. If a reversal is in the cards, this is the moment. If not, $159 is the next stop.
Here are the support areas below:
$159
$144
$130
It is still trading at $2019 peak level.
IWMLong here off support
Target is 170-171 or trendline resistance.
Too oversold here on major horizontal support at 162 dating back to 2020
Stop loss 162.00
IWM breakdownIWM weekly chart looking very weak. It has been in a distributive range for almost 18 months now, making lower highs and holding a buy wall. After such a long period of consolidation could believe there is significant follow through on this move in time. Doesn’t send a great signal for the economy, yes the market is not the economy but usually small caps struggle when the economy struggles.

A new low target achieved for IWM/SHYThis ratio is a key to the economic outlook. The bearish breakdown is confirmed, look for further downside in the markets.

Advanced Bull Flag ConceptsHave you ever wondered why price action sometimes forms a bull flag pattern?
Have you ever wondered if there is a way to predict whether a bull flag will break out before it actually does so?
In this post, I will try to address these questions by presenting a couple of theories about the nature of bull flags.
Bull Flag Theories
(1) The flag structure of a bull flag tends to form along Fibonacci levels, with the ideal flag proportion being an approximated golden ratio to the flagpole; and
(2) Fibonacci and regression analyses can provide useful insight into whether price will successfully break out of its bull flag pattern, sometimes long before price even attempts to do so.
I will try my best to clearly explain both theories in detail below.
Note: Although this analysis is also generally true for bull pennants, bear flags, and bear pennants, to keep things simple I will focus solely on bull flags. Additionally, this analysis is generally true across timeframes.
Part I - The Basics of a Bull Flag
First, let's begin with the basics. As shown in the image below, bull flags form when an asset is in a strong uptrend. The uptrend forms the flagpole of the bull flag structure.
The flag structure forms when price consolidates, usually in a falling trend. This consolidation phase is often characterized by price oscillators rotating back down while the price retraces only a small part of its prior upward move.
From a market psychology perspective, bull flags often form when most market participants who bought the asset continue to hold it expecting the uptrend to resume, while only a minority of market participants sell (or short the asset) as its price corrects downward. The bull flag pattern is a continuation pattern because it reflects the market's general expectation that price will eventually resume its upward move.
Once the price definitively breaks above the upper channel of the flag (often with strong momentum and high volume), the bull flag pattern is validated. Upon breakout, the expected move up is equal to the vertical height of the flagpole.
Part II - The flag structure of a bull flag tends to form along Fibonacci levels, with the ideal flag proportion being an approximated golden ratio to the flagpole
Here's where things begin to get interesting. Below is the golden ratio.
Two quantities, a and b (where a > b ), form the golden ratio if their ratio is the same as the ratio of their sum to the larger of the two quantities. (See the equation below)
The equation above shows the Greek letter phi which denotes the golden ratio. Phi is equivalent to a/b when such ratio is also equivalent to (a + b)/a.
Although bull flags can take various forms, it is my hypothesis, based on chart analysis and research, that the most perfectly structured bull flags (ones that also have the highest probability of successful breakouts) occur when the flag forms a golden ratio to the flagpole.
Mathematically, this means that the vertical height of the flagpole is equivalent to (a + b) and the vertical height (i.e. the width) of the flag is equivalent to b. This is also to say that price retraces down to the 0.382 Fibonacci level as measured by applying Fibonacci retracement levels along the flagpole (or to the 0.618 point on the vertical height of the flagpole if one measures from the bottom to top).
I realize that this can be quite confusing, so let’s walk through some visualizations.
Let's first visualize this hypothesis using the golden rectangle. Below is an image of the golden rectangle. A golden rectangle is composed of a square (with sides equal to a) and a smaller golden rectangle (with width equal to b and length equal to a).
Now let's rotate the golden rectangle to better visualize the hypothesized flag pattern.
The bull flag is hypothetically an approximation of the golden rectangle, whereby the width of the flag is in a golden ratio approximation to the length of the flagpole.
In the illustration below, there are multiple bull flags contained within a Fibonacci spiral. The spiral is made up of golden rectangles, with each larger golden rectangle containing a smaller golden rectangle inside it. The smaller golden rectangle is the flag structure, and the length of the larger golden rectangle is the flagpole.
One can think of the Fibonacci spiral and the golden rectangles as a series of bull flags that build on top of each other in a repeating pattern. In this diagram, price is represented by the increasing length of the sides of each golden rectangle. In other words, the price on a chart can be seen as spiraling higher after each bull flag breakout.
Of course, not all bull flags form a structure that approximates the golden ratio, but it is my belief that in forming a bull flag, price action is aspiring to achieve as close of a golden ratio approximation as it can. I believe that the bull flags that best approximate the golden ratio structure also present the highest probability for a successful break out.
To learn more about Fibonacci spirals, including the golden spiral that Fibonacci spirals approximate, you can check out this Wikipedia article: en.wikipedia.org
Part III - Fibonacci and regression analyses can provide useful insight into whether price will successfully break out of its bull flag pattern, sometimes long before price even attempts to do so.
To see how Fibonacci levels and regression analysis can give insight into whether a bull flag will break out or break down before it does so, let's consider an example.
Let’s consider the massive bull flag that the iShares Russell 2000 ETF (IWM) formed in 2021.
In 2021, the monthly chart of IWM formed what appeared to be a bull flag, as shown below.
Now let's see why Fibonacci analysis and regression analysis were warning that this bull flag was not likely to break out successfully.
First, IWM's price did not retrace to a Fibonacci level before attempting a breakout (when using the pole as the Fibonacci retracement reference point). In the chart below, we see that price tried to break out, without even so much as retracing down to the highest Fibonacci retracement level: $196.71. By not undergoing Fibonacci retracement, price did not give its oscillators the opportunity to rotate back down fully. Instead, price remained overextended at the time it attempted to break out.
Now let's look at regression analysis. Below is a log-linear regression channel that contains IWM's entire price history. As noted in my prior posts, a regression channel simply indicates how far above or below the mean (or average) price an asset's current price is trading. In the regression channel above, the red line is the mean price, the upper channel line is 2 standard deviations above the mean, and the lower channel line is 2 standard deviations below the mean.
A successful breakout of the bull flag would have taken IWM's price way above its regression channel, to a level that is too many standard deviations above its mean price for us not to question the probability of the breakout’s success. Achieving the full measured move up would have been extremely unlikely, assuming that the regression channel is valid and that price tends to revert back to its mean over time. What was more likely than a breakout was a breakdown, and a reversion back to the mean, which is what ended up happening with IWM.
Another interesting note about IWM’s bull flag is that it presented a false breakout in November 2021. This false breakout was presenting multiple warnings signs including being a UTAD test of a Wyckoff Distribution. As shown below, however, another important clue that the November 2021 breakout would likely fail was that the breakout was not confirmed when comparing IWM to the money supply (M2SL). See the chart below.
One can interpret this chart to mean that in late 2021, IWM’s price was rising because the central bank was increasing the money supply, but not due to improving strength of the underlying companies that comprise the ETF. Using the money supply as a ratio to an asset elucidates the true inherent strength of the asset's value. To understand more about why the money supply can be used in this manner, you can check out my post below.
Part IV - Additional Comments
I have a few additional comments. I usually use Fibonacci levels on a log-scale chart to identify Fibonacci spirals because Fibonacci spirals are logarithmic spirals. However, when using Fibonacci levels based on log scale, the ratios, percentages and numbers, can seem quite confusing because they are logarithmically adjusted. If you choose to replicate my process, please be mindful of this. While using log-scale charts is critical for higher timeframes (e.g. the monthly chart or higher), I have not identified much benefit to using it on shorter timeframes.
In a prior post, I noted that Plug Power (PLUG) is currently forming one of the best-looking log-scale, golden ratio bull flags I have ever seen. If my above hypotheses are true, I would expect to see PLUG move dramatically higher in the years to come. For more information about PLUG, you can read my post linked below. (This is not a solicitation to buy PLUG. Please do your own research and carefully consider all risks.)
At the risk of making this post too long and too dense, I just want to briefly note that it is also my hypothesis, based on observation and research, that the golden ratio is where many S-curve dilemmas are solved. If you don't know what an S-curve dilemma is and you'd like to read about this you can see my post below about Jumping S-Curves .
In short, an S-curve dilemma is another way of conceptualizing the question of whether a bull flag will break out or break down.
I hope that someone finds value in this post. I spent a lot of time studying, researching, analyzing, and cogitating the mathematical nature of price action to reach many of the conclusions here. Thank you for your valuable time in reading my post.

$IWM nearing last year low Weekends are great to zoom out and look at the bigger picture.
3M and 12M thus Quarter and Year
Which for IWM (as many others) don't look particularly well, apart for the shorts ; - )
Will we see another 2d on the Y (?) or the 'traditional end-of-year-rally'

IWM: Breaking Down From A Bear Flag Visible on the MonthlyThe Russell 2000 has broken down from a Bear Flag that is visible on the monthly timeframe; at the same time, the RSI is breaking below trend and the MACD has flipped Bearish. If this goes like last time, it will result in a deep bearish retrace, perhaps all the way down to the $70s or even the $50s. One thing to keep in mind is that the Russell is heavily linked to Finacial Stocks and Banks, so this Bearish Setup here is likely more indicative of what's to come for the financial sector, including Banks, REITs, and other Services, than anything else.

$IWM Reversal?I took a chance on AMEX:IWM yesterday on the reversal candle. I liked the action today as it followed through. It did get rejected today right at the area of horizontal resistance although it did close in the upper 2/3 area of the candle. I look at that as being bullish. I will look to add to my ½ sized position if / when it can get over that flat resistance area and again if it can break above the downtrend line. All TBD. My Stop is under that red candle from last Friday.
See notations on chart for my thought process.
My thinking is that “if” there is going to be a 4th quarter rally the small caps will need to participate. Again, all TBD.
Not investing / trading advice. Comments always welcome. Thanks for looking.

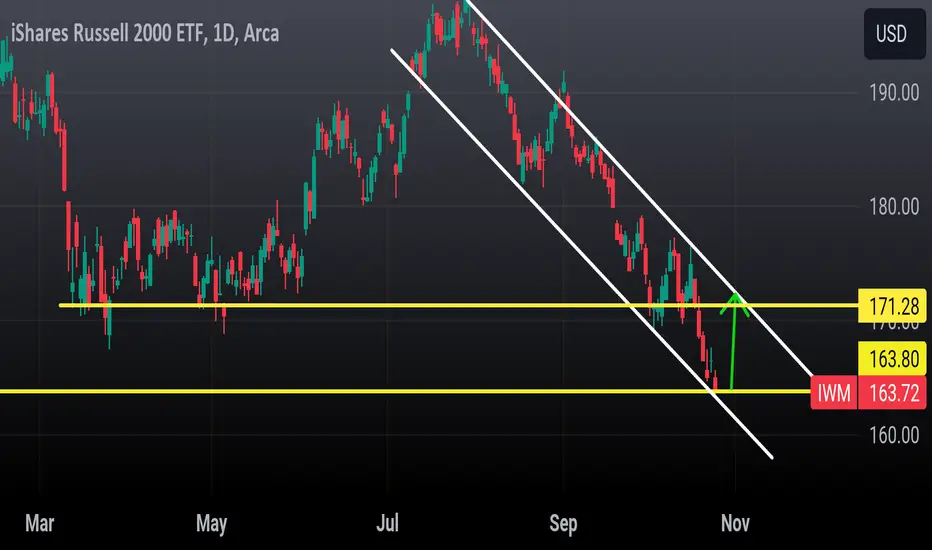
$IWM - at a crossroadsAMEX:IWM In my earlier post, I mentioned that we could see a reversal. Well, the reversal persisted until $177 but fell short of the $180 target area, influenced by the outbreak of a war over the weekend and slightly hotter than expected CPI.
Keep a close eye on the critical support area at $169. Bulls will be hoping for this area to hold and facilitate a bounce. Until $182 is reclaimed, the Russell 2000 remains in a vulnerable position.
However, should it drop below $169 level, a bearish scenario could unfold.
Bearish targets:
$165
$155
Bullish targets:
$177
$181
$191
Currently, it stands at a crossroads.

Is the Russel 2000 ETF about to collapse?The charts are indicating caution.
Articles, social media, ever since the markets have been in turmoil those past two years you will now read how shrewd investors are taking refuge in precious metals and index funds for a steady yet underwhelming return in the years to come.
But what if there was no return in either until at least 5+ years?
What if the only returns to be made were with individual stock picks?
I think there’s a strong argument to be made for both. But first the Russel 2000 ETF TA, why bearish? On the above 1 month chart:
1) Price action and RSI support both fail.
2) Price action exits a bear flag with a 25% measured move to the downside.
3) MACD crossover (blue circles). A reminder this is the monthly chart. Looking left, a bearish crossover has resulted in 30% drawdowns in the market in the months the follow this signal.
4) It is interesting that a 25% correction will also find price action strike the golden ratio, which is also equal to the bear flag extension!
Yeah.. (think John Wick), it’s bearish.
Now what of this 5 year wait before a return? I think both metals and index funds are going to be brutal for any investor who enters a long positions today. Why? Look left, it is that simple.
Typically long positions before 30% corrections in this ETF required 3 years of waiting before a breakeven point, with the exception of 2007, which took 6 years. Why the difference? Very simple really, the higher they climb the further they fall.
The recent market performance from April 2020 saw 110% return for those investors who took long positions. Just as with 2002 market top after a 140% rally a long position would now take 6 to 7 years to print a return.
Why individual stock picks? This is a traders market. A blanket sweep across multiple positions is only good during times of easy money, in my opinion. Performance in the market will only be achieved through finding value stocks rather than growth. Again, my own opinion.
Since the Russel 2000 ETF started correcting in April 2021 there have been exceptional individual stock picks that have returned well over 100%. Some examples below.
Questions? just ask!
Ww
Examples of individual stocks picks that have outperformed:
Weight Watchers international, up 200% since the market low
Pacific Biosciences of California, up 170% since the market low
Vroom up over 200%

$IWM - we could see a reversalAMEX:IWM the price came down to $172 - $170 area as stated in my previous post from September 18 and bounced.
It is possible that we could see a reversal to $180 area.
Target:
$180
$189
$195
Downside risk:
$164


IWM BreakdownIWM breaking down. Next area of support looks like it will be around $145 ish. If IWM continues to breakdown, it will drag the overall market lower...look out below

IWM BounceLooking to play the bounce of the IWM.
Thesis:
Seasonality looks good for an end-of-year rally.
Interaction with lower channel trendlines that have bounced before.
Negative Divergence on the RSI.

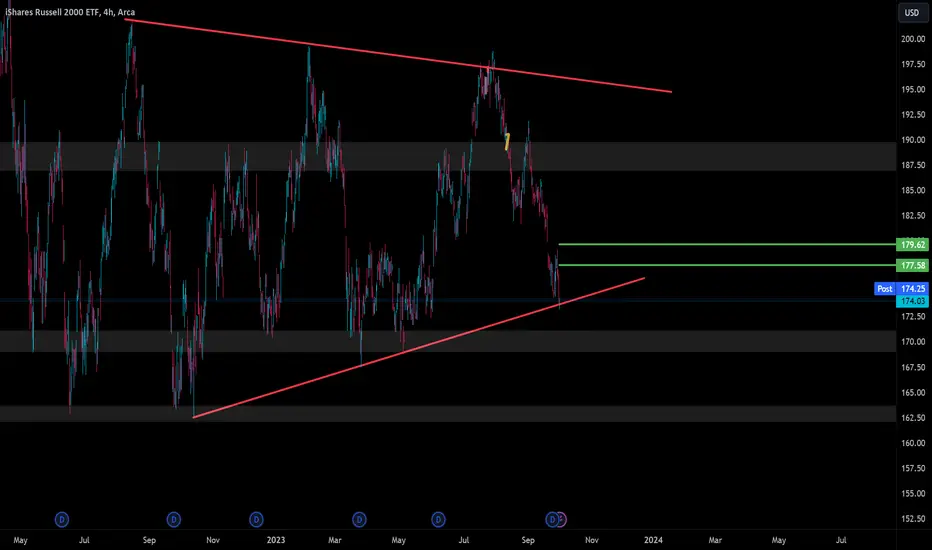
IWM: Make or BreakIWM closed in a very precarious spot.
Its really make or break here. If we bounce, the green lines are my TPs on the week with major resistance at that supply zone starting at 186.
If we break down, the demand zones are outlined below, but we don't have any major support until 171.
Let's see how we start off tomorrow.
IWM/SHY Sell SignalClear perfect H&S top in the IWM/SHY ratio chart. Predicts that short term bonds will now outperform the Russell 2k and the target of the pattern is a new low in the ratio. This implies that the Russell is likely to break to new lows while short term bonds should remain strong. If short term bonds were to decline at the same time as the Russell, the decline in the Russell will be more severe.

IWM: small-cap firms at risk as prices decline (27/09/2023)Recently, small-cap companies, in particular, have been adversely affected by the Federal Reserve's interest rate hikes. The Russell 2000 index is down 7% since the beginning of September. According to Ned Davis Research, 30% of the companies in this index have floating interest rates on their debt obligations. In contrast, only 6% of firms included in the S&P 500 index have borrowed funds under similar terms. This explains why small-cap companies are the most vulnerable to the tight monetary policy of the American Central Bank.
Considering these developments, it might be interesting to examine instruments that reflect the value dynamics of small-cap companies. Today, our focus is on the IWM ETF chart (NYSE: IWM), which invests in companies comprising the Russell 2000 index.
On the D1 timeframe, resistance has formed at 178.50, with support at 177.05. This level was broken through on Monday 25 September 2023, and a new support level has not yet been established. There is also a clear downward trend on the H1 timeframe. The price could drop to 168.25 in the short term and to 162.45 in the medium term.
—
Ideas and other content presented on this page should not be considered as guidance for trading or an investment advice. RoboMarkets bears no responsibility for trading results based on trading opinions described in these analytical reviews.
The material presented and the information contained herein is for information purposes only and in no way should be considered as the provision of investment advice for the purposes of Investment Firms Law L. 87(I)/2017 of the Republic of Cyprus or any other form of personal advice or recommendation, which relates to certain types of transactions with certain types of financial instruments.
Risk Warning: CFDs are complex instruments and come with a high risk of losing money rapidly due to leverage. 72.87% of retail investor accounts lose money when trading CFDs with this provider. You should consider whether you understand how CFDs work and whether you can afford to take the high risk of losing your money.

Russell 2000 at support levels. We have discussed the Russell 2000 head and shoulder pattern and long term double top on many venues, whether this weekend's Week Ahead" video, or on our daily FACE shows, it's a familiar chart. However, the daily RSI has just reached oversold. Oversold and become MORE oversold and the pattern targets are actually towards 2022 lows, but the 78% retracement of the March lows to July 2023 highs is at 174.42, and the ascending trend line of the Oct 2022 lows to present day is not far away. These may be levels that provide a bounce and better levels to be on the short side like closer to 180 vs where we currently trade at 174.50.

Potential downside targets (Russell)Potential downside targets for Russell 2000 based on location, trend, and structure.

$IWM: A Bounce Worth Trading?Looking to see if IWM can get a relief bounce here that could be worth trading. We'll stay tuned and find out

