FOMC pauses Rate Hikes - QQQ/ SPY/ IWM/ DXYWhats next for the markets?
A complete collapse? A blowoff top? Sideways Chop?
Lets discuss some pivotal price action
IWM trade ideas

If you count with a market crash this one goes firstMonthly timeframe chart. Price is building up a huge bearish flag, it may try another push to the flag resistance (I would open a short then) but it doesn't look good at all for the Russell 2000. Another strategy is to open a small position now and add if price hits the resistance and is rejected or add is price breaks down the flag support in the weekly timeframe. This is a long term trade it could take several weeks to play out. TP at 145 support. SL at 205 level.

Is IWM going to give up yet?This ticker is not looking good. A Head and shoulders pattern looks like it wants to play out. Huge volume by price desert with a gap to fill down around $176. Seems inevitable. Let's see if we get a neckline break this week.

$IWM - Potential Head and shoulderAMEX:IWM was rejected from upper trend line and it is now forming a head and shoulder pattern. It is currently near the neckline area which is also the 200-day moving average.
If the price breaks below $180 neckline, it can see further breakdown to $172 - $170 area with $177 being a good support and a possible reversal area in between.
If the price can bounce from here and climb back above $192, the pattern will invalidate.
The Day Ahead: IWM, QQQ, TQQQ, GDXJ, FXI, EWZIt's Friday and a Triple Witching to boot!
Well, IV isn't great here pretty much across the board for us premium sellers. Nevertheless, if you must play (and some of us gotta), here's what's shakin' ... .
Broad Market
QQQ, .8 IVR, 17.8% 30-day IV, with the shortest duration in which the <16 delta is paying greater than 1% of the strike price: December 29th.
IWM, .7 IVR, 16.8% 30-day, with the shortest duration in which the <16 delta is paying greater than 1% of the strike price: December 29th.
SPY, .9 IVR, 12.9% 30-day, with the shortest duration in which the <16 delta is paying greater than 1%: (Ugh), March (there is no February monthly yet).
Exchange-Traded Funds
Ideally, you want to hit these when IVR >50 and IV is >35%, but IVR is at rock bottom, with most skimming the very low end of their 52-week ranges. Sometimes, you just have to settle for what the market gives you.
TQQQ, 8.5 IVR; 52.6% 30-day.
GDXJ, .6 IVR; 31.6% 30-day.
FXI, 7.9 IVR; 29.4% 30-day.
EWZ, 2.8 IVR; 26.7% 30-day.
Fortunately, all of these are <$45/share, so you will be small in terms of buying power effect with the natural exception of the leveraged TQQQ, which your broker may require be cash secured on margin (which naturally makes it less sexy in that environment from an ROC %-age perspective).
Stay small and don't get all of your powder wet.

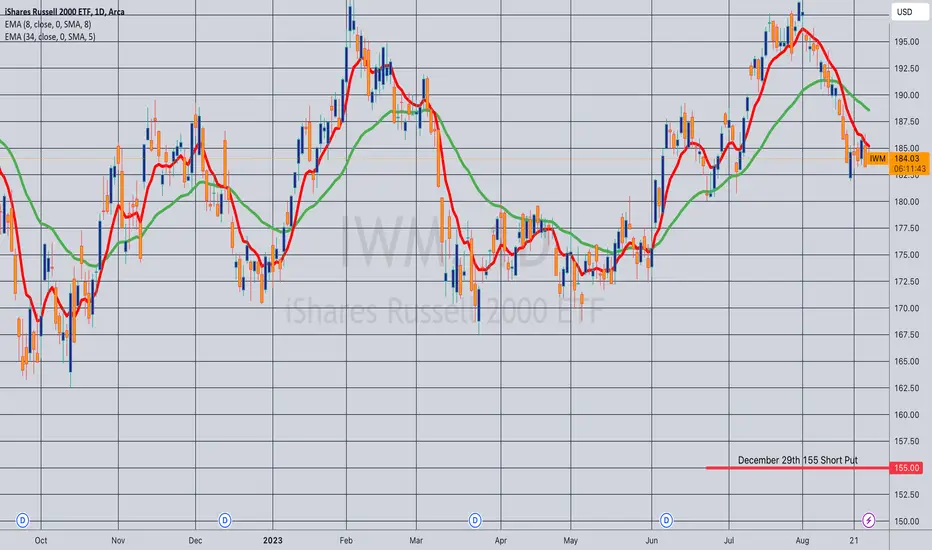
Opening (IRA): IWM December 29th 155 Short Put... for a 1.56 credit.
Comments: Rounding out rungs in the last of the available expiries in the 4th quarter, targeting the <16 delta strike paying around 1% of the strike price in credit to emulate dollar cost averaging into the broad market using short puts.
If I had nothing on in IWM, I'd probably go shorter duration (e.g., November 17th) where the 165 is paying 1.75 at the moment; I already have a rung at that strike, so am going out farther in duration to keep theta on and burning. The same would probably go for my Friday stuff in the Q's and in SPY.
Opening (IRA): IWM Nov/Dec 165/159 Short PutsComments: Targeting the <16 strike in the shortest duration paying around 1% of the strike price in credit to emulate dollar cost averaging into the broad market.
Filled the November 17th 165 for 1.71 credit; the December 15th 159, for 1.60.
Will generally look to take profit at 50% max or roll down and out for duration and a credit if tested.

IWM looking vulnerableThe Russel 2000 closed below the daily 200 MA today.
It's never a good sign for the breadth in the market when the Russel starts breaking down.
I think there's a strong likelhood we continue to breakdown, based off todays IWM price action.
Small caps got rejected today at the pre market high and just kept selling all day. What makes thing price action bad is the fact that we closed below the pre market low and the daily 200 MA.
The volume on todays close was higher than usual which also indicates some serious selling pressure.
A clear Head & shoulders pattern is apparent on the chart, if this triggers...watch out below.

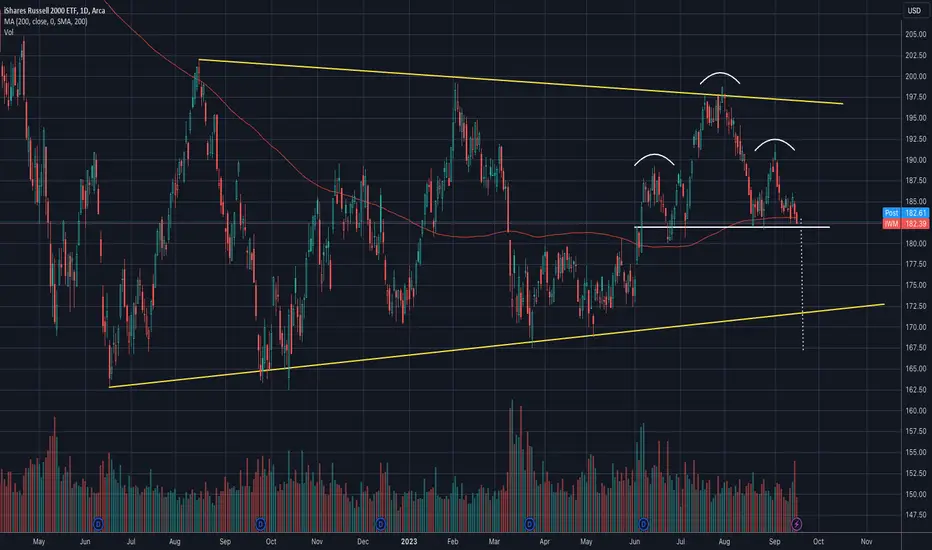
IWM - Ascending Triangle PatternIWM has been flip-flopping within an Ascending Triangle Pattern for the past 1 year+. It is no wonder that many of the smaller stocks are exhibiting wild flip-flops in the past months.
On a more optimistic note, an ascending triangle pattern has greater odds of breaking to the upside eventually. For IWM, this means a breakup above 198-199 could happen eventually (not guaranteed but good odds).
Until this happens, we might continue to see a very mixed/weak market especially for the smaller-cap stocks. Meanwhile stock picking skills with good money management is tantamont to traverse this market
If and when a breakup happens in IWM, it is likely the market bulls will be back in force.
Meanwhile, can only wait and see what happens.
Disclaimer:
TA is about improving our odds of a successful trade (not a guarantee). This is just my own analysis and opinion for discussion and is NOT a trade advice. Kindly do your own due diligence and trade according to your own risk tolerance and don't forget that money management is (probably the most) important! Take care and Good Luck!

The Day Ahead: Premium Selling in IWM, QQQ, FXI, GDXJ, SMHIt's Fryyyydayyyy ... (which is when I tend to do all my "stuff").
Well, unless you've been hiding under a rock (no judgment here), you'll know that premium-selling in broad market isn't very good here, with IWM IVR/IV at 12.3/19.7%, QQQ at 9.1/20.1%, and SPY at 6.8/14.4%. That sub-25 IVR is telling you that broad market IV is in the bottom quarter of its 52-week range which for premium-sellers is kind of drag.
Your premium-selling options in this environment (at least from a premium selling perspective) are to (a) do nothing; (b) sell your go-to delta and duration for whatever the market is paying, knowing that you might get assigned at the strike or have a poo pile to manage toward expiry; or (c) go longer-dated to get paid something decent with the probability of profit (POP) and or probability of touch (POT) that you're used to. Since I'm trying to create cash flow here (at least in the retirement account), I generally opt for (c), since I'm not fond of cleaning up poo piles with a great deal of frequency and like high POP/low POT. With that goal in mind, I generally target the shortest duration <16 delta strike that is paying around 1% of the strike price in credit.
Currently, the shortest duration <16 delta strike paying that in IWM is the December 15th 164 (14 delta, bid 1.65); in QQQ, the December 15th 325 (14 delta, bid 3.26); and in SPY, the Jan 19th 400 (16 delta, bid 4.24), so I'll look to add short put rungs in those durations or greater.
Because broad market sucks so hard though, I'll also be venturing out into the exchange-traded fund space to see if I can scrounge up any premium there. Currently, FXI (IVR 11.3/30.8%), GDXJ (7.6/30.3%), and SMH (17.6/28.7%) are at the top of my screener when sorted for 30-day IV, but you can see that IV is also at the low end of the 52 week range in that space, too. The ideal is to sell in both high IVR/high IV with IVR >50/IV>35% for ETF's, but there is nothing currently in the space with those metrics, so -- as with broad market -- you're options are the same: (a) do nothing; (b) sell your go-to delta/duration with the chips falling where they may; or (c) sell longer duration with your go-to POP/POT.
Here are the shortest duration <16 strikes paying around 1% of strike price in credit for these underlyings:
FXI, Dec 15th 22.85, 13 delta, bid .29 (don't know what the odd ball strike is about).
GDXJ, Nov 17th 29, 12 delta, bid .31.
SMH, Nov 17th 130, 13 delta, bid 1.35.
I would note that there is a highly options-liquid ETF with >50% IV, and it's TQQQ, with an IVR of 17.3 and a 30-day IV of (wait for it) ... 70.5%. It's a leveraged instrument, so I would exercise caution trading it with the expectation that, for example, the 16 delta (the 2 times expected move strike in non-leveraged stuff) is a "safe" strike to sell with limited assignment risk, a high probability of expiring worthless, and/or not being an in-the-money headache toward expiry. As long as you're familiar with all these "warts," it's probably okay to play small. That being said, it won't be particularly buying power efficient on margin; it looks like my broker's requiring that it be cash secured (most underlyings require 20% of the strike price or thereabouts in buying power), so the buying power requirement makes it "less sexy" in spite of its high IV.
Lastly, I would be neglectful were I to not mention the single name space for premium-selling here, but my general order of preference in selling premium (particularly in the retirement account) is (a) broad market; (b) exchange-traded funds; and (c) single name (in that order).
Here are the top 30-day IV, highly options liquid single name underlyings at the moment that are trading at >$20/share and with a 30-day>50%. There isn't a ton here and (as with everything else), IV is at the low end of its 52-week range (I mean 1.0? c'monnnn, you're killing me here, smalls):
AFRM (Tech/Software)), IVR/IV 1.0/75.5%
RIVN (Automaker/EV), 5.5/65.5%
TSLA (Automaker/EV), 11.3/52.7%

Opening (IRA): IWM Jan 19th 157 Short Put... for a 1.58 credit.
Comments: Targeting the <16 delta strike paying around 1% of the strike price in credit to emulate dollar cost averaging into the broad market. As I mentioned in my earlier post (See Below), shorter duration is probably paying, but I already have rungs on in the Nov 17th, Dec 15th, and Dec 29th expiries, so going out to 2024 here.
Naturally, I'll sell in shorter duration if I can get in at strikes better than what I currently have on.

Russell 2000 is CHEAP relative to S&P500AMEX:IWM long vs AMEX:SPY short
--------------------------
This is a "spread trade" between two indexes which is sometimes called a "pairs trade". Typically a "pairs trade" is between two similar stocks in a similar industry whose fortunes are tied together to a similar end user or buyer. Imagine NYSE:KO and NASDAQ:PEP (Coca-Cola vs Pepsi) as a decent example.
The typical "pairs trade" swings back and forth on expectations from different economic environments. The Russell 2000 ( AMEX:IWM and CME_MINI:RTYM2023 ) can be influenced by perceptions of interest rates and projections of economic activity. The rationale is that smaller companies like those in the Russell have higher dependency on borrowed money and will be hurt more in an economic contraction. They don't have the international reach and have more risk to the domestic economy and have lower borrowing capacity, which makes them overall more risky.
This isn't necessarily true, but it is the way the market views this trade and what gives it the potential to generate returns.
What this ratio tells me here is that expectations are very low for Russell 2000 companies and very high for S&P500 companies and that there may be risk to that assumption. Therefore, we should research into the actual facts and see if that is true.
The fact is that here at current levels the Russell2000 has lagged the S&P500 Index by 30% from the high in 2021 but in order for this ratio to move back to the levels of 2017-2018-2021, it would need to advance by over 45%.
How much do we risk in this trade here? The average "monthly" range in this ratio is about 4%, so we can risk about 4%-5% and admit we are wrong if the ratio slides under 0.41 (the bottom of the green box). The upside? Let's see how it moves, but the goal initially would be a gain of 3x the average monthly range or 12%-15%.
Tim 11:11AM EST 5/1/2023

IWM Head and shoulderAMEX:IWM has repeatedly zig zagged and it might actually be on the way to breaking down further with a well formed H&S

Opening (IRA): IWM October 20th 173 Short Put... for a 1.78 credit.
Comments: My weekly short put in the small caps exchange-traded fund, targeting the <16 delta strike in the shortest duration paying around 1% of the strike price in credit.
This is to emulate dollar cost averaging into the broad market without actually being in the stock.

IWM - the small caps get smallerBearish pennant "may be" done here. Above 203 on IWM and the idea is probably INVALID. I've pointed out the SPY/IWM monthly bull flag before (idea is linked below). If correct, it shows IWM losing considerably to the rest of the market. Why? Well I'm still wary of the Banks even though it's been a minute since anyone has really thought they are a problem. Interesting as KRE still looks completely bearish.
I believe IWM will lead the correction with Tech staying stronger for a short while. IWM bear pennant is hinting at a larger correction for the market, however if it's an ABC it would also be a wonderful buying opportunity when it's finished.
Good luck!

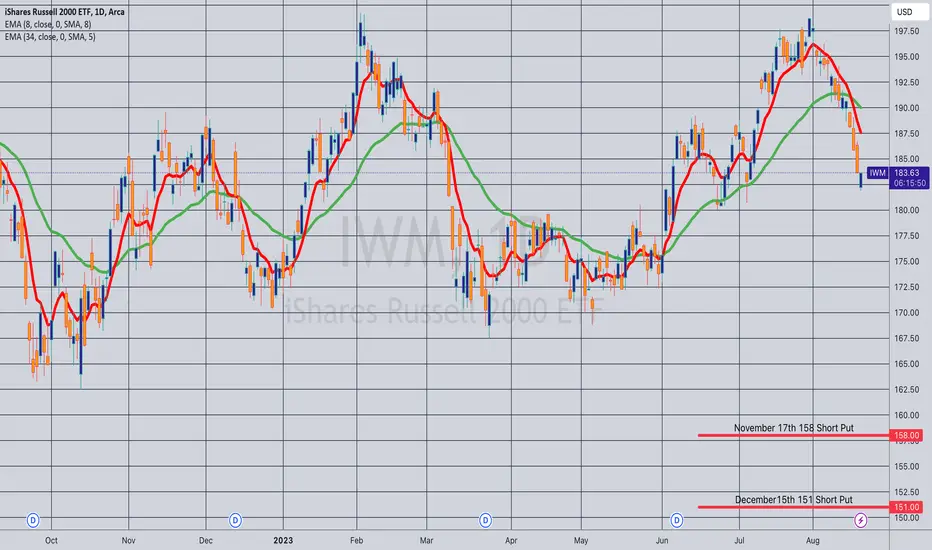
Opening (IRA): IWM Nov/Dec 158/151 Short PutsComments: Targeting the <16 delta strike in the shortest duration paying around 1% of the strike price in credit to emulate dollar cost averaging into the broad market. Generally, will take profit at 50% max, roll down and out for a credit if tested.
November 17th 158: 1.60 credit
December 15th 151: 1.51 credit
Russell is dancing on the clif"The Russell 2000 index (IWM) is currently displaying a weak and bearish pattern.
After a significant downward move, IWM formed a substantial symmetrical triangle, which is typically considered a bearish pattern, often referred to as a bearish pennant.
Around mid-July, the index broke out to the upside from this symmetrical triangle, marked with a circle. At that point, it seemed that the Russell was poised for an upward trend. However, a lesser-known pattern known as the 'death hook' emerged. The death hook, or fake breakout, is a potent trend reversal pattern that tends to occur during situations of fake breakouts or breakdowns. It appears that this pattern has manifested in the case of the Russell.
This suggests that the breakout was deceptive, enticing smaller market participants to enter the market before reversing course and moving sharply downward. While a minor bounce may occur, it's expected to be short-lived.
In all likelihood, the price will eventually break down from this bearish pattern and continue its descent. The only potential scenario for the bulls to regain control is if they intervene decisively, triggering another breakout to the upside accompanied by strong trading volume."

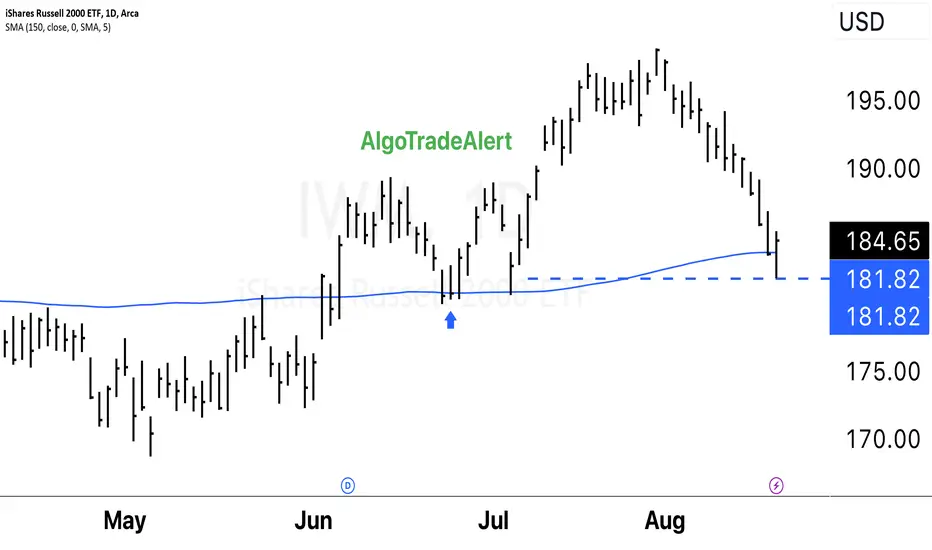
$IWM Bullish Daily Close AMEX:IWM Small Caps had a Bullish Daily Close. Tested my support level. Small caps will lead the broader market. The IWM is more sensitive to liquidity. I have been long since the blue arrow.
A "double bottom" is a bullish reversal pattern that occurs after a downtrend and is characterized by two consecutive lows at a similar price level, followed by a breakout above the pattern's neckline. This pattern suggests a potential reversal from the downtrend to an uptrend.
A "false breakdown" occurs when a price breaks below a support level but quickly reverses and closes back above it. This can be interpreted as a bullish sign, indicating that the selling pressure wasn't sustained, and buyers stepped in to push the price back up.
The idea that "the best moves come from failed moves" is a common adage in trading and investing. It suggests that when a market or a security initially breaks out or breaks down and then reverses, it can lead to strong price movements in the opposite direction. This is often attributed to the idea that traders who were positioned on the wrong side of the initial move are forced to close their positions, contributing to the momentum in the opposite direction.
It's important to note that while these concepts are commonly discussed in trading circles, they are not foolproof strategies. Technical analysis is just one approach to understanding price movements in financial markets, and it should be used in conjunction with other forms of analysis and risk management strategies. Markets can be unpredictable, and there is no guarantee that any pattern or signal will always lead to a profitable outcome.
IWM - Rising Trend Channel [MID-TERM]🔹Rising trend breaking downwards in medium long term.
🔹Between support 170 and resistance 199 in Rectangle Formation.
🔹Broken through support at 188, indicating a falling direction and predicting further decline.
🔹RSI curve indicates a potential early indication of a falling trend in the price.
🔹Technically NEGATIVE for the medium long term.
Chart Pattern:
🔹DT - Double Top | BEARISH | 🔴
🔹DB - Double Bottom | BULLISH | 🟢
🔹HNS - Head & Shoulder | BEARISH | 🔴
🔹REC - Rectangle | 🔵
🔹iHNS - inverse head & Shoulder | BULLISH | 🟢
Verify it first and believe later.
WavePoint ❤️

IWM BEARISH (16 AUG)The price of IWM is forming a bearish continuation chart pattern (the interest rate is 5%)
the chart show rejection at the resistance level for the 3rd times.
therefore, i decide to place entry here with stop loss above structure
take profit is at the low (demand zone weekly)

$IWM $RUTRetest of breakout still looks to be on track, plan to accumulate around the retest area depending on overall market conditions.

Calculating Options Expected Move I had a request to go over how to calculate the expected move from options.
As well, I posted my own indicator that does the calculations for you.
So, I decided to go over both, the theory and process for calculating the expected move from options and also the indicator and how to use it.
Hope you find it helpful!
Safe trades everyone!

IWM - Rising Trend Channel [MID-TERM]🔹Breakout resistance 179 in double bottom formation.
🔹Approaches resistance at 198 potential NEGATIVE reaction; upward break POSITIVE.
🔹Technically NEUTRAL for medium long term.
Chart Pattern;
🔹DT - Double Top | BEARISH | 🔴
🔹DB - Double Bottom | BULLISH | 🟢
🔹HNS - Head & Shoulder | BEARISH | 🔴
🔹REC - Rectangle | 🔵
🔹iHNS - inverse head & Shoulder | BULLISH | 🟢
Verify it first and believe later.
WavePoint ❤️
