IWM trade ideas

Small Caps Are BackDon't miss out on the rest of the run just because you missed the first move.
*** Price action breaking above the 200 moving average after a healthy move that sustained
*** Plenty of head space to upper resistance
*** Lagging SP500 and NASDAQ

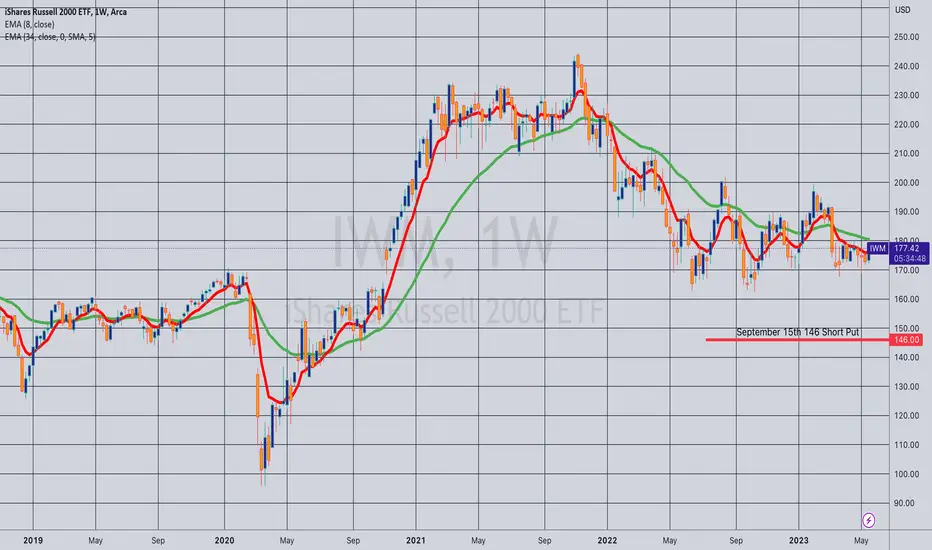
Opening (IRA): IWM September 15th 146 Short Put... for a 1.46 credit.
Comments: Re-establishing a September rung after scratching out a higher strike trade yesterday, targeting the <16 delta strike paying around 1% of the strike price in credit to emulate dollar cost averaging into the broad market.
The shortest duration trades in which the <16 delta strike is paying around 1% in credit:
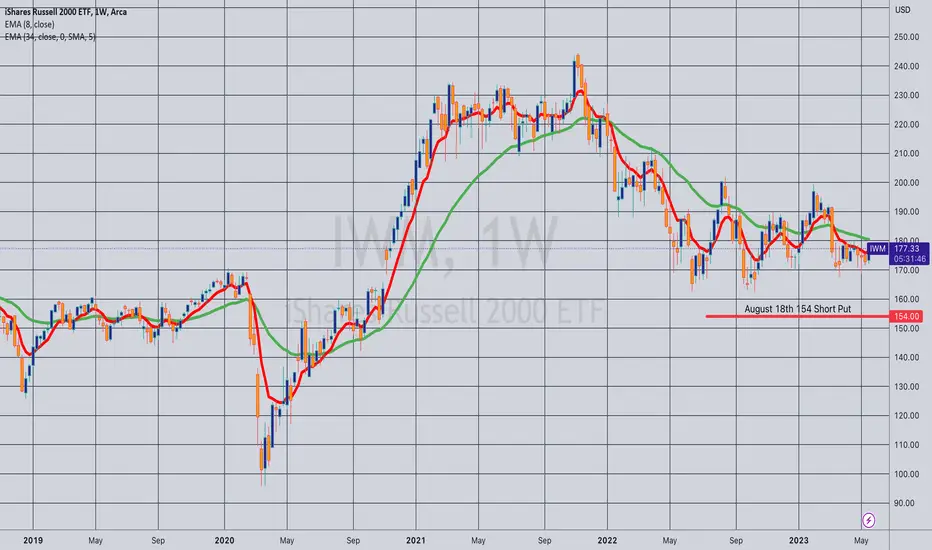
IWM: August (at the 154 strike, paying 1.58)
QQQ: August (at the 296 strike, paying 2.99)
SPY: September (at the 367 strike, paying 3.70).
Opening (IRA): IWM August 18th 154 Short Put... for a 1.60 credit.
Comments: Targeting the <16 delta strike in the shortest duration paying around 1% of the strike price in credit to emulate dollar cost averaging into the broad market. Would like higher IV to sell shorter duration in, but you can't have everything.
$IWM Pierced 50% Fibonacci levelAMEX:IWM has a lot of bank stocks in the #russel2000 and is up over 2% today. Pierced the 50% Fibonacci level today. This tells me the #Federalreserve will pause tomorrow. #jeromepowell

Stock Chart Analysis 101, Recognize the PatternsIf you check my previous post about AMEX:IWM you will see that I signaled the potential for a lower high here. This is no confirmation of that being correct just yet. I just thought the opening of the week was extremely interesting.
Check out the Equity Channel Podcast on Apple, Amazon and Spotify for more information on trading and investing.

$IWM beginning of an uptrendAMEX:IWM beginning of an uptrend. #russel2000 Closed above the horizontal line and above the 20 and 50 weekly moving averages. Now it needs bullish consolidation and a retest of the horizontal line before it can break through the 200 weekly moving average.

Is This Another Lower High Incoming for Russell 2000?Check out the Equity Channel Podcast for more insightful trading and investing ideas.
Listen Here:

$IWM - Local technical breakout. Is it the right time to long?AMEX:IWM
Daily: Golden cross in process, however not happened yet.
Overall bulls are not in control yet below 189/190+. AVWAP at 188.19
Short-term, bulls legitimately succeeded to trigger a technical breakout at 180.85 with volume!
As long as 180.85 hold, price should head into 184.28, 188.74, 189.93 (breakout > 199.31).

WEEKEND UPDATE JUNE 4 2023 - SMALL CAPS JOIN THE PARTYMacro
2/10 YR CURVE - Inverted = -.81 (More Negative from -.74 last week)
HIGH YIELD SPREADS = 4.65 (Up from 4.58 last week)
US ISM PMI - Contracting Faster = 46.90 down from 47.10%
US ISM SERVICES - Growing Faster = 51.90% up from 51.20%
S&P 500 ( SPY ) - Investable
Nasdaq100 ( QQQ ) - Investable
Russell2000 ( IWM ) - Investable
Gold ( GLD ) - Investable(Pullback)
US 30yr Treasury Bonds ( TLT ) - Not Investable
US Dollar ( UUP ) - Investable
US Real Estate ( IYR ) - Not Investable
European Equities ( VGK ) - Investable(Pullback)
India ( INDA ) - Investable
Broad Asia Equities ( VPL ) - Investable
China A-Shares ( ASHR ) - Not Investable
Emerging Markets ( EEM ) - Investable (Pullback)
Wheat Futures (ZW) - Not Investable
Corn Futures ( ZC ) - Counter Trend Rally
Soybean Futures (ZS) - Not Investable
Silver ( SLV ) - Investable(Pullback)
Natural Gas Futures ( NG ) - Not Investable
Volatility Levels
S&P 500 - 14.60 - Investable Market (Down from 17.95 last week)
Nasdaq100 - 19.29 - Investable Market (Down from 22.21 last week)
Russell2000 - 20.88 - Investable Market (Down from 23.51 last week)
S&P 500 Volatility Structure - Normal Contango Structure
VIX 9-Day - 12.74
VIX Short Term - 14.50
VIX - 14.60
VIX Long Term - 14.79
Now, here is the list of individual ETFs and individual names are showing strength.
Strongest of our ETF universe
SVIX
SMH
XLK
QQQ
IGV
IWF
NIB
ARKF
ARKG
XLY
QUAL
EWJ
Strongest of our ETF Leveraged/Inverse Funds
KOLD
TQQQ
SOXL
QLD
SDP
KORU
WANT
SPXL
SPUU
RXD
INDL
Strongest of our Individual Equities
MDB
NVDA
META
AMD
CFLT
MRVL
AVGO
HUBS
EXAS
BLDR
GOOGL
NOW
SNPS
MSFT
CPRT
NET
AMZN
NFLX
ADBE
LRCX
TTD
RCL
SHOP
PACB
AKAM
TTWO
ORCL
KLAC
FSLY
VRSK
PANW
WDAY
ACN
MU
AMAT
CRM
AAPL
VMC
CDNS
SPLK
ASML
UBER
CCL
MLM
SNOW
DVA
CEG
ANET
DRI
IT
FTNT
COF
PTC
FLT
NTAP
STZ
MCK
PWR
MCO
GRMN
IPG
ETN
KEYS
NWS
SPGI
ANSS
STE
CSCO
CTAS
MKC
MPWR
EFX
TER

$IWM, #RUTAMEX:IWM , the Russell 2000, experienced a significant move on Friday, June 2nd, accompanied by high trading volume. On the daily chart, it successfully broke out of its structure, indicating the next potential levels at $185-190. If it manages to surpass this range, it could potentially reach $200 and even $220. It is worth noting that there are several bullish setups observed in mid-cap stocks.

IWM/SPY bounced off covid lowsimple long short, invalidation on breaching line, TP wherever tf u want (once cyclical sector growth starts slowing / negative catalyst hits?)

Still alive but...This is very risky, I bought puts strike 174 expire 06/16. I'm giving it a month, my idea is that the HS is going to to play out eventually but it may take some time. If it works, price will drop very fast.

The Russel is testing a weekly downtrend linePay close attention to the weekly trend line and the 200 days MA line
Going down?
Or are we heading toward a massive rally?
Time to make some decisions!

IWMBroke from under its 200sma today for the first time since March.
Currently outside Daily bbands sowe may see a pullback and we retest of 179-178..
Only bearish if we close back below 177.
Next resistance is 183 or weekly 200sma, if it breaks over that then IWM is headed back to 192.
Either wait for the 178 backrest or wait for a close above 183 to go long.

Opening (IRA): IWM August 18th 148 Short Put... for a 1.48 credit.
Comments: Targeting the <16 delta strike in the shortest duration paying around 1% of the strike price in credit to emulate dollar cost averaging into the broad market.

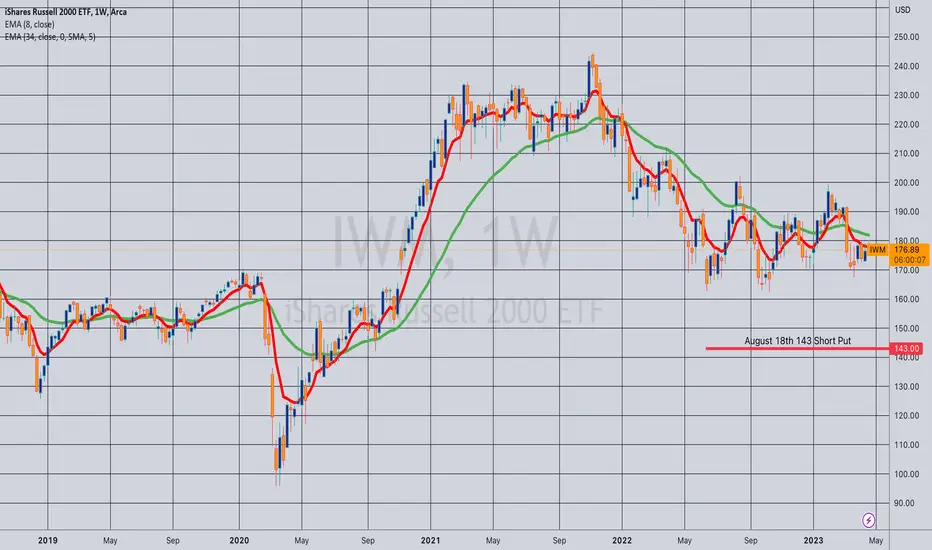
Opening (IRA): IWM August 18th 143 Short Put... for a 1.46 credit.
Comments: Starting to build out my short put ladder into the third quarter, targeting the <16 delta strike paying around 1% of the strike price in credit to emulate dollar cost averaging into small caps.
Using Pinescript for BacktestingA bit of a lengthy video on using pinescript to develop your trading strategy.
I just basically go over very basic functionality to get you on track if you have an interest in using pinescript for these functions.
If you are interested in seeing a little more advanced stuff or seeing how to repurpose pre-existing indicators into strategies, leave a comment and this could be a future tutorial!
I have also done a tutorial on using Excel to backtest your Strategy which is available here:
Thanks for watching!

$IWM Outlook 05/30 - 06/02 @capgainsgroupAs the S&P 500 and the NASDAQ rally into the green for the year, the Russell 2000 (aka the small cap index) has lagged behind and is barely green at +1.03% YTD for 2023. One of the reasons why this index hasn’t been doing well can be attributed to the index’s 15.18% allocation in the Finance Sector. Failing regional banks such as Silicon Valley Bank ( NASDAQ:SIVB ) and Signature Bank ( OTC:SBNY ) haven’t helped the index much.
Investors who would like to play the Russell 2000 should pay attention to the 5 major sectors that makes up 73.23% of AMEX:IWM : Health Care (17.62%), Industrials (16.66%), Financials (15.18%), Information Technology (12.74%), and Consumer Discretionary (11.03%).
Technical Analysis:
AMEX:IWM recently formed a Death Cross (50 SMA x 200 SMA) on the daily chart in mid April. Although not very clean, there is a support uptrend line dating back to October 2022. Also, it seems like we have a head and shoulders pattern, using the Daily 170.30 level as the neckline.
Bulls will want price to reclaim the weekly 178.90 level as a support.
I lean bearish on this index. If AMEX:IWM can’t reclaim the two daily gaps above, at 176.74 - 177.42 and 180.53 - 181.28, I expect it to come down and test the yellow uptrend line and potentially break it to the downside in the coming weeks.
Upside Targets: 176.74 → 177.42 → 180.71 → 181.28 → 183.76 Extended: 186.91
Downside Targets: 174.09 → 172.33 → 171.41 → 170.30 → 169.32 Extended: 166.81

IWM has bottomed out, Upside potential toward 218IWM has bottomed out and is likely to head toward 218 by the end of this year.

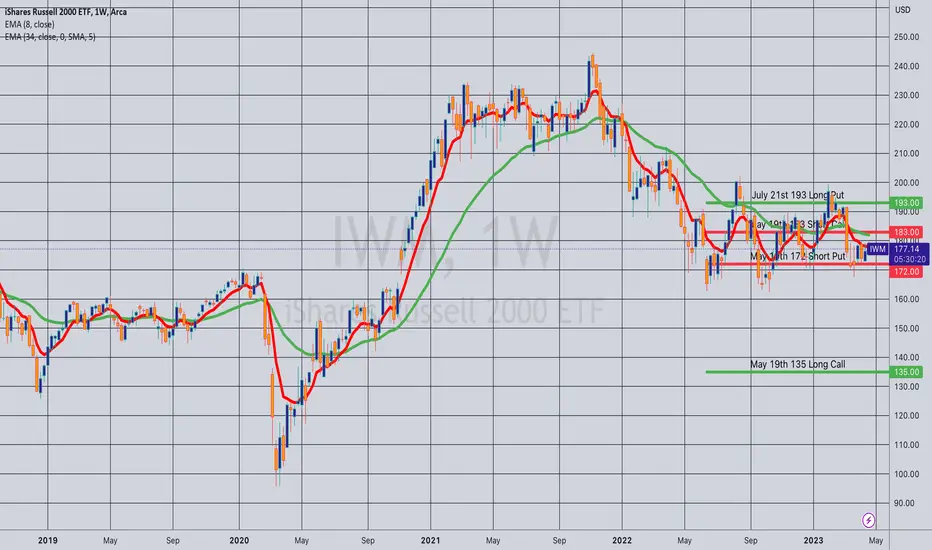
Opening (Margin): IWM May 19th/July 21st Double Diagonal... for a 56.60 debit.
Comments: Since my previous double diagonal in IWM was such a hoot (See Post Below), re-upping here. Buying the back month 90 delta strikes (both call and put) and selling the front expiry 30 deltas, with the result being a delta neutral setup on fill.
As before, I tend to manage each side individually, so keep track of both my global cost basis, as well as side cost basis and break evens. These start out as:
Long Put Diagonal Aspect (May 19th 172 short put/July 21st 193 long put):
14.17 cost basis/178.83 break even/21 wide
Long Call Diagonal Aspect (May 19th 183 short call/July 21st 135 long call)
42.43 cost basis/177.43 break even/48 wide.
As before, I'll look to roll out the short put aspects to the shortest duration 30 delta when the short option reaches 50% max that is at or above my cost basis (in the case of the short call), at or below my cost basis (in the case of the short put), liberally taking profit on sides should that happen.
Using Excel to Backtest your Strategy Hello everyone!
This is a tutorial video on how to use Excel to backtest your strategies using technical indicators on Tradingview.
This provides the foundations for you to get creative and have the essential tools and knowledge required to begin back-testing your strategies using Excel.
There is much more than can be done using Excel for back-testing, so if you are interested in seeing more in-depth functionality for more advanced back-testing methods, let me know below!
The essential functions in this video are the conditional functions of Excel. These are the "If" "Then" statements.
The code used to identify conditions are:
Single condition:
=if(condition1,"Result1","Result2")
More than One Condition:
=if(and(condition1, condition2, condition3, etc.),"Result 1", "Result 2")
If you do not have Excel, you can use OpenOffice which is opensource and free to use!
As always, let me know your questions and comments below!
Safe trades everyone!

U.S. Stocks final peakThe graph presented analyses SPX, IXIC and IWM; by valuing them against bonds adjusted dollar and gold. For explanation refer to the graph tagged.
Thanks!
