Opening (IRA): IWM March 24th 175/May 19th 202 LPD*... for a 20.52 debit.
Comments: Resetting my short delta hedge against a long delta portfolio ... . You know the drill: buying the -90 put in the back and selling the +30 delta put in the front.
20.52 cost basis with a 181.48 break even on a 27 wide.
* -- Long Put Diagonal.
IWM trade ideas

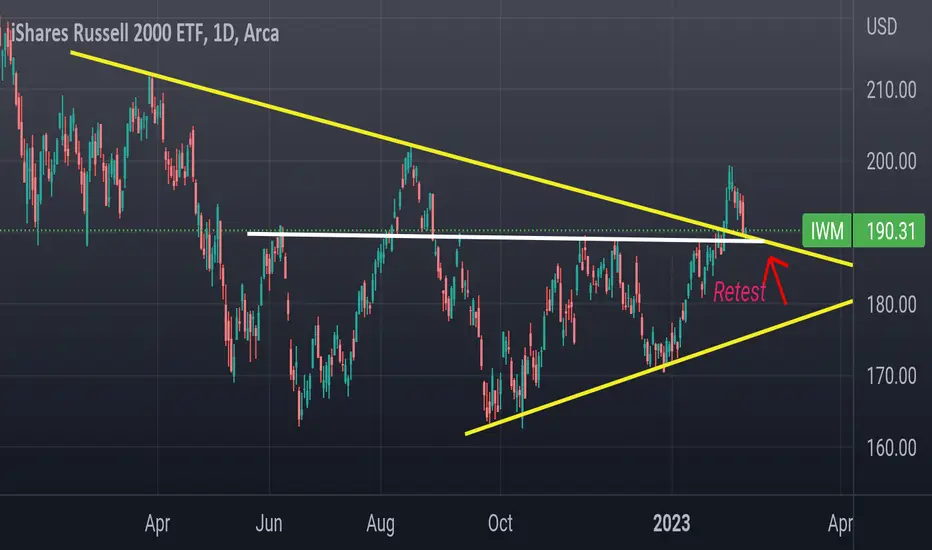
IWM Head and shoulder pattern completed at December lows or 170..
Next move is to retest that neck line at 181 but the first target will be 177...
177 will be a tough nut Crack. Look to cover and renenter over 178 if there is a struggle at 177

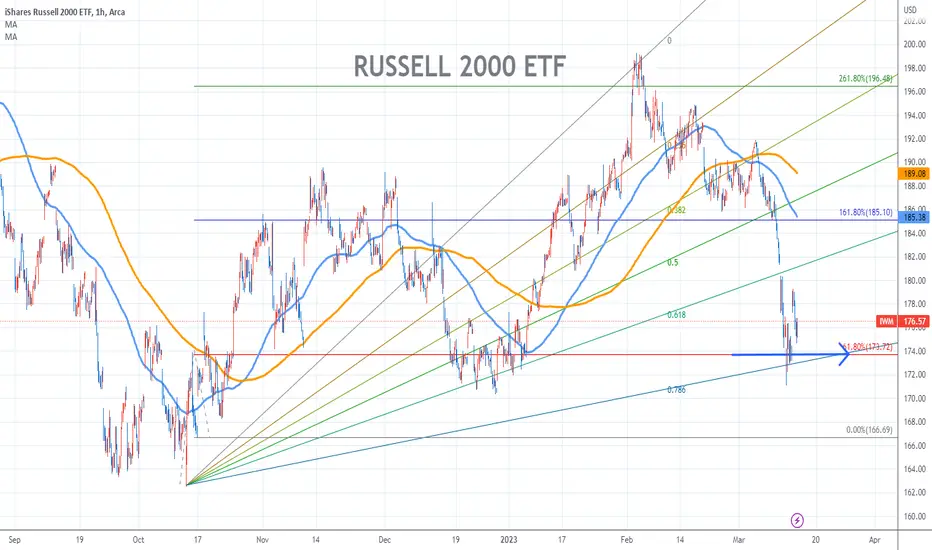
RUSSELL 2000 ETF Chart Fibonacci Analysis 031423 1) Find a FIBO Slingshot
2) Check FIBO 61.80% level
3) Entry Point > 173 /61.80%
IWM rejection at the 18 monthlyAlthough there is support for IWM between 182-1, I think the real target will be the combination of the monthly BB and 100 ma, around 158-156. Structural trendline (purple) looks right and it's no surprise it showed up at the 18ma exactly to regect the advance.
IWM divided by SPY is a bull flag, so I expect IWM to sell off much more than spy once it breaks out - which looks to me like it could happen this month.
Good luck!

Opening (IRA): IWM March 10th 182/April 21st 204 LPD*... for a 16.20 debit.
Comments: Re-erecting my short delta hedge in IWM after taking off my earlier setup in profit. Back the -90 delta put in the back and selling the 30 delta put in the front. 16.20 cost basis with a 187.50 break even on a 22 wide.
* -- Long Put Diagonal.

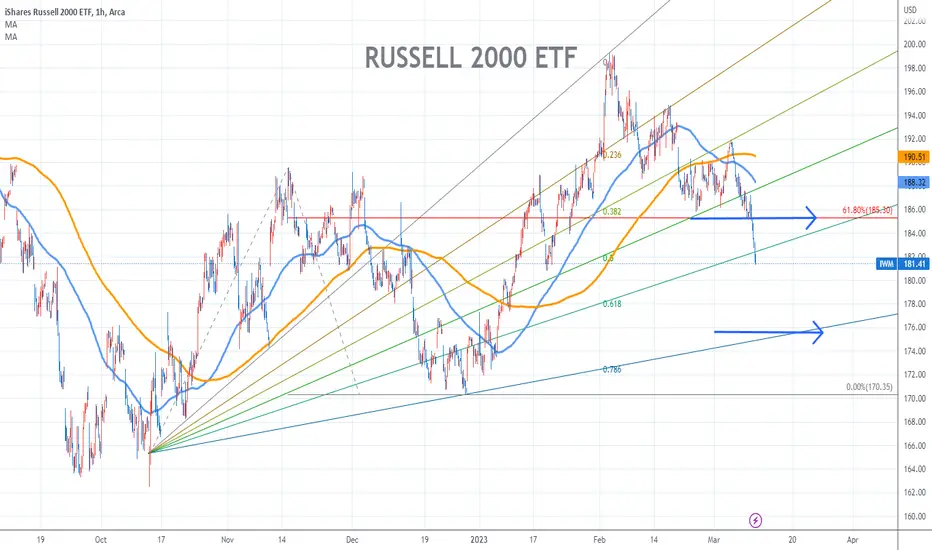
RUSSELL 2000 ETF Stock Chart Fibonacci Analysis 030923 1) Find a FIBO Slingshot
2) Check FIBO 61.80% level
3) Entry Point > 185/61.80%
IWMSmall caps underperformed here.
IWM closed right on that 188 support with a bearish engulfing candlestick.
Below 188 and we head to 185. 185 will be a tough nut to Crack, just throw on your EMA and look. If we drop below 185, I'd be looking at a trend reversal to 177-180.
If 188 holds then there's no short here and I'd look for price to go back and test that white trendline resistance

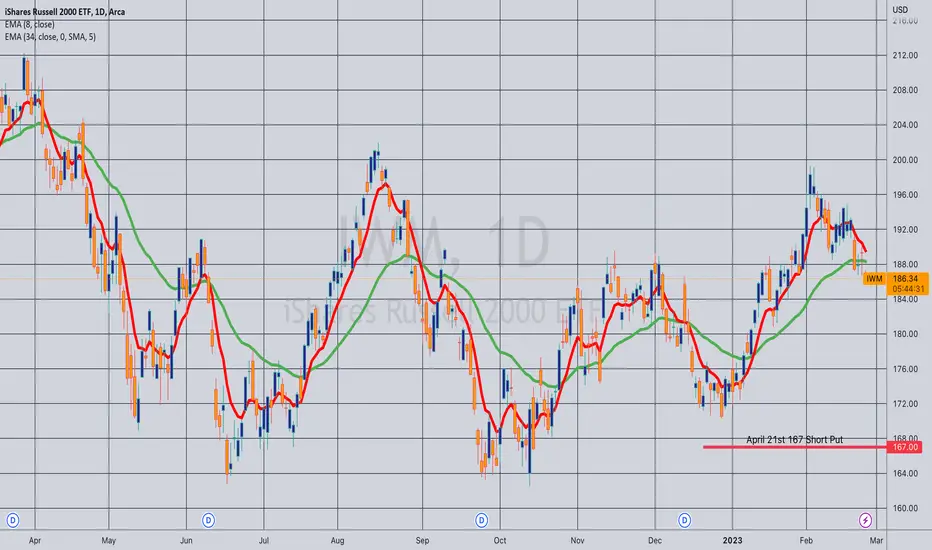
Opening (IRA): IWM April 21st 167 Short Put... for a 1.74 credit.
Comments: Adding rungs in broad market here on this weakness, targeting the shortest duration <16 delta strike paying around 1% of the strike price in credit to emulate dollar cost averaging into the broad market.
IWM Wed Swing Turtle Soup LongToday was one of the most difficult trading days many have seen. It had me thinking. Generated buyside liq above Mon and today's high. Also relative highs with last Thursday's high.
The 4 day trading week generated some buyside as well, yet also comes with some bearish undertone. One could argue we have yet to make a daily lower low in this trend.
You know how last week was a 4 day trading week? There's some unbalanced price ranges in the premium market that could go for some balancing. PMI is projected to release higher than prior. and that would carry volume.
There is also intraweek buyside above the 4 day week's highs that could be swiftly repriced to. I'm thinking we may end up having a Wednesday weekly reversal to the upside.
We have some bullish structures to base trades and risk off as well. 1hr OB provides decent upside targets considering the timeframe and relative risk.
Market just feels like it's in seek and destroy. Might as well attempt to take advantage of volatility!

Opening (IRA): IWM Feb 24th/April 21st 185/208 LPD*... for a 17.30 debit.
Comments: Resetting my broad market short delta hedge against a long delta portfolio in IWM here buying the back month -90 delta and selling the front month +30 delta. Cost basis of 17.30 with a 190.70 break even on a 23 wide.
* -- Long Put Diagonal.

Rolling (IRA): IWM April 21st 166 to 174 Short Put... for a .77 credit.
Comments: (Late Post). Rolling up for a realized gain to the <16 delta strike paying around 1% of the strike price in credit. Total credits collected of 1.68 (See Post Below) plus the .77 here for a total of 2.45 ($245).

Opened (IRA): IWM July 21st 155 Short Put... for a 1.87 credit.
Comments: Did a few things right at the close ... . Went out a smidge more long-dated since I have positions on in April, May, and June. Just looking to get more capital deployed. Targeting the <16 delta strike paying around 1% of the strike price in credit to emulate dollar cost averaging into small caps. Will generally look to do something at 50% max (e.g., roll up, roll out, etc.).

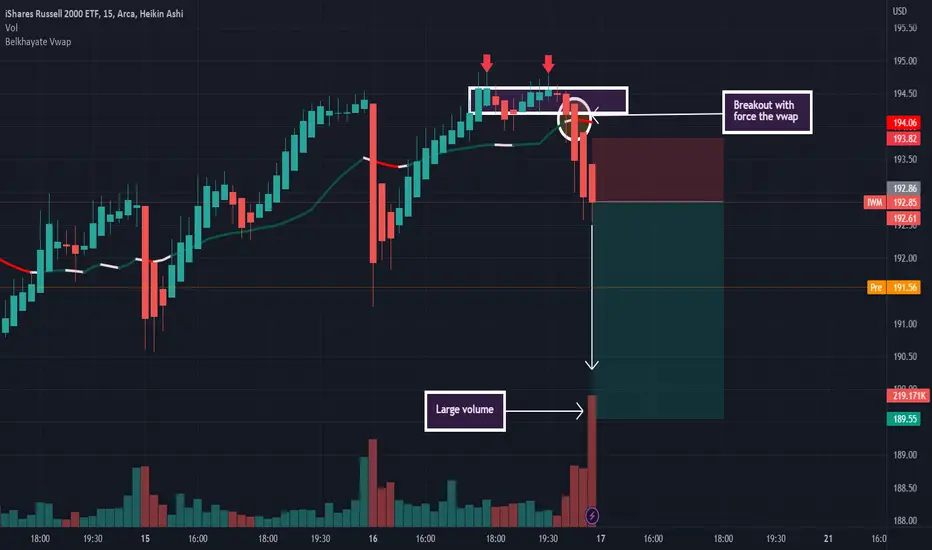
IWM: Sell ideaAs you see on the chart we have a sell idea because we have the breakout with force the vwap indicator and the support line by a big red candle with a large red volume.Thanks!
IWM retestedRetested support at 188 and bounced.
If 188 holds - long target 200 gap close.
If 188 folds - short to - 180
Opening (IRA): IWM October 14th 160/December 16th 194 LPD*... for a 26.09 debit.
Comments: Short delta hedge against a long delta portfolio. 26.09 cost basis on a 34 wide with a 167.91 break even, a 7.91 ($791) max, and a 3.96 ($396) 50% max. The preference would be to put these hedges on in strength, so probably not the best setup as a standalone trade.
* -- Long Put Diagonal.

IWM daily sell, it's over for small capsIWM after it was rising up and hitting overbought territory there was a chance for small caps to have a beautiful bull pullback. But then yesterday, instead of a small candle on a small volume, after a small gap up, it start to drop and drop and didn't finish till market close. With it, IWM breaks a major support line from its channel and found its first support on 20 days MA. Will 20 days MA hold support it is yet to see, but chances are small.
Volume is increasing but is still below 20 days average volume so this drop is not the best example of the breakout.
RSI is dropping hard.
MACD is full bearish with histogram ticking red and with MACD crossing below signal line signaling down we go.
Overall: IWM could find some support at the dotted line, but will it hold? It was resistant 3 times and once support but it is below 20 days MA, meaning if drops below 20 days MA there is a huge chance it will just be blasted below that support line. The next major support line is a bundle of 50 and 200 days MA. Breaking below them small caps ETF is for sure going to test lows from 2022 and almost certain at new lows.
However, from the bullish side of view, it is still not yet over. Bulls have to find power and start buying it but need to do it the right way. They still can have their bull pullback pattern and bring it too high but need to step in and start buying hard.

IWM - Russell 2000 Small Cap ETF - OVERBOUGHTRSI has fallen back under 70 & ADX is rising. Selling could become a STRONG TREND as the dollar rebounds with rising yields. Expecting a $VIX spike to occur if $DXY continues upward. Staying HEDGED for the DEBT BUBBLE implosion with $UVIX $UVXY $HDGE $TZA

The Russell Riddle: which chart is 2008? ($IWM W) For the answer, scroll down to the comment section.
Two charts of $IWM weekly TF.
One chart is current (as of 2/4/2023).
The other is 2008 ,up to 4 candles before the 50% drop.
Which one crashed 50%?
The conundrum: why do we assess current price action as bullish, when a similar pattern resulted in the GFC in 2008?
There are many possible answers, none of them wrong.
The one that interests me is the possibility that our bias is more extreme when we have experienced (traded) the price history. In this case it means experiencing the climb from the October 2022 lows. The alternative is basing our bias on the price history in a chart but *without* experiencing the returns themselves. For example IWM's similar price action in 2008. Any difference in sentiment would be consistent with studies showing that decisions made from experience often diverge from those based on description.

Opening (IRA): IWM February 17th 193 Covered Call... for a 183.77 debit.
Comments: Since I still have broad market short delta hedges on in IWM, QQQ, and SPY, replacing a lot of the long delta I took off yesterday in one fell swoop here with covered calls. Here, I'm selling the short call paying around 1% of the strike price in credit. The 193 is paying 2.10 ($210) at the moment, and I'll look to roll it at 50% max.
This isn't the best place to be doing this, since IWM is well off its lows and risk premium has collapsed here, but am just looking to keep my portfolio "net delta happy" for the moment.

#IWM Russel 2000 looking technically bullishSome real meaningful progression for the bull case in US small cap stocks.
50 dma > 200dma
Price has cleared the critical resistance level between 187-188.
Price has some short term resistance at the 38.2% fib retracement here, but it looks like we should progress to the next resistance level at the 50% fib retracement at 200.
Chart is showing a clear formation of higher swing lows and higher highs.
Hard to be bearish this chart.
Opportunity here to buy the breakout with a relatively small stop as a close below 187.50 might put the bullish case on hold.

Trade Recap & Daily Levels: IWM SPYTrade recap and levels to watch today on IWM and SPY.
Trade recap until 7:41
Levels at 7:41.
Clarification on IWM: I say I got out but I meant to say I scaled out some!

$IWM Breaking Out?See Notations on chart... If this continues a good trade may be $ARKK? TBD. Ideas, not trading / Investing advice.

DECEMBER FED MEETING Just a look back at what happened. We did have the CPI report the day of the fed meeting creating extra pressure
