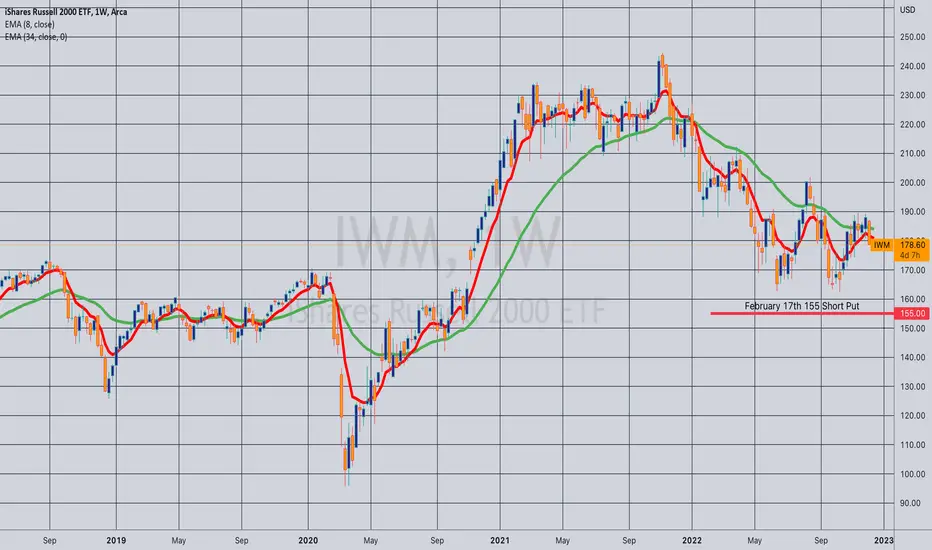
Opening (IRA): IWM February 17th 155 Short Put... for a 1.62 credit.
Comments: Squeezing in some rungs where I can, targeting the <16 delta strike in the shortest duration paying around 1% of the strike price in credit.
IWM trade ideas
IWM SHORTHello guys, I share my next trade idea, the price has made a double ceiling at the price of 188.00, at this moment it has broken the green trend line and has broken the base of the double ceiling, we will seek to enter short, looking for the projection according to the distance from the base to the tip of both roofs.

Russel 2000 Bear Market?It seems by all indications that we are heading into a bear market. With raising interest rates, tapering, and shrinking of balance sheets, we will see the Russel take at least a 20% tumble from the current price. The 100MA puts the Russel 2000 at around 1400, and further down on 200MA. A couple of key points:
Only 40% of Russel 2000 are above 50-Day MA.
Only 45% of Russel 2000 are above 50-Day MA.
MACD is crossed and looks bearish.
Fed slowing down its QE.
I was a bit curious why the Russel 2000 took a dip in 2018-2019 with the economy doing so well then. The one thing that I could overlay to make some sense to it was the Federal Funds Rate went up to 2.42%
Even mainstream investors like Jon Najarian has taken short positions in the IWM for February. The economics speak it, the Fed speaks it, the indicators speak it, and now even mainstream economists are accepting there is some market shaking coming.

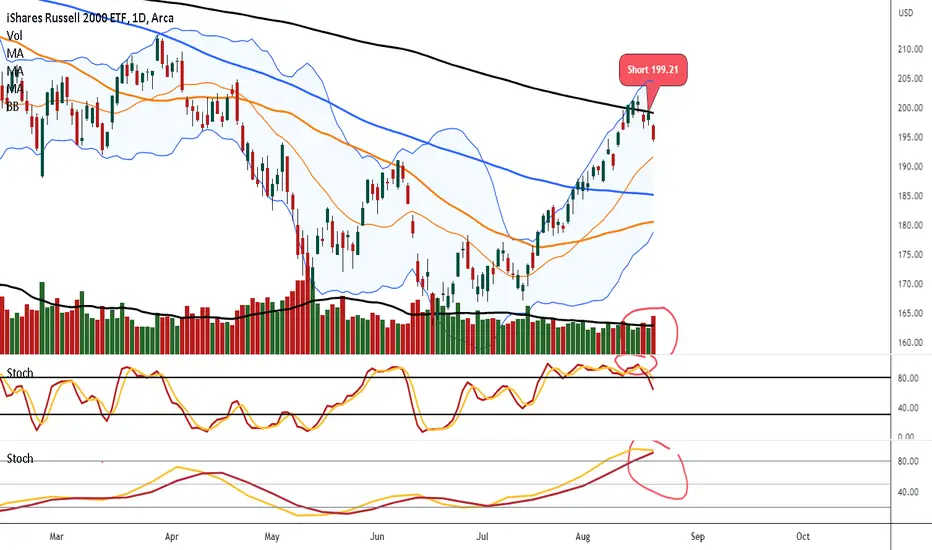
Short IWM 199.21 into that 200 day MAlook daily stoch rolling over. Look how we hit 200 day and stopped and broke down thru 100 day BEARISH.
look vol selling not bad.
look weekly stoch start roll over in time almost their.
I believe this is the next leg down to test lows and break them.
Long term short.
look over all pattern still down.
these bear market rally can be brutal only to fake u out and reverse
many think bottoms in I don't think so charts so lower
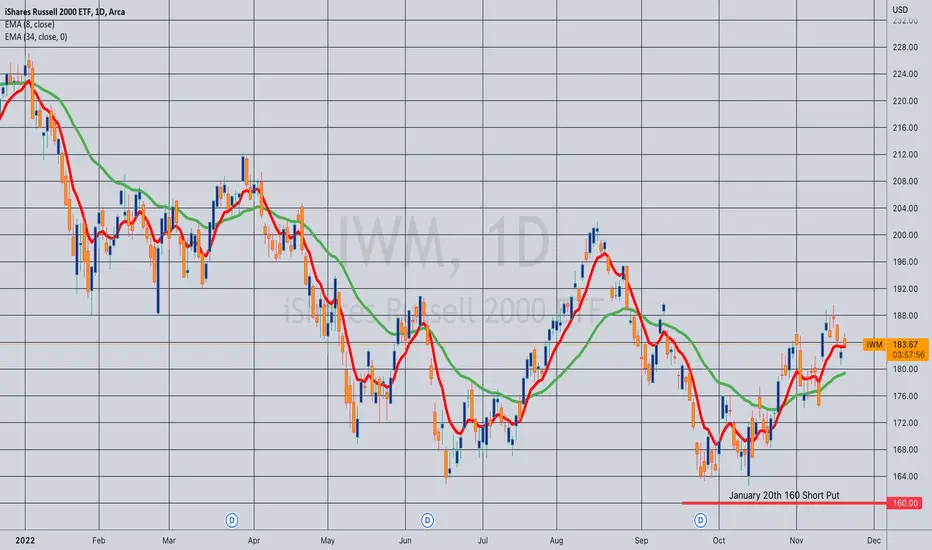
Opening (IRA): IWM January 20th 160 Short Put... for a 1.67 credit.
Comments: Targeting the <16 delta strike paying around 1% of the strike price in credit. Not exactly "ideal" conditions of higher IV/weakness, but haven't got much left on ... .
Short IWM @ 200-day SMA Resistance IWM tracks a market-cap-weighted index of US small-cap stocks.
IWM stock price is 185.58 and iShares Russell 2000 ETF 200-day simple moving average is 185.44, trading below its 200-day SMA will create a Sell signal.

Why it is a good time to buy the indexes. Do you know there is. $14 Trillion USD macro short play on the global markets. Look, this is a two day old, list of global ETFs with their respective short percentages. Who does that? a massive raider, aided by policy makers. e.g. JB's oil policies.
The cat is out of the bag. Did you know the IWM was shorted to 42% that is amazing, a leather face more if you ask me, the italians call that a Faccia Tosta. An immutable mastardo, the atomic bomb, and then comes back to buy it all back. Ohh,,, I forgot, did you read, georgeos Soros-sky is one of the biggest buyers right now, he is buying Tesla, Google, Amazon and others.
anyhow. here is the list of shorts. The field is perfect for a massive short squeeze.
List of Shorted Country ETFs as of November 21, 2022
Financial Instrument Last Change Change % Short Interest Ratio Financial Instrument Last Change Change % Short Interest Ratio
1 EWW 52.9 -0.45 -0.008434864 38% TZA 31.98 1.05 0.033947624 5.40%
2 IWM 181.72 -2 -0.010886131 32% EWP 23.39 -0.02 -0.00085434 4.70%
3 FXI 25.62 -0.47 -0.018014565 28% COPX 32.77 -0.69 -0.020621638 4.60%
4 EWZ 29.34 -0.13 -0.004411266 23% ARGT 30.43 -0.6 -0.019336126 4.50%
5 EWT 47.83 -0.78 -0.016046081 22% FM 24.7 -0.14 -0.005636071 4.40%
6 EWY 56.33 -1.72 -0.02962963 20% AAXJ 62.58 -1.17 -0.018352941 4%
7 KSA 39.58 -1.04 -0.025603151 20% VNQ 85.26 -0.24 -0.002807018 3.90%
8 EWI 26.79 -0.49 -0.017961877 16% EWO 19.34 -0.19 -0.009728623 3.20%
9 EWG 24.6 -0.33 -0.013237064 15% EWQ 32.47 -0.38 -0.011567732 3.10%
10 SPY 393.3 -2.73 -0.006893417 15% EWJ 53.71 -0.53 -0.009771386 3.10%
11 QQQ 281.71 -3.11 -0.010919177 13% EWM 21.37 -0.28 -0.012933025 3%
12 EPOL 14.15 -0.31 -0.021438451 13% GXG 19.89 -0.14 -0.006989516 2.70%
13 EPOL 14.15 -0.31 -0.021438451 13% UAE 15.5 -0.1 -0.006410256 2.40%
14 SQQQ 47.33 1.5 0.032729653 12% EWS 18.72 -0.37 -0.019381875 2.40%
15 EGPT C18.26 9.40% NGE 7.53 -0.04 -0.005284016 2.10%
16 THD 70.21 -0.71 -0.01001128 9.10% GREK 25.37 -0.16 -0.006267137 1.90%
17 XLF 35.29 -0.08 -0.002261804 9.10% FAS 81.4 -0.54 -0.006590188 1.90%
18 TNA 36.47 -1.21 -0.032112527 9% EWD 32.25 -0.39 -0.011948529 1.30%
19 EWH 19.14 -0.31 -0.015938303 8.90% QAT 20.51 -0.35 -0.016778523 1.20%
20 EWK 16.96 -0.11 -0.006444054 8.50% EWN 37.38 -0.48 -0.012678288 1.10%
21 CN 27.23 -0.22 -0.008014572 7.90% EPU 28.53 -0.33 -0.011434511 1%
22 EZA 42.73 -0.72 -0.016570771 7.80% EWL 41.94 -0.16 -0.003800475 0.90%
23 TQQQ 21.13 -0.71 -0.032509158 7.70% AFK 16.73 -0.13 -0.007710558 0.90%
24 FAZ 17.9 0.1 0.005617978 7.50% ENZL 46.47 -0.12 -0.00257566 0.80%
25 EWA 22.35 -0.41 -0.01801406 7.30% VOO 361.47 -2.52 -0.006923267 0.60%
26 DIA 336.27 -1.1 -0.003260515 7.10% NORW 24.56 -0.51 -0.020343039 0.60%
27 EWC 33.93 -0.61 -0.017660683 6.40% IVV 394.99 -2.79 -0.007013927 0.50%
28 EPHE 25.21 -0.2 -0.007870917 5.60% EIS 60.49 -0.1 -0.001650437 0.50%
29 PGAL 9.84 -0.06 -0.006060606 0.20%
30 GXC 72.36 -1.38 -0.018714402 0.20%
31 AIA 54.47 -1.28 -0.022959641 0.10%
PRINTED TODAY 11.21.2022
This Excel has the latest short interest percentages for multiple global ETFs.

Small Caps Head & Shoulders IWM Russel 2000Clear head and shoulders forming on the daily chart. Tight price action below the 200 sma and above the 50 sma. Wait and see if it breaks through the 200 SMA and closes the monthly candle above the 200; I will allocate higher portion of my 401k to small caps. If it falls below the 50sma, wait to see what happens with pricing at the neckline. cash on the sideline with a limit buy after H&S plays out.

IWM: Multiple S/R Lines Converging AMEX:IWM
Price broke a year long down trend line in July and found support on the trend line in Sept. Price now flirting with a squeeze between the 200sma and a S/R range tested multiple times since 2021. RSI and MACD showing positive movement and run to the upside. If S/R is broken next price range test 195/200.

$IWM Bearish Trading IdeaWe utilized the YS Trading Checklist to determine how we expect this trade to go.
1. News
2. Candle
3. Volume
4. CCI
5. Stochastics
6. Gaps
From the technicals, we determined that $IWM is poised to retrace back to support in the short term. Hence the trade I like is the $186 / $182 Put Debit Spread expiring 9 DEC 2022.

Rolling (IRA): IWM Nov 18th 173 Short Put to Dec 16th 164... for a .13 credit.
Comments: The last of my IWM rungs ... . Taking an opportunity to strike improve this while it's still out-of-the-money. Total credits collected of 3.82 (See Post Below) plus the .13 here for a total of 3.95.

IWM Dragon on the dailyAMEX:IWM
getting back into the swing of things when i see this nice set up here on IWM

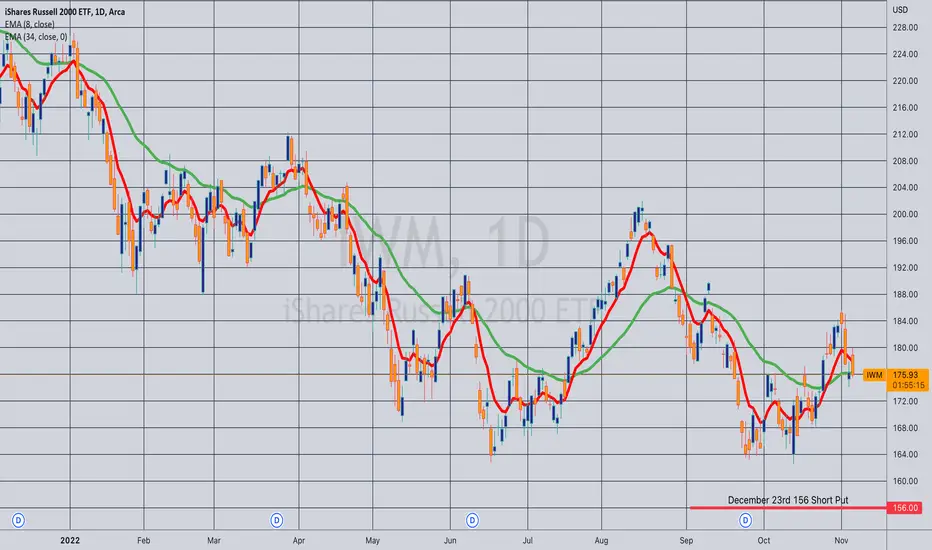
Opening (IRA): IWM December 23rd 156 Short Put... for a 1.67 credit.
Comments: Targeting the <16 strike in the expiry nearest 45 days paying around 1% of the strike price in credit.
This is more about not letting my IWM position get too short delta than about putting on an "ideal" premium selling trade. I still have an IWM short delta hedge on that is marking at around -60 delta (See Post Below) and had only one IWM short put rung on at the December 16th 164 (+23 delta at the moment), so the position was leaning more net delta short than I would like. This long delta additive trade will make my IWM position "net delta flatter."

Study of Swing Trade Entries using Stochastic, RSI and MA'sPlease read notes on chart first.
Yellow arrow and triangle breakout are points (time and place) at which you might buy calls for a swing trade. If your trade is based on 30m timeframe, you can still use 5m to fine tune your entry. Key is that you identify targets and stops based on your 30m chart.
Study white arrow on today's 5m chart for today's swing trade entry. For example, 11/11 181 call ~1.75 near when price was ~178.70, and now is over 3.00. (Price moved well today and this could be a day trade as well.)

UPDATE_IWM Harmonic Elliott Wave AnalysisOverview: let's review the key points of the pervious updates I have on IWM so far:
August 20th: Wave (X) top is in.
September 5th: We are in wave c of 3 of A of (Z) of 2.
September 27th: Wave III of A of (Z) of 2 is near completion.
Update: IWM has been following our expectations perfectly the whole time. Now, I see that we have peaked for wave B of (Z) of 2 and right now, we are in wave (b) of I of C of (Z) of 2.

SmallCaps may make a comeback IWM vs QQQ shown that QQQ has outperformed IWM relentlessly, but in the next few months or years--especially as FAANG is now dead--the Small Cap stocks of IWM might be poised to make a comeback. Time will tell.

Short the Russell stillWe're still short of the IWM on the current economic enviornment. Better Ratio on this trade. Feel free to trade a smaller position on this signal.

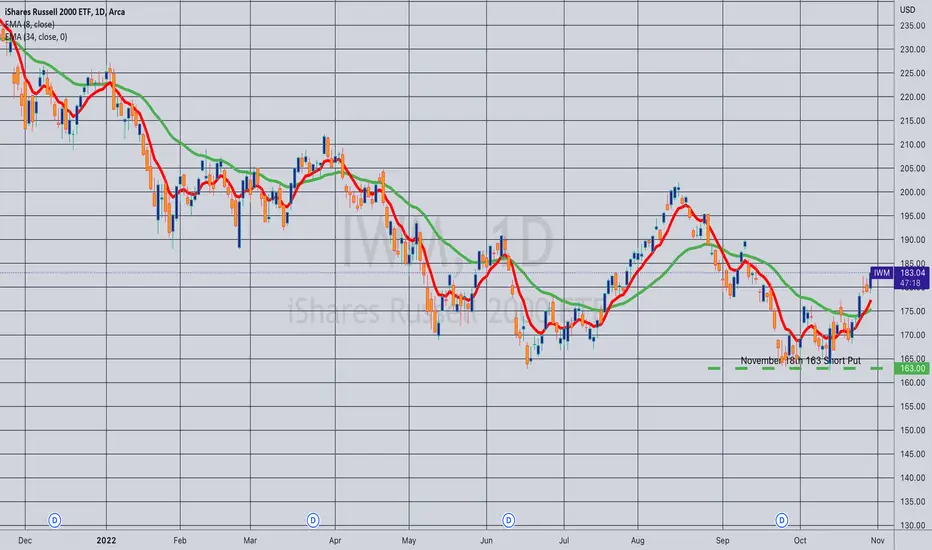
Closed (IRA): IWM November 18th 163 Short Put... for a .57 debit.
Comments: Collected a total of 2.72 with rolls on this one. (See Post Below). Out for .57; 2.15 ($215) total profit.
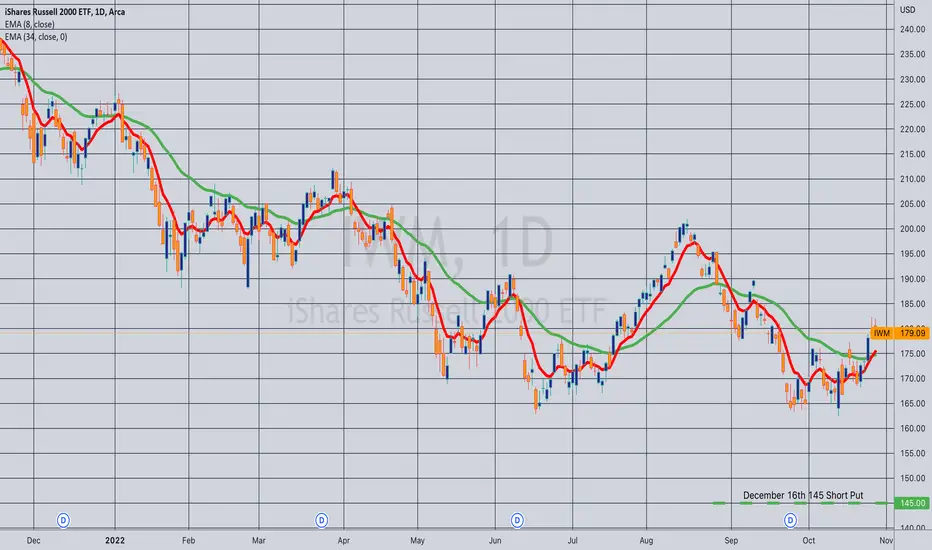
Closed (IRA): IWM December 16th 145 Short Put... for a .76 debit.
Comments: (Late Post). Collected a total of 2.11 in credits. (See Post Below). Out today for a .76 debit. 1.35 ($135) profit.
This leaves me with two rungs -- the November 18th 163 (currently 14 delta) and the November 18th 173 (currently 33 delta), for a total of 44 long delta. Both of these are hedged off with a long put vertical in IWM (See Post Below), which is currently marking at -74 delta. I'll be rolling out the short leg of the diagonal tomorrow, which will decrease the short delta slightly, after which I will look to see whether I should add back in IWM long delta to make sure that I'm not too short/directional in this position. (33 long - 74 short = -41 delta). As part of this consideration, I also need to look at my portfolio delta as a whole to see whether it's okay to keep the IWM position net delta short, since it enjoys a close correlation with SPY (.95 3-month).
Since it kind of drives me slightly bonkers to leave positions skewed out (regardless of whether they can do double duty as a closely correlated broad market hedge), I'll probably end up adding some long delta back in.
Short idea #18- Why bet against trend?Hey all, I think IWM is going to drop in November; I am hoping it chugs slightly higher in the coming week as I am looking to short this name. This chart doesn't look particularly healthy, and it is clearly in a downtrend. I see no reason that trend won't stay intact, and I perceive IWM is going to be a very safe short when $SPY reaches $389/share. My predicted move is drawn out.

IWM daily evening star reversalOrder SELL IWM ARCA Stop 169.22 LMT 169.22 will be automatically canceled at 20230401 01:00:00 EST
IWM daily evening star reversal that's maybe it for wave 2 wave C correction of uptrend

IWM daily pinnacle patter after long day bullish candleOrder BUY IWM ARCA Stop 175.10 LMT 175.10 will be automatically canceled at 20230401 01:00:00 EST
IWM daily pinnacle patter after long day bullish candle if we break above trendline can run higher. Be ready to exit quick for small profit.
