Short the RussellThe market is perpetuating low risk taking which makes the Russell a better broad index short than the S&P500. There's more room to the downside for this one to play out. We suggest a smaller position to which one can add incrementally after it makes it's move. The stop loss can also be moved closer to Breakeven to improve on the Ratio.
IWM trade ideas

IWM swing long idea 10/14/22Hey all, as I've been making clear, I suspect a near-term pullback. I am fully planning on buying the dip; here's how I plan on playing IWM and what I am expecting.

IWM bearish hammer at 50% Fib retracement with RSI divergenceOrder SELL IWM ARCA Stop 172.40 LMT 172.40 will be automatically canceled at 20230401 01:00:00 EST
IWM bearish hammer at 50% Fib retracement with RSI divergence wave 5 of downtrend buckle up!

Bite size long IWMHey all, I'm thinking IWM is a solid buy here, and that it is going to rally to my PT over the coming days/weeks. I'd stop out below the base.

IWM weekly bearish hammer wave 5 downtrendOrder SELL IWM ARCA Stop 164.04 LMT 164.04 will be automatically canceled at 20230401 01:00:00 EST
IWM weekly bearish hammer wave 5 downtrend take profit at 168% fibonacci extension of wave 4 downtrend, stop loss above the hammer.

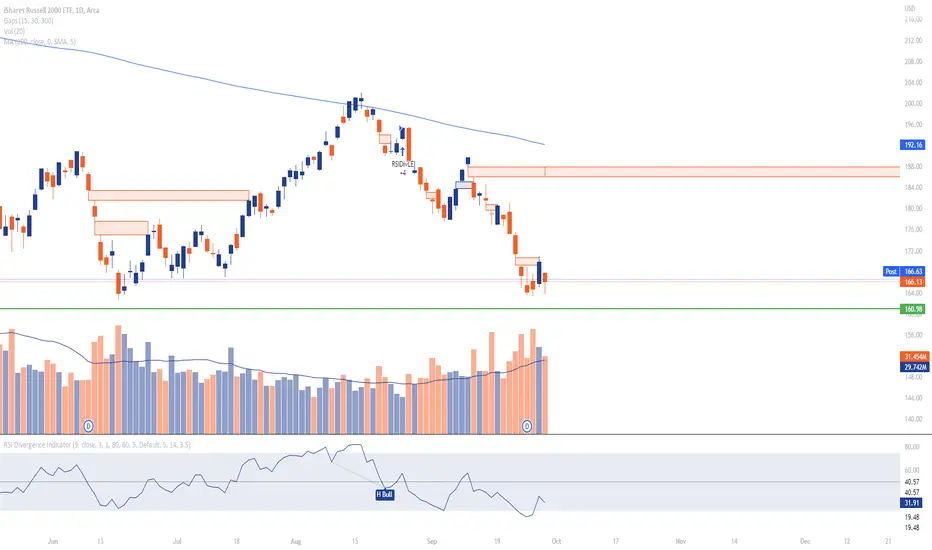
What is next?IWM gives us mixed signals.
It gives both bearish and bullish signals, which can be disturbing, but I have a strategy for that too...
But first let's analyse the chart.
A symmetrical triangle is forming after a huge seloff.
Meanwhile, the weekly S2 pivot point (165.77) and the POC (168.51) are squeezing the price into a tighter range.
The tighter it squeezes, the bigger the breakout will be.
At the same time; MACD shows a regular divergence, which is bullish.
The RSI was oversold(<30), now it is back above 30 and rising, which is also a bullish sign.
On the other hand, we are still in a downward trend, so a continuation is possible.
It supports the fact that today's green candle is low in volume, which means that participation is low.
Whatever the situation, I expect a huge breakout in one direction or another.
In my opinion, the "straddle" option strategy is best suited to this situation.
I am playing the 18 Nov 22 169 straddle.
Support: 165.77, 155.58
Resistance: 168.97, 172.63, 178.24

IWM is basing, don't get bearish yetHey all, IWM has stood out to me for both its relative strength despite the dump into the end of September and the basing pattern it has made at a key level. I was trying to play a bounce early last week, and though I was initially up, I am now either red or neutral on every position I have longed, except for IWM, which I am up on *barely*. I expect there to be a bounce across markets in October; the question, in my eyes, remains when & how substantive; if I had to answer those questions now, I think we put in a bottom early this week, and I am looking for a roughly ~9% bounce on the S&P. As my key reference point, I am looking to 2008. I think we have a ~9% deat cat(S&P) bounce before an accelerated sell-off, similar to 2008. I think trading long here on the Russell is a very solid risk:reward trade.


IWM | SHORT AMEX:IWM
I expect a drop to 160$ and then a rally to 190$ area to fill the gap and touch MA200.
For now it looks bearish, but tomorrow we will find out, I have no position at the moment, waiting for the confirmation.
IWM if you lose 160's If you lose the support and bottom made today during the sell-off. Then i see no real help maybe just a pit stop at 150 ranges before ending up in the 140's.
HOWEVER, it looks like support has held and we should be getting close to seller's exhaustion. I'm looking for a bounce back towards 175 range but not to exceeed 190 before running into overhead R.


IWM daily indecision pressure building for wave 5 of wave 3 downIWM daily indecision pressure building for wave 5 of wave 3 downtrend.
Sell 12 Stop 163.02 LMT 163.02 GTC
Buy 12 Limit 151.83 GTC
Buy 12 Stop 171.15 GTC

UPDATE_IWM Elliott Harmonic Wave AnalysisOverview: this is a quick update to my IWM count published on September 5th. Let's review our expectations on that update:
We are in wave 3 of A of (Z) of 2.
Update: The labeling needs no update. I think wave III of A of (Z) of 2 is near completion.

Order SELL 1 IWM JAN 17 '25 150 Put Stop 19.00 LMT 19.00Order SELL 1 IWM JAN 17 '25 150 Put Stop 19.00 LMT 19.00 will be automatically canceled at 20230101 00:00:00 EST

IWM daily bullish hammer wave 3 of wave 3 downtrendIWM daily bullish hammer at support wave 3 of wave 3 downtrend volume confirmed. Wave 4 gotta be quick it's a countertrend. Stop loss below local low, take profit at new resistance.

Update (IRA): IWM Sept 30th 177/Nov 18th 200 Long Put DiagonalComments: Just updating my short delta hedge (See Post Below) in IWM so that it appears more toward the top of my ideas queue ... . As of the last short leg roll: Cost basis of 22.58 with a 177.42 break even on a 23 wide.
As you can see, price has pushed up quite a bit into the long leg of the setup, but I'll keep rolling the short leg out to reduce cost basis and look to roll the long leg up and out if I run out of time and/or don't get the move I need (i.e., back through the short leg of the setup; this may be somewhat of a tall order at this point, that's 18 strikes below where IWM is currently trading). At the moment, doing this would cost me (and will probably cost me when I actually go ahead and do it). For example, rolling the November 18th 200 long to the December 16th 230 (90 delta), would cost 28.69 at the mid price, increasing my cost basis to 51.27 on a resulting 53 wide with a 178.73 break even (a slight improvement over my current 177.42 break even).
I've still got 7 potential rolling opportunities of the short leg from week to week, so will cross that bridge when I come to it ... .

IWM daily short long day candleSetting up short after bearish gap and go in hope for retest of the candle, not the gap. Wave 5 down. I mean, look at this volume. I hope this is not an exhausting yet )))


Update IWM shortLook at selling vol and look weekly stoch heading south
IWM going to test its low and break it will really drop.
up 12% IWM short.

Rolled (IRA): IWM September 30th 178 to November 18th 173... for a 2.02 credit.
Comments: (Late Post). Rolled this out late on Friday so that I can be out of September contracts, as well as reduce buying power effect and cost basis.
Credits collected of 1.80 (See Post Below) plus 2.02 for a total of 3.82.

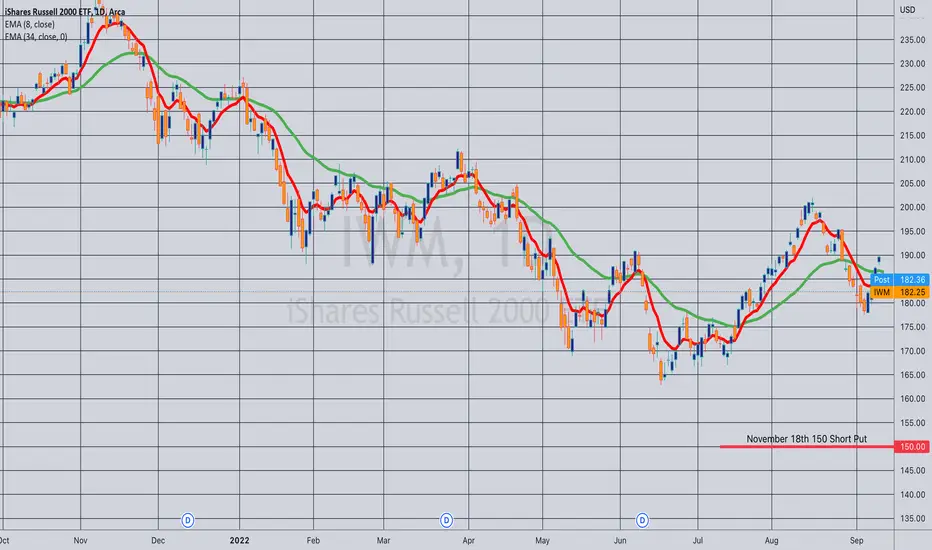
Opened (IRA): IWM November 18th 152 Short Put... for a 1.53 credit.
Comments: Targeting the <16 strike in the November monthly paying around 1% of the strike price in credit on weakness/higher IV.
SHORT | IWM | FED Meeting UpdateAMEX:IWM
Possible Scenario: SHORT
Evidence: Bearish Divergence, Price Action, Money Flow
Timeframe: Before FED meeting in March.
TP: 178$
*This is my idea and could be wrong 100%

Pig Market: Why IDC about the CPI8.5 prior
8.1 expected
8.24 cleveland fed estimate
??? actual
Everyone is going crazy about this CPI data like its gonna change anything. We already know inflation has peaked and will start to decline. It's doing that because the economy is slowing. The fed is still hiking and the inflation isn't going to go away fast enough for a soft landing. The markets may adjust to the data tomorrow, but it's not going to change our destiny: a recession by end of year.
Find the next peak, sell it, or short it. This moon mission is cancelled and you'll be stranded in space.
