Opened (IRA): IWM October 21st 170 Short Put... for a 1.78 credit.
Comments: Targeting the <16 strike in the shortest duration paying around 1% of the strike price in credit. This is more of "I need small cap long delta" than "this is a really great place to put on small cap long delta" trade, so probably not the best entry point to do this, although we're getting a little bit of weakness here today.
IWM trade ideas

IWMFirst index to break RSI daily trend line. MACD hasn't rolled over yet on daily or weekly. Weekly RSI getting rejected on breakout from last week. Weekly AVWAP getting rejected. Most likely will come down for a lower high before pushing higher if it does. More likely to take out the lows first though. Depends on what the charts give in the coming weeks.

IWM: Bear is taking over#Ticker Symbol: IWM
#Timeframe: 4 Hour
#4X Bear Pattern
#Investment Strategy: short
TECHNICAL ANALYSIS:
----- Closed below 21ema -----
-----Money Divergence--------
-----RED Dot(9ema Crossover) with Red Line: Bearish
-----Rejection of 200ma on Daily Time Frame
#Follow for daily stock, crypto and forex technical analysis.
⚠️ Trading is risky, and I understand nothing is guaranteed. Proper risk management should be in place at all times to minimize losses. Please consult a financial advisor before trading. All Inclusive Trading LLC is not a financial advisor and may not be held liable for any losses which may occur.

$spy $iwm could it be like this? Bear Market RallyYou better hope not. watch out below. Could take a long to to BEAR out LOL

A bigger upside helps smallcapsCloser support and higher upside target give Russel stocks a chance to bounce faster than the heavy weighted SPY and QQQ

Opening (Margin): IWM September 30th 178 Short Put... for a 1.80 credit.
Comments: Not a great place or a great IV environment to be doing this, but looking to offset some of my IWM short delta. Previously, I did a covered call, but I don't need that much long delta here at the moment, so am doing a lower delta out-of-the-money short put and will add at intervals if necessary. Delta/theta 15.18/5.

Closed (IRA): IWM September 2nd 196 Covered Call... for a 191.42 credit.
Comments: (Late Post). Paid 187.73 to put this on. (See Post Below). Money, take, run today. 3.69 ($369) winner. Will look to re-up in the next couple of days, as I still have IWM short delta on.


Bearish on Russell 2000 ETF. IWMGoals 0.56, 0.49. Invalidation at 0.89.
We are not in the business of getting every prediction right, no one ever does and that is not the aim of the game. The Fibonacci targets are highlighted in purple with invalidation in red. Fibonacci goals, it is prudent to suggest, are nothing more than mere fractally evident and therefore statistically likely levels that the market will go to. Having said that, the market will always do what it wants and always has a mind of its own. Therefore, none of this is financial advice, so do your own research and rely only on your own analysis. Trading is a true one man sport. Good luck out there and stay safe

$IWM / $SPYSmall-Caps outperformance of Large Caps is one of the requirements of a true market bottom (on a relative basis). This favors growth over value.
Small Caps > Large Caps

Another false breakout for the Russell 2000?The Russell 2000 has been prone to false breakouts since last fall as the index rallied to all time highs then failed at the end of 2021. The move from Monday/Tuesday of this week could set up the same fate for the index especially if the highly anticipated #CPI data comes in hotter than expected. You can also see that the November 2021, March 2022 and highs this week marked a turn in RSI as well. Tomorrow's data should have a strong impact on the index.

IWN RUSSELL Uptrending LONG IWN
This Russell ETF is consistently uptrending above the cloud indicator.
Uptrend is validated by relative volume increasing.
Target is the long term volume profile POC about 5% upside.
Good for stock or option play.
See also QRU22 futures chart.

$IWM 280 by end of 2024?Market starting to show signs of a final melt up ? Just offering this bull case, of course we could certainly see 120 before 280, but 200 weekly MA has offered support in the past followed by strong moves up, less 2008 financial crisis and 2020 covid crash.
So I guess real question for the bear case would be - what is the black swan event ? Because for certain Inflation, war , etc. are just headwinds. A true BLACK SWAN EVENT is needed it seems.. what will it be then ?
My bias is long ... for now :)

IWM Short for SepAscent at ~70'
Exhaustion gap was just put in. Coming into 52 week poc and 200 day sma. Wed CPI #s will tell the story.

IWM AnalysisAMEX:IWM . Based on my Analysis I think if we can break that resistance, it can travel some distance to the upside otherwise same old story to the downside.
Calls > 192 wait for confirmation
puts < 191 to 183.8 another support level

Opening (IRA): IWM September 2nd 196 Covered Callfor an 187.73 debit.
Comments: Since I've got IWM short delta hedge still hanging out there and no remaining IWM short puts to offset, doing a heavy long delta covered call (it's 67.48 long delta). Will look to roll out the short call (currently marking at 2.42) at 50% max to a similarly delta'd strike at or above my cost basis.
From a price action standpoint, this isn't the greatest spot to "go long," so may not be suitable as a standalone trade unless you're the patient sort who is fine with reducing cost basis over time via roll of the short call and over (potentially) larger time frames.


Bearish Reversal open today - maybe more selling before buyingI have been watching IWM and XBI for weakness or strength as general market indicators. Today's open was below Friday's open, which is very bearish. Same is true for AAPL. XBI tried to rise and failed.
Overall, many tickers have completed a "cup" formation and are extended from their daily MA's while indicators are extremely overbought. Hence a pullback to form a "handle" makes sense.
Beyond the next few days, I am aware of various expert views of the next market direction. I am staying open to possibilities until I feel more confident in my own studies.

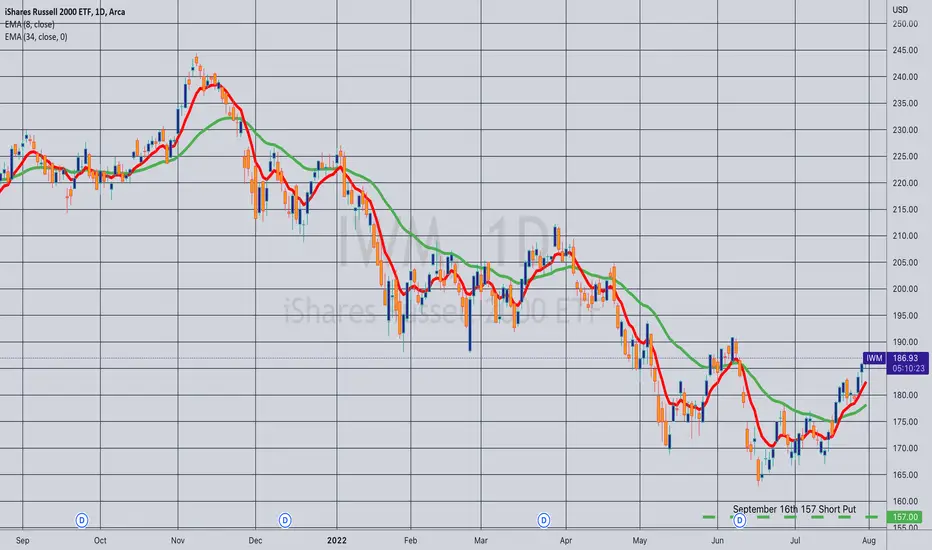
Closed (IRA): IWM September 16th 157 Short Put... for a .76 debit.
Comments: In for a 1.66 credit (See Post Below); out here at >50% max; .90 ($90) profit.
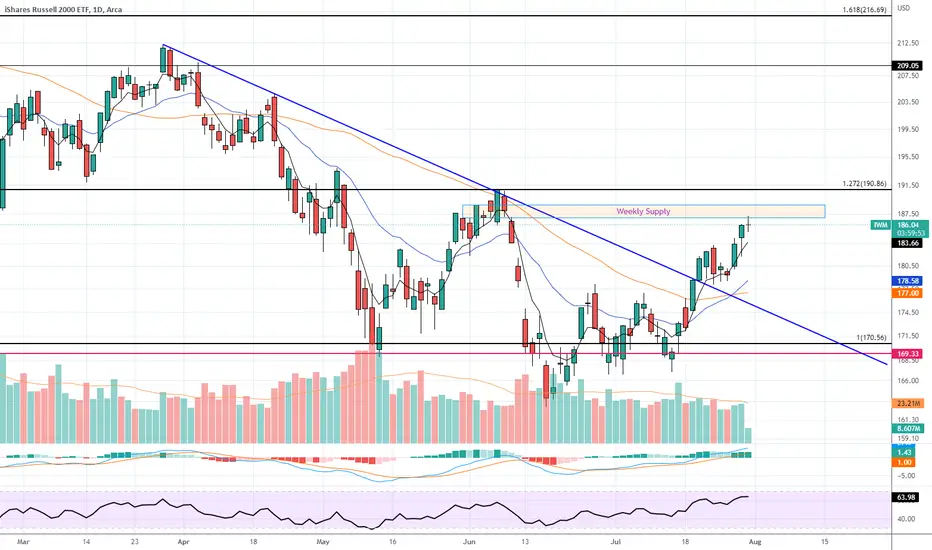
IWM - Key support is holding
Looking at Russell´s weekly chart, we can see that a MAJOR confluence in the 170 region held nicely. This confluence includes:
- 2018 and 2020 highs
- 161.,8% A-B extension
- 50% pullback from 2020 low to 2021 high.
A break of the green downtrend line would give us a better indication that a recovery is in place. In this scenario my first target is 209 resistance.
This scenario invalidates at 162.78.

IWM - Next Leg DownI started a hedge position by buying Sept 16 178 PUTS on July 21 st. I legged into the contracts throughout the day. Average cost 7.01
This was my first buy zone indicated by the first box. I might add a couple of contracts if it wedges up to the second green box, near the 184ish range.
IWM looks to be repeating the same flag pattern it did before, indicated by the pink lines.
Markets are still in a downward trend, making lower lows and lower highs, as indicated by the orange channel.
Recent rally has been on declining volume.
Profit takers are indicated by the blue lines.
RSI near 60, which marked short-term tops.

Closed (IRA): IWM September 16th 140 Short Put... for a .39 debit.
Comments: Opened this for 1.68. (See Post Below). Out today at greater than 50% max. 1.29 ($129) profit.
