Closed (IRA): IWM August 19th 156 Short Put... for a .58 debit.
Comments: Opened this for a 1.56 credit. (See Post Below). Closed it out today at >50% max to dry out powder for "the next one." .98 ($98) profit.
IWM trade ideas

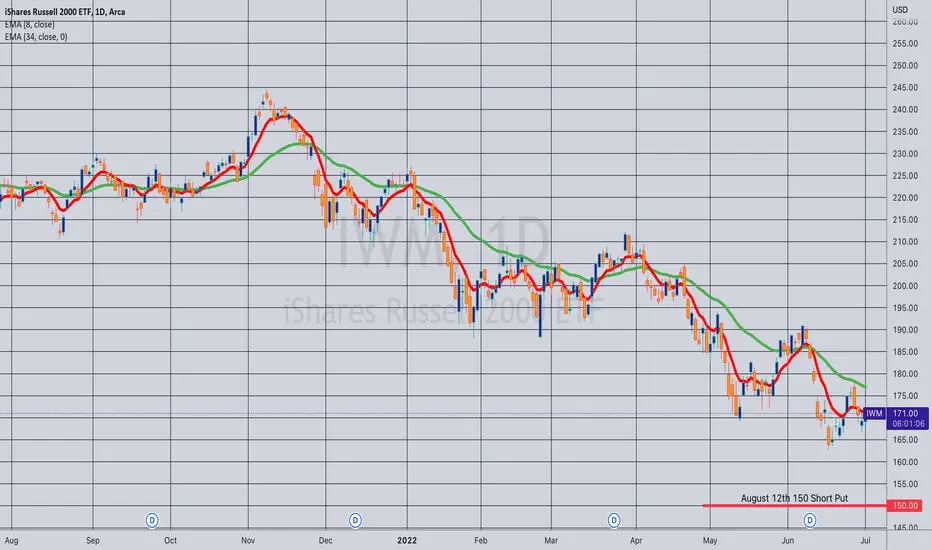
Closed (IRA): IWM August 19th 150 Short Put... for a .46 debit.
Comments: Filled for a 1.57 credit (See Post Below); out today for .46; 1.11 ($111) profit.

Short IWM (RUT) at 173.10, PT at 156.10AMEX:IWM CME_MINI:RTY1! TVC:RUT RUSSELL:RUT
Hypothetical Trade Summary : Shorting AMEX:IWM (Russell 2000) here at 173.10. Price target at 156.10. Stop = 178.10. Capital risk = $3,000 (3% of a $100K trading account). Maximum profit = $10,200. Reward to Risk: 3.4 / 1
Rather than a legitimate rally based on an intermediate-term trend reversal, today's short squeeze appears to be about dealers and market makers (MM) unwinding hedges from a substantial OpEx puts expiring this Friday, June 15, 2022. (Unwinding hedges means dealers / MM's buying to cover short securities / futures / equities used to hedge short put positions from puts sold to traders and institutions that expired today, monthly options expiration.) IWM, an index ETF that tracks the Russell 2000, is stalling at its 21-day EMA. Moreover, the overall structure of the rally the past several days appears to be an Elliott Wave (EW) triangle pattern in most major US indices.
In EW theory, a triangle pattern is considered a corrective pattern. It tends to resolve in the direction of the larger trend, which remains downward in this case.
The Elliott Wave rules / guidance explains that "at least two of the alternate waves are typically related to each other by .618 . Assuming a triangle pattern here for the corrective bounce off mid-June 2022 lows, at least two or more of a triangle's alternating waves have Fibonacci relationships of .618.
In the chart below, the most recent bounce into today (the rally starting from the June 14 low at 167.02) is viewed as a wave E of the triangle pattern.
Applying this Fibonacci and EW guidance, one should multiply wave C's length by .618 (wave C x .618) and then project this length from the start of wave E off yesterday's lows.
This Fibonacci relationship has been applied to wave C and E, which are considered alternating waves, in the chart below.
Interestingly, the .618 relationship results in a possible end point for wave E at the .618 level where wave E = .618 x wave C. This level lies at 173.35.
This .618 relationship between the triangle's alternating waves E and C shows where IWM stalled today in its sharp rally off June 14 lows. IWM stalled at 173.34, one cent below 173.35. See chart below.
Credit is given to another TV member, @MiserableToppings, who pointed out this triangle pattern last week on one of his charts using EW analysis on a different US index ( NASDAQ:NDX NASDAQ:QQQ ).
DISCLAIMER: This is a hypothetical short trade using TV's short-position calculator. This idea is solely for educational / entertainment purposes and does not constitute financial advice or an investment recommendation and cannot account for any person's particular financial circumstances. I would never want other investors / traders to lose money by relying *solely* on this idea rather than doing their own due diligence. Before entering any trade, please evaluate the risks of (i) the instrument / security being traded, (ii) the type of trade and its timeframe, (iii) risks inherent in that type of trade and its time frame, (iv) the inherent risks of shorting securities (presenting unlimited risk without hard stops in place), (v) the inherent risks of trading options, leveraged ETFs, and cryptocurrencies, and (vi) all financial risks arising each person's personal financial circumstances.

Watching IWM closely next few weeks !!!Refer to my earlier chart here
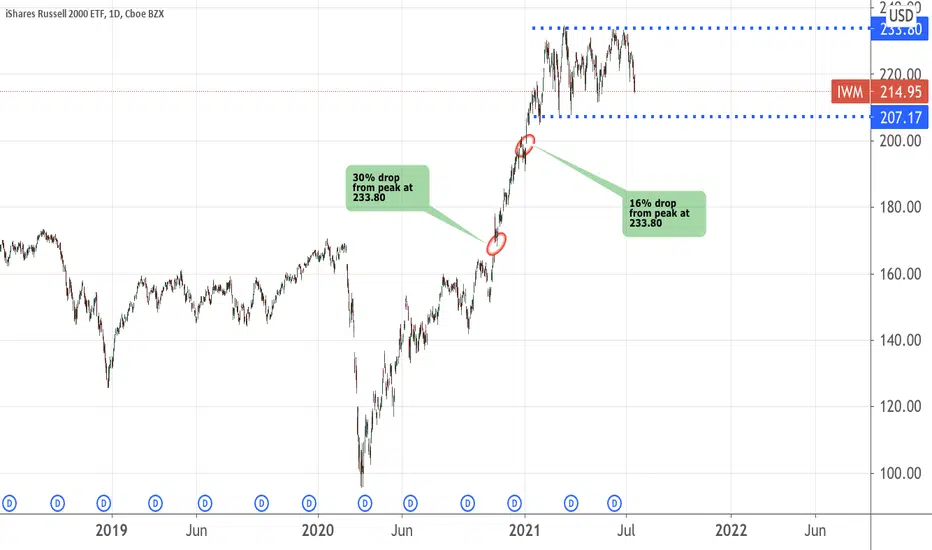
The Russell 2000 is giving us clear clues to how the market is likely going to behave in the coming months. It has not been successful breaking out of the resistance at 233.80 since March 2021.
It made attempts in Jun and July 2021 but both failed miserably! The straw that is going to break the camel's back will be the support at 207.17. In the coming weeks, watch this chart closely. If it falls below this level, then it is likely to head towards 199 level to close the first gap.
Worst case scenario, it will head further south to 165 level.
Please do your own due diligence.
Closed (IRA): IWM August 5th 154 Short Put... for a .49 debit.
Comments: (Late Post). Opened for a 1.56 credit. (See Post Below). Closed it on Friday for .49; 1.07 ($107) profit.

IWM and the Russell 2000, where's the bottom?Here's my take on IWM, the ETF that tracks the Russell2000. As you can see, I ultimately see IWM falling all the way to around $165. That's about 16% below where we are now and 12% below our lowest point of last week. I believe the market tailwinds produced by the earnings of market powerhouses Google, Apple, Microsoft, and Amazon will quickly subside and the headwinds of inflation will replace them.
My target is very near the 50% retracement point of the height of the last wave from the Covid crash bottom of about $95 to the all time high of $245. The 50% retracement point is the most common, but it can range anywhere from 33% to 66%, generally. You can also see that my target seeks to close the 8.15% gap that was created the weekend Biden was declared the winner of the 2020 Presidential election by all the major news outlets. I am not someone that normally puts as much stock into "gap filling" as others seem to do, but this is an exceptionally large gap where lots of money piled into the market. 8.15%! In hindsight, this was a powerful gap signifying that the bull trend was about to kick into high gear. IWM proceeded to go up 35% in the next 3 months. Seems so long ago!
I find it interesting that the gap coincided perfectly with the All Time High that was hit just prior to the covid crash in Feb/Mar 2020. Coincidence? Hmmm.....

Short at 174 - 176Incrementally adding to a short position here up to 176. Don't see this trend line from early June breaking. If it does I think the buck stops at 176. If you think funds are going long small caps in this environment, you shouldn't be in the market. Not financial advice.

IWM Weekly BULLISHIWM is right back to where it faced tops in 2018 and the 2020 crash, but this time it could be major support.
This current selloff has been a very orderly and perfect flag pattern on declining volume.
I think we're at major support and the green bullish arrow is what I am looking for
The market already faced a huge crash in 2020 because of Dr. Fauci and his moronic lockdowns. Are we going to plummet again? Not looking like it. The previous November 2021 top doesn't look much like a top on the weekly charts. I think we'll break out of this flag to the upside and be right back up to previous highs, maybe more

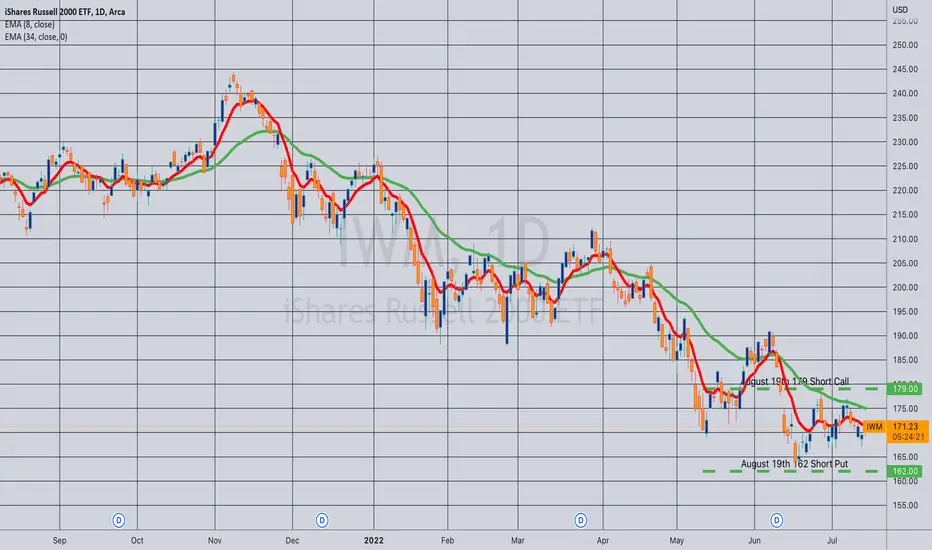
Closing: IWM August 19th 162/179 Short Strangle... for a 5.15 debit.
Comments: Rolled this and/or adjusted it a bunch of times (See Post Below), collecting a total of 5.60 in credits. Closing it out here for a small (.45/$45) profit while I can.
Opened (IRA): IWM September 16th 140 Short Put... for a 1.68 credit.
Comments: Targeting the <16 delta strike paying around 1% of the strike price in credit to emulate dollar cost averaging into the broad market. Going out to September here while I wait for another shorter duration weekly (September 2nd) to open up.

Rolling: IWM August 19th 183 Short Call to 179... for an .87 credit.
Comments: Delta balancing my short strangle back to delta/theta <1.0. Total credits collected of 5.60. Resulting delta/theta 7.90/14.39.

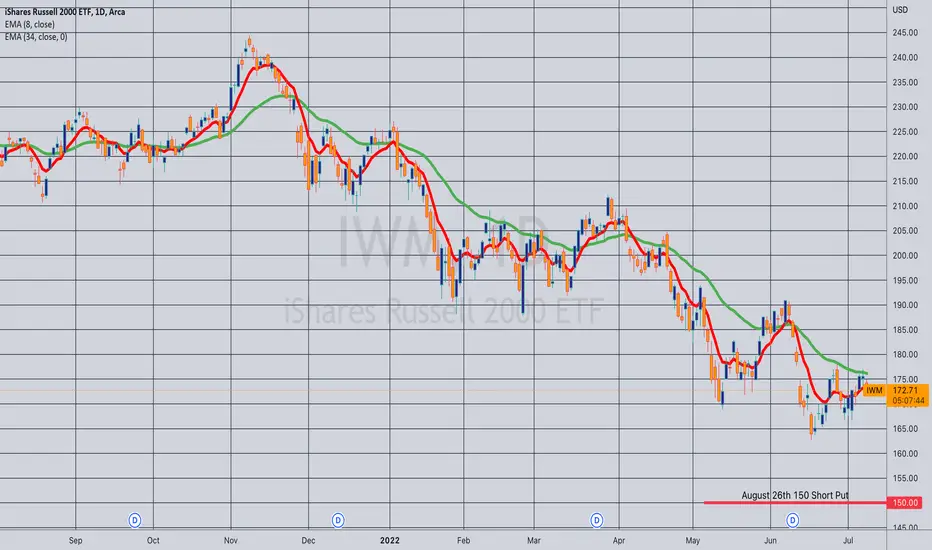
Opening (IRA): IWM August 26th 150 Short Put... for a 1.54 credit.
Comments: Replacing the shorter duration long delta I just stripped off, but at a lower strike and in longer duration.

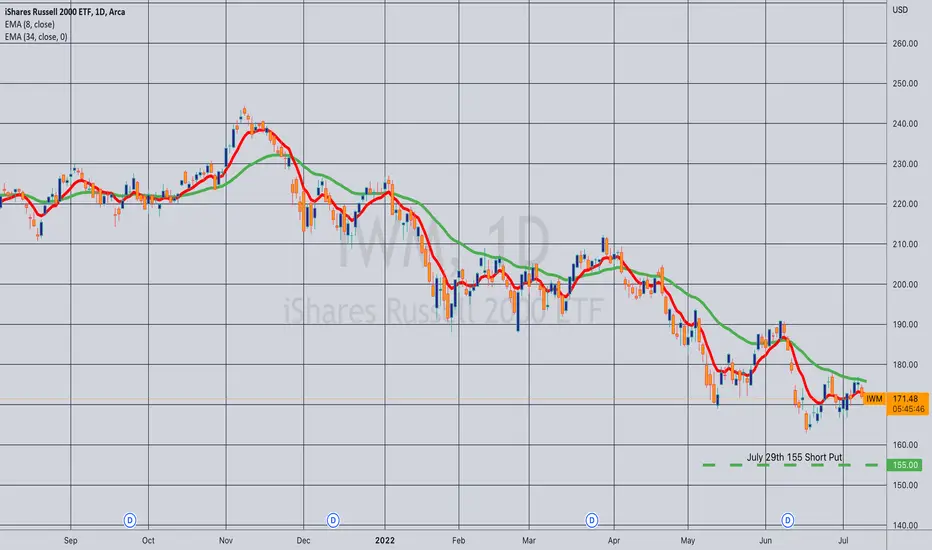
Closed (IRA): IWM July 29th 155 Short Put... for a .58 debit.
Comments: Opened this for a 1.61 credit. (See Post Below). Closing out here at >50% max, 1.03 ($103) profit.
Not Cheap YetSome people say that things are getting cheap. I agree, they are in the process of getting cheap, but we're not quite there yet as far as historical bottoms go. The Russell isn't that cheap yet, still twice as expensive as in 2009. Unless a true miracle happens, it's hard to see any upside in this market as far as real wealth terms(as opposed to numerical price increase) in the near future. On the contrary, we have seen much further downsides in the past. We might see a reflexive bounce in the future and a bear market rally, though we are in a steep downward momentum.
Good luck and don't forget to hedge your bets!

Opening (IRA): IWM August 26th 150 Short Put... for a 1.49 credit.
Comments: Targeting the <16 strike paying around 1% of the strike price in credit in the expiry nearest 45 days. I added a rung in this expiry on Friday at the 155, so am just adding a smidge at a lower strike on weakness and uptick in implied volatility.
IWM: Week of July 11Same setup here as SPY, but IWM is slightly more true to its descending channel.
SPY has overhead resistance at 393, IWM's overhead resistance channel is at roughly 180.
If SPY breaks over 393, its likely IWM will probably follow.
Predicted trading range for this week is in the green box: 165 - 183.
This has seen slight bullish divergence from last week's range of 160 - 177.
IWM seems to be forming a short term wedge been June 17 and July 8th.
IWM is extremely playable within this channel and tends to maintain its mathematical range better than SPY. So the odds are that it will remain within this trading range next week, absent some type of catalyst that drives it parabolic to the upside or downside (which in this case could technically be CPI).
I am neither short nor long biased here, just playing the range.
Trade safe!
Let me know your questions/comments below!

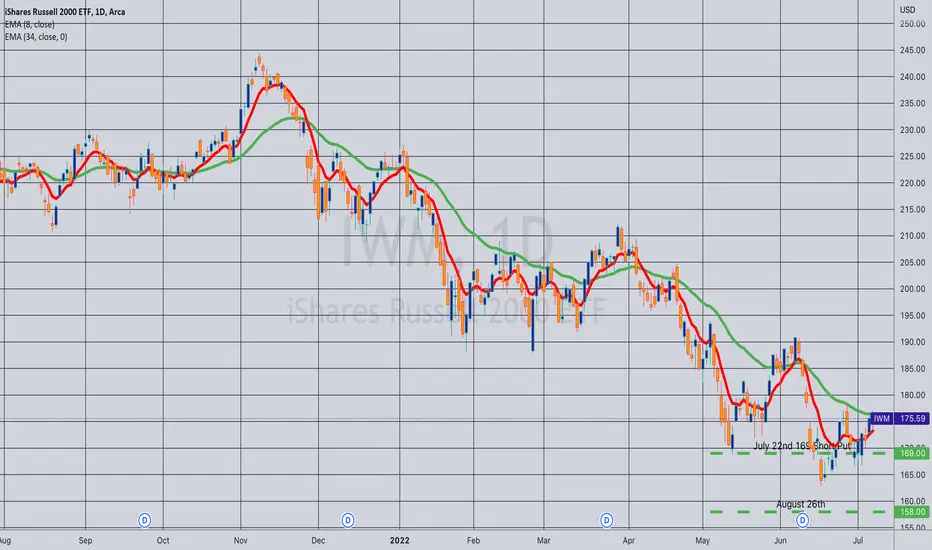
Rolled (IRA): IWM July 22nd 169 Short Put to August 26th 155... for a .25 credit.
Comments: (Late Post). Didn't collect much credit here, but this is the highest strike rung of my short put ladder and would prefer rolling it out of harm's way/to a lower cost basis strike since the market's given me the opportunity here. Total credits collected of 4.79 (See Post Below) plus the .25 here for a total of 5.04.
Rolled: IWM August 19th 158 Short Put to 162... for a .65 credit.
Comments: (Late Post). Rolled up the short put side of my short strangle to delta balance. Total credits collected of 4.73.

Opening (IRA): IWM August 19th 156 Short Put... for a 1.64 credit.
Comments: Adding some long delta back in here after taking profit on some rungs earlier. Targeting the <16 delta strike paying around 1% of the strike price in credit.

Closed (IRA): IWM July 22nd 162 Short Put... for a .67 debit.
Comments: Opened for 1.65 (See Post Below); closing out here at >50% max for a .98 ($98) profit.

Short IWMLooking to sell the Russell, set up looks ready for a drop, watch price action on lower time frame before pulling the trigger. GDLK.

IWMQuestion is do we have an overthrow at play? If yes the IWM needs to get back into my channel and not reject here off the bottom channel TL.
A rejection would almost certainly equal $138 and invalidate the 5 wave intermediate structure.

Opening (IRA): IWM August 19th 150 Short Put... for a 1.57 credit.
Comments: Targeting the <16 delta short put paying around 1% in credit in the expiry nearest 45 days to emulate dollar cost averaging into the broad market.