Closed (IRA): IWM July 22nd 162 Short Put... for a .67 debit.
Comments: Opened for 1.65 (See Post Below); closing out here at >50% max for a .98 ($98) profit.
IWM trade ideas

Short IWMLooking to sell the Russell, set up looks ready for a drop, watch price action on lower time frame before pulling the trigger. GDLK.

IWMQuestion is do we have an overthrow at play? If yes the IWM needs to get back into my channel and not reject here off the bottom channel TL.
A rejection would almost certainly equal $138 and invalidate the 5 wave intermediate structure.

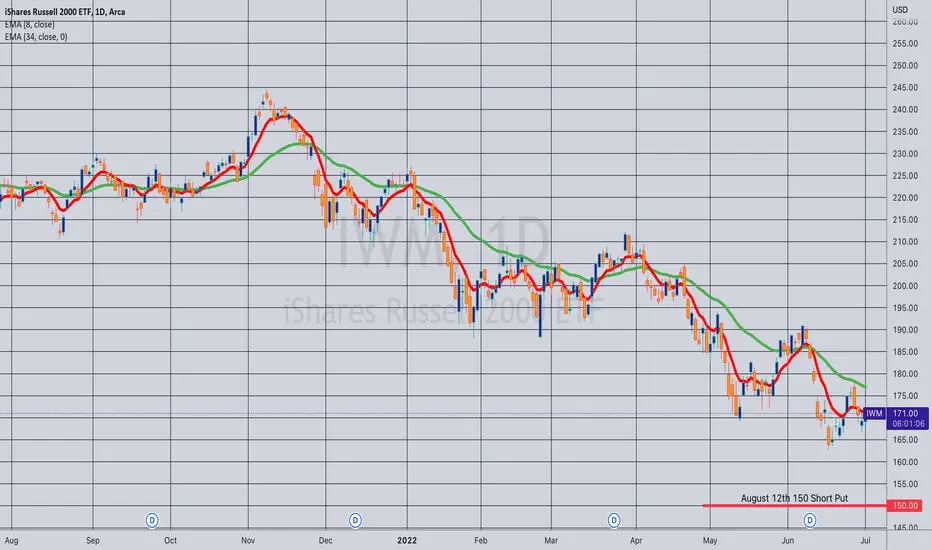
Opening (IRA): IWM August 19th 150 Short Put... for a 1.57 credit.
Comments: Targeting the <16 delta short put paying around 1% in credit in the expiry nearest 45 days to emulate dollar cost averaging into the broad market.
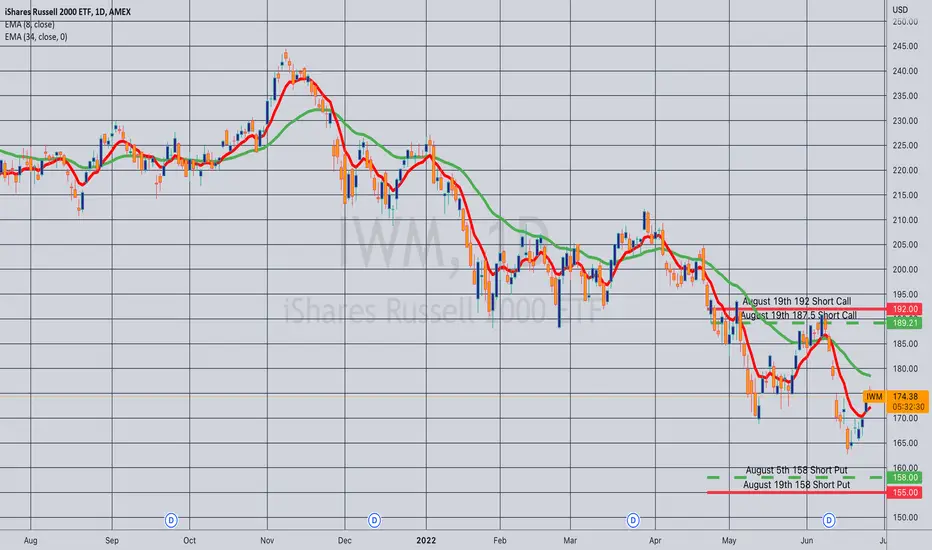
Rolling: IWM August 19th 192 Short Call to 183... for a 1.27 credit.
Comments: Delta balancing my IWM short strangle a smidge ... . Total credits collected of 4.08. End-of-day delta/theta 4.86/11.98. Will look at managing any remaining setups that are "out of kilter" on Friday.

Rolling: IWM August 5th 158/187.5 to August 19th 158/192... for a .46 credit.
Comments: Locking in some realized gain and recentering risk/balancing delta. Total credits collected of 2.81. Delta/theta 2.69/10.46.
Opened (IRA): IWM August 5th 154 Short Put... for a 1.56 credit.
Comments: Adding back in some long delta here in IWM, targeting the <16 strike in the expiry nearest 45 days paying around 1% of the strike price in credit.

Closed: IWM July 29th 145 Short Put... for a .46 debit.
Comments: Opened for a 1.91 credit (See Post Below); out during Friday's session for .46. 1.45 ($145) profit.
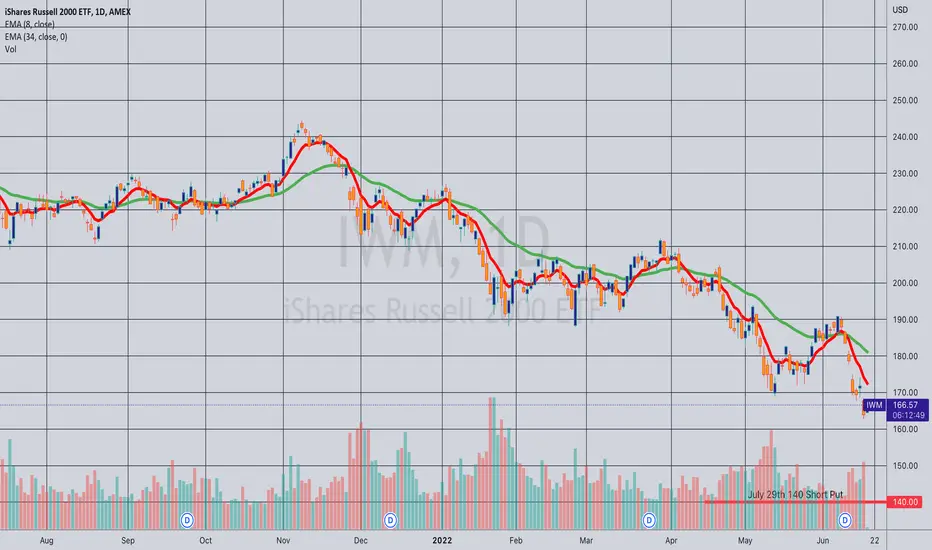
Closed (IRA): IWM July 29th 140 Short Put... for a .53 debit.
Comments: In for a 1.49 credit(See Post Below); out at >50% max here on movement plus volatility contraction. .96 ($96) profit.

Closed (IRA): IWM July 1st 154 Short Put... for a .10 debit.
Comments: Opened for a 1.64 credit (See Post Below). Closing here for .10; 1.54 ($154) profit.

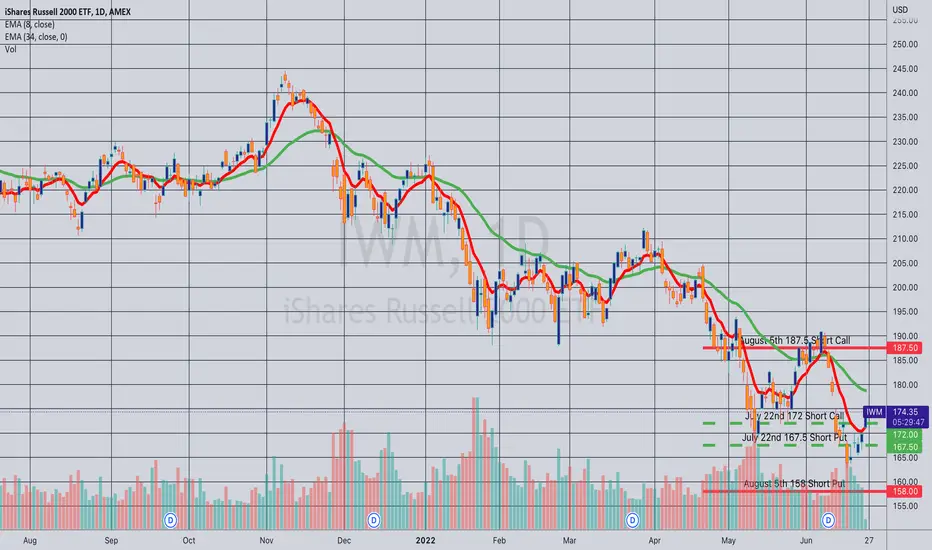
Rolling: IWM July 22nd 167.5/172 to August 5th 158/187.5... for a 6.04 debit.
Comments: Rolling out and paying a debit here that is smaller than total credits collected to reduce buying power effect. Up to this point, I'd collected a total of 8.39 in credits, so I'm still net credit on the setup by 2.35, but it's currently marking at 4.57 or so, so I'm down 2.22 on the position at this point. The setup, however, is now "delta/theta happy" at -4.03/12.39 and isn't being such a buying power pig.
Russell 2000 reconstitution 6/27On June 27, the popular Russell indexes will get their annual refresh, an event that has historically triggered major market volatility in dozens of impacted stocks. Every year on the fourth Friday of June, the Russell 1000, Russell 2000, Russell 3000 and other Russell indexes are reconstituted. The day of the annual Russell reconstitution has often been one of the highest-volume trading days of the year, largely thanks to institutional investors and funds that track the Russell indexes adjusting their holdings to reflect the updates. This year, the Russell U.S. Index reconstitution will occur before the market opens on June 27. (Source: Forbes) Here's levels on the IWM 4-hour chart:
R3 = $180.03
R2 = $176.63
R1 = $173.23
pivot = $169.84
S1 = $166.44
S2 = $163.04
S3 = $159.65
Do your own due diligence, your risk is 100% your responsibility. This is for educational and entertainment purposes only. You win some or you learn some. Consider being charitable with some of your profit to help humankind. Good luck and happy trading friends...
*3x lucky 7s of trading*
7pt Trading compass:
Price action, entry/exit
Volume average/direction
Trend, patterns, momentum
Newsworthy current events
Revenue
Earnings
Balance sheet
7 Common mistakes:
+5% portfolio trades, capital risk management
Beware of analyst's motives
Emotions & Opinions
FOMO : bad timing, the market is ruthless, be shrewd
Lack of planning & discipline
Forgetting restraint
Obdurate repetitive errors, no adaptation
7 Important tools:
Trading View app!, Brokerage UI
Accurate indicators & settings
Wide screen monitor/s
Trading log (pencil & graph paper)
Big, organized desk
Reading books, playing chess
Sorted watch-list
Checkout my indicators:
Fibonacci VIP - volume
Fibonacci MA7 - price
pi RSI - trend momentum
TTC - trend channel
AlertiT - notification
tickerTracker - MFI Oscillator
www.tradingview.com

IWM Fakeouts Are a Tradeable TrendThe Russell likes its fakeouts. We had two to the upside recently. We could be seeing a fake breakdown developing now. $170 is the level I'll be watching. A close above there on Friday would be a trigger a long with a target of $185-$190.

IWMThe set up from LT support off the bottom channel has Nuked (of course) and I say that b c this year is the year where everything looks like a perfect set up that just nukes. (except oil trades) At this point IWM can still be an over throw, if small caps are pricing in all this inflation & War in Ukraine & recession talk. If the chart is to follow NQ then we have much more pain ahead. Looking at OTC stocks I am really unsure as to how much more pain can be endured. They all seem pretty bottomed. So watching for an MM overthrow here and confirmation would be working the candle sticks back into the LT channel IMO.

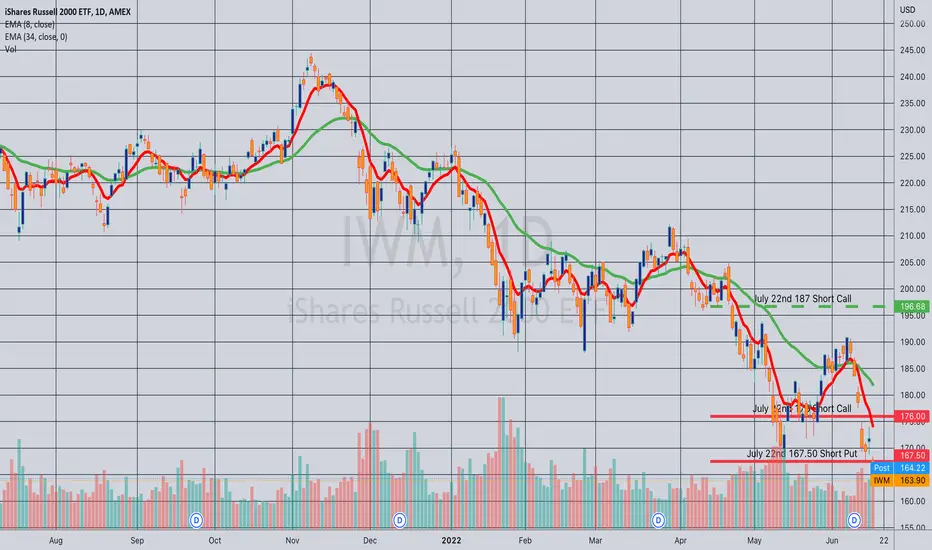
Rolled: IWM July 22nd 176 Short Call to 172... for a 1.35 credit.
Comments: Rolling down the untested side of my July 22nd short strangle, the short put leg of which is at the 167.5. Total credits collected of 8.39. End of day delta/theta 7.48/19.31.

$IWM Analysis, Key Levels, and Targets$IWM Analysis, Key Levels, and Targets
I’m calling bottom here…
—-
I am not your financial advisor. Watch my setups first before you jump in… My trade set ups work very well and they are for my personal reference and if you decide to trade them you do so at your own risk. I will gladly answer questions to the best of my knowledge but ultimately the risk is on you. I will update targets as needed.
GL and happy trading.
IF you need anything analyzed Technically just comment with the Ticker and I’ll do it as soon as possible…

Opening (IRA): IWM July 29th 140 Short Put... for a 1.49 credit.
Comments: Targeting the <16 delta strike paying around 1% of the strike price in credit in the expiry nearest 45 days to emulate dollar cost averaging into the broad market.
Rolled: IWM July 22nd 187 Short Call to 176... for a 1.89 credit.
Comments: Rolling down the untested side ... . Total credits collected of 7.04 with 160.46/183.04 break evens. With delta/theta at 29.47/16.08, the setup could benefit from a bounce ... .
iwm gap filled , first index to retrace to pre-covid highsseems like this thing should begin to stabilize as other indexes complete their selling...we'll see

Russell ready to rally✔️Gap has been filled from November 2020.
✔️Bullish divergence on multiple time frames (4H, daily, and weekly)
✔️Put/Call ratio over 1.2
Looking to run to $178.

$IWM — Gap Fill Very high chance of this gap - at $165 - filling to the downside.
It's just a matter of when - not if.
Very possible that we see zig-zagging A B C D patterns to the downside before it fills - I don't think we will waterfall down to that level.

170 and 140 are critical support for IWMPay attention to price action around the 170 and 140 price range, these are the major supports I see.

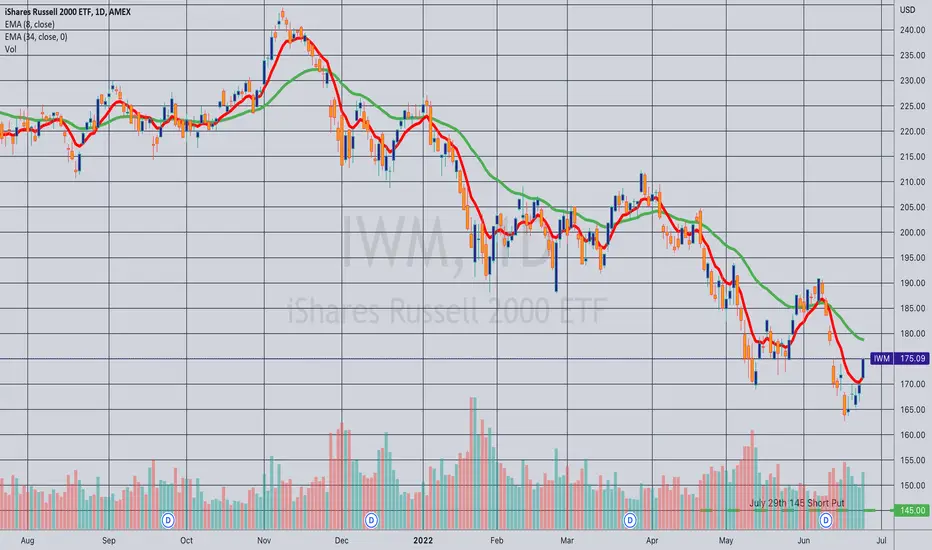
Opened (IRA): IWM July 29th 145 Short Put... for a 1.91 credit.
Comments: Targeting the <16 delta strike paying around 1% of the strike price in credit in the expiry nearest 45 DTE.
