Buying the FibHad to step up at the end and buy some based solely on it's hit on the 50% fib correction. David Halsey wrote a book called Trading the Measured Move. Generally directed for short term traders with short term moves, I'm still applying the concept that stocks will retrace 50% of the move and then rally to the .236 fib. Worth a shot with blood in the street today. No one on the market news has had one positive thing to say, preparing everyone for lots more down to come. Worth a shot for obviously, a long term position.k
IWM trade ideas

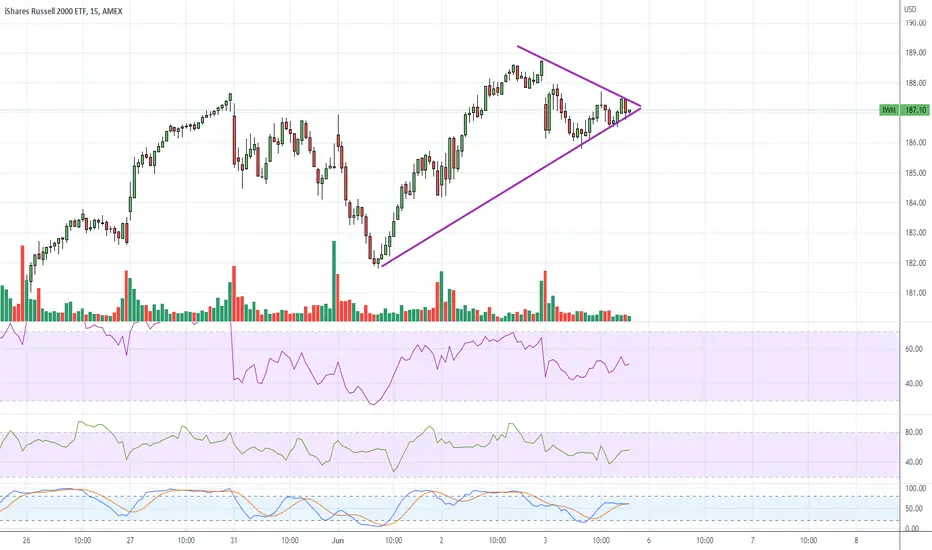
IWM pivot points and volume by price areasIWM pivot points and volume by price areas. Red lines indicate pivot points. Purple lines are volume by price areas. Yellow lines (if present) are weekly price gaps.

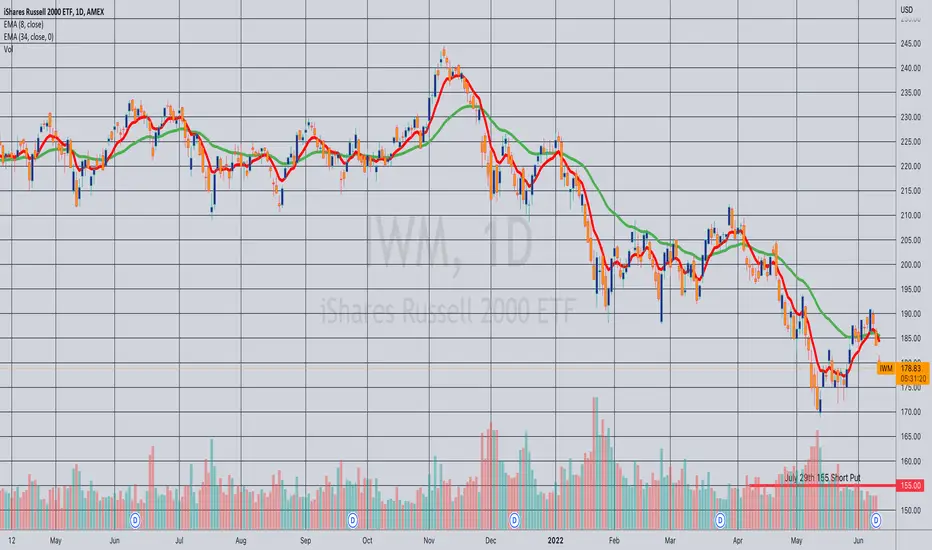
Opening (IRA): IWM July 29th 155 Short Put... for a 1.61 credit.
Comments: Targeting the <16 strike in the expiry nearest 45 days paying around 1% of the strike price in credit to emulate dollar cost averaging into the broad market. Still have July 1st, July 8th, and July 22nd rungs on.
Rolling: IWM July 22nd 202 Short Call to 197.5... for a .93 credit.
Comments: Rolling in the untested side of my July 22nd short strangle to maintain a <1.0 delta/theta ratio. Total credits collected of 3.80.

Russell 2000 Bear Trend
Well.
1) Macro bullish symmetrical triangle fakeout leading to top signal.
2) Low volume on bullish break, High volume on reversal confirming fakeout.
3) Omicron Variant market reaction =~= Covid-19 market reaction
See SPY fakeout before March 2020 Covid-19 crash. (right)
Lastly, see bearish divergence between index and % of stocks above 200 ma (orange).

several ways to end this weekim imagining if we touch these levels where the paths are we will exhibit the following patterns friday- monday

Opened: IWM July 22nd 167.5/202 Short Strangle... for a 3.18 credit.
Comments: These WERE 16 delta strikes on both sides when I opened this using my phone app at around 9:45 CST. In any event, 3.18 credit on BPE of 21.00; 15.1% ROC at max as a function of BPE; 7.6% at 50% max. Will look to adjust sides on side test/approaching worthless or a delta/theta ratio >1.0. (The ratio is currently 5.97/10.48 or .57).

Opened (IRA): IWM July 22nd 162 Short Put... for a 1.65 credit.
Comments: Did some in the Q's, some in SPY ... . Figured that I might as well go for the trifecta. Targeted the <16 delta strike in the expiry nearest 45 days' duration paying around 1% of the strike price in credit to emulate dollar cost averaging into the broad market.
Will look at net delta tomorrow and determine whether I need to adjust my hedges to keep net delta "happy."

Rolled (IRA): IWM June 17th 179 Short Put to July 22nd 169... for a 1.03 credit.
Comments: Mechanically rolling out at 50% max to the <16 delta strike paying around 1% of the strike price in credit in the expiry nearest 45 days. Total credits collected of 3.76 (See Post Below) plus the 1.03 here for a total of 4.79 relative to the July 22nd 169 short put value of around 1.80, so I've realized gains of 2.99 ($299) so far.
Doing this reduces risk not only because the strike is lower, but also because I collected a credit to do it, reducing my cost basis even further.

$IWM Analysis, Key Levels, and Targets$IWM Analysis, Key Levels, and Targets
I do not have a position at this time, but here are some levels that I’m watching…. Any pull back near the dotted light blue line and I’m buying ITM calls… anything above 205 (maybe even 200) and I’ll buying ITM puts….
Have fun, y’all…
—-
I am not your financial advisor. Watch my setups first before you jump in… My trade set ups work very well and they are for my personal reference and if you decide to trade them you do so at your own risk. I will gladly answer questions to the best of my knowledge but ultimately the risk is on you. I will update targets as needed.
GL and happy trading.
IF you need anything analyzed Technically just comment with the Ticker and I’ll do it as soon as possible…

Harami cross for the $IWMThe small caps had an impressive rally this week. On Friday, amid general weakness in the markets, the $IWM posted a harami cross. From a technical analysis perspective, this candlestick is a warning sign for a possible reversal. However, in order to get bearish on this sector, we would need to see some continuation to the downside early next week. For now, all that this candle tells us is that the market is somewhat indecisive. We are going from bullish to neutral into next week with regards to the $IWM.

Indices forming an intraday pennantAppears to be an intraday pennant on the 4 major indices (SPX, NDX, DJI, Small Caps). Could go either way either way Monday.
I just have some PTON puts because it's total garbage, but even garbage will float on a rising tide. just a small play.
In any case, I don;t expect the market to do anything in the last hour, but we'll see. My futures indicators are still trending bearish.
Closed: IWM July 1st 173/194 Short Strangle... for a 4.58 debit.
Comments: Plain Jane profit-taking. Collected a total of 6.33 in credits. (See Post Below). Closing out here results in a net profit of 1.75 ($175).

IWM/RUT Wyckoff Distribution is BACK!?About 3-4 months ago, I mentioned that the Russell 2k was showing signs of distribution (huge consolidation before a downtrend). I outlined where big money was selling and where they flipped short. Since the breakdown, we have seen nearly 3 months of consolidation. One could argue that the consolidation was symmetrical with higher highs and higher lows. That, my friends, would be the makings of a BEAAAAR FLAAAAG. If this bear flag correctly plays out, the target to the downside would be about 170 which is former resistance AND a previous gap. Closing above the previous local high at 205 is probably a good stop out.

6/1/22 IWMiShares Russell 2000 ETF ( AMEX:IWM )
Sector: Miscellaneous (Investment Trusts.Mutual Funds)
Market Capitalization: $$--
Current Price: $184.26
Breakout price: $187.85
Buy Zone (Top/Bottom Range): $183.95-$168.15
Price Target: $189.60-$204.00 (1st), $249.20-$278.80 (2nd)
Estimated Duration to Target: 172-180d, 412-422d
Contract of Interest: $IWM 12/16/22 200c, $IWM 6/16/23 210c
Trade price as of publish date: $7.86/contract, $9.41/contract

Where are we IWM?Where are we IWM? Here's a Mega Triangular Trend Channel MTTC2.0 (beta) set to 200SMA with 19 levels. And my tickerTracker MFI Oscillator set to 20 with SPY, VTI, QQQ, IWM & DIA.
Do your own due diligence, your risk is 100% your responsibility. This is for educational and entertainment purposes only. You win some or you learn some. Consider being charitable with some of your profit to help humankind. Good luck and happy trading friends...
*3x lucky 7s of trading*
7pt Trading compass:
Price action, entry/exit
Volume average/direction
Trend, patterns, momentum
Newsworthy current events
Revenue
Earnings
Balance sheet
7 Common mistakes:
+5% portfolio trades, capital risk management
Beware of analyst's motives
Emotions & Opinions
FOMO : bad timing, the market is ruthless, be shrewd
Lack of planning & discipline
Forgetting restraint
Obdurate repetitive errors, no adaptation
7 Important tools:
Trading View app!, Brokerage UI
Accurate indicators & settings
Wide screen monitor/s
Trading log (pencil & graph paper)
Big, organized desk
Reading books, playing chess
Sorted watch-list
Checkout my indicators:
Fibonacci VIP - volume
Fibonacci MA7 - price
pi RSI - trend momentum
TTC - trend channel
AlertiT - notification
tickerTracker - MFI Oscillator
www.tradingview.com
Rolling: IWM July 1st 158 Short Put to July 1st 173... for a 1.64 credit.
Comments: Rolling up the short put aspect of my July 1st IWM short strangle, the short call of which is at the 194 to cut the delta/theta ratio to around 1:1. Total credits collected of 6.33.
It's now delta/theta -12.03/14.85.

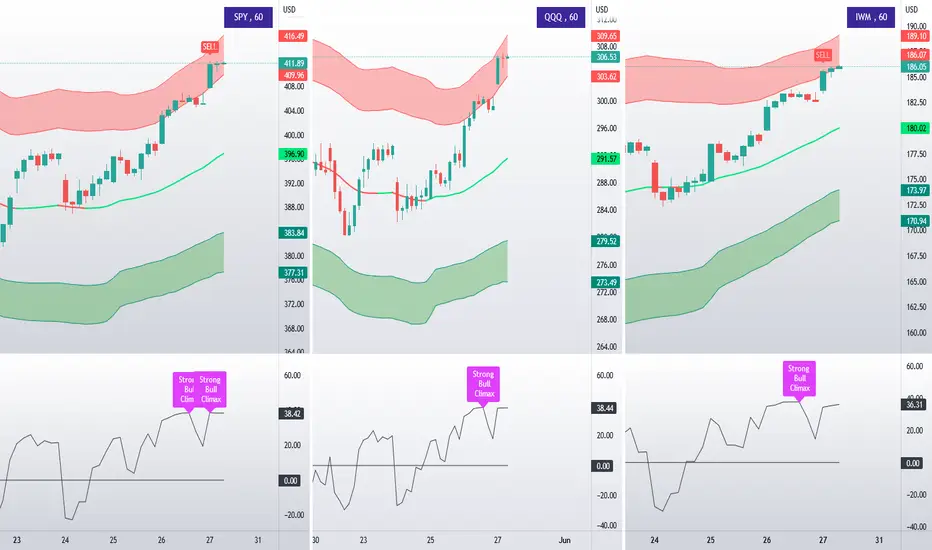
Bulls look tired, they pushed SPY, QQQ, IWM into the supply zoneSPY, QQQ, IWM printed buying exhaustion signals
I expect to get a pullback next week
Rolling (IRA): IWM July 1st 154 Short Put to July 8th 164... for a 1.04 credit.
Comments: With the July 1st 154 at greater than 50% max, rolling it out to the <16 delta strike in the expiry nearest 45 days paying at least 1% of the strike price in credit. Total credits collected of 1.64 (See Post Below) plus the 1.04 here, for a total of 2.68.


Swing long IWM 175.26Daily stoch heading up also making higher lows
Vol stink tight trailing stop
Weekly on bottom sideways
target is 185

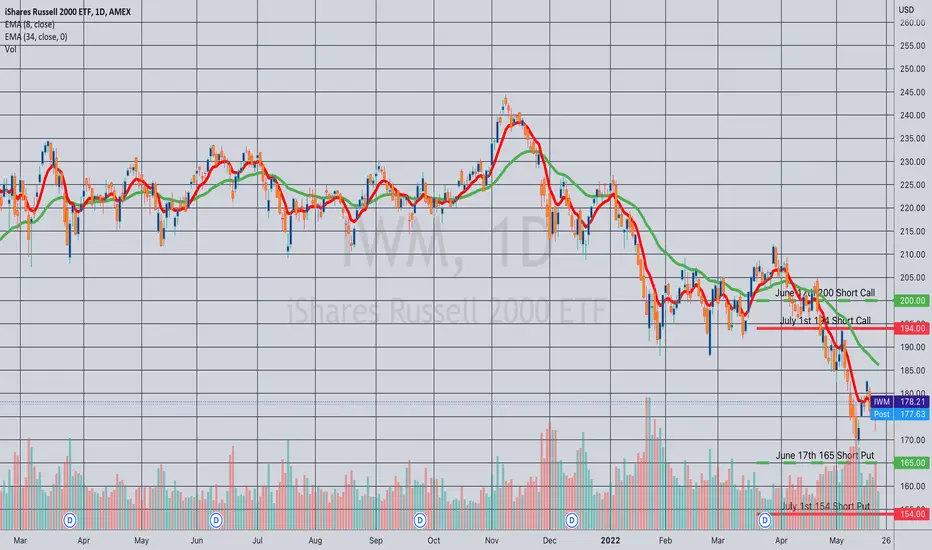
Rolled: IWM June 17th 165/200 Short Strangle to July 1st 158/194... for a .90 credit.
Comments: Locking in some realized gain here on this little bounce, recentering side risk, and receiving a credit all at the same time. I rolled both sides to the 16 delta strikes, so that the position is back to delta neutral.
Total credits received of 4.69, relative to a current short strangle price for the July 1st 158/194 of 3.28, so I'm up 1.41 ($141) on the position.
Another Straight Forward Trade DIA and IWM are both pretty under-rated stocks to day trade.
IWM is actually slightly better than DIA because it has similar options liquidity and expiries to SPY.
IWM is set up really nicely for either a swing short or intra-day short plays.
We have IWM confined to a downtrend for the past little while. And while SPY and DIA were somewhat able to break out of their downtrend, only to come crashing back down today, IWM has pretty much remained within this channel.
On the 1 hour we see it set up pretty nicely. We also see a nice little bear flag.
I mean this doesn't need much more analysis, its pretty straight forward.
Based on math projections, we can expect to break at least to but likely below 173.75 tomorrow.
If you want to swing for a bit of a larger gain, I would actually say IWM is set up okay for that as well. Conservatively I would set your first target to 170.
Just my thoughts and what I'm seeing!
Trade safe everyone!
