Closing (IRA): IWM April 29th 170 Short Put... for a .28 debit.
Comments: Cleaning up April. Collected a total of 5.63 in credits with rolls. (See Post Below). Closing out here results in total realized gains of 5.35 ($535).
IWM trade ideas

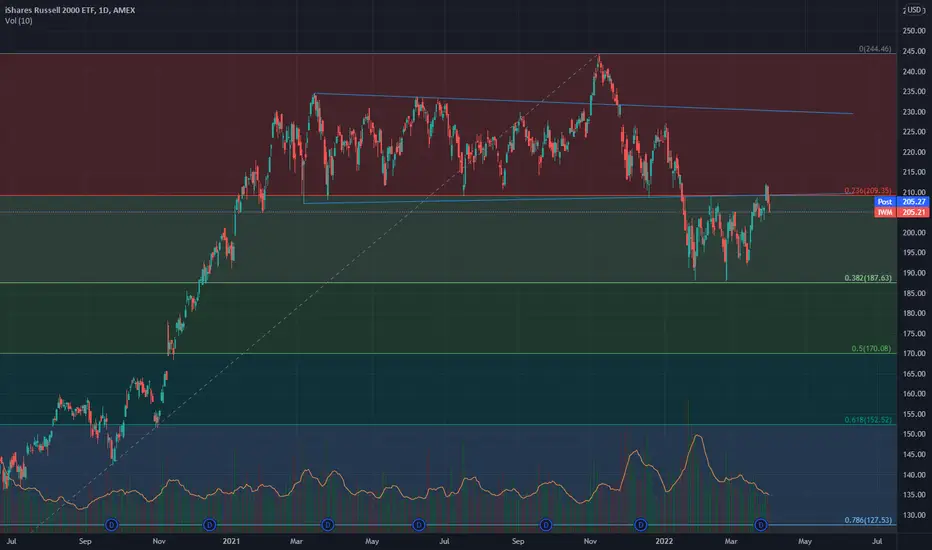
Another IWM false breakout?The Russell 2000 tricked longs back in the fall of 2021 and that "false breakout" led us to a breakdown.
Once again, the break back above the 209.50 level this week may have led to another "false breakout." Can we see a move to the 188.00 level and beyond?
I think bulls have something to think above. Fool me once.

Perfect Retracement for Small Cap Index The Russell 2000 index $IWM retraced and bounced perfectly off the 38% fibonacci level. Actually it bounced twice, which created a double bottom at the 38% retracement level. This strong level of support suggests the bottom may be in and small caps may start to lead the market up again.
IWM 191/186 Put Credit Spread - Apr 29thPut Credit Spread
Strikes: 191 short / 186 long
Credit received: 0.51
Max loss = 5.00-0.51 = $449
Hey Everybody! I have not posted a new trade idea since march 10th, due to a combination of life being busy (part time trader) and the fact that I really wasn't sure where to place my trades with current market conditions. Unfortunately this has lead to my portfolio having 0 positions, so I have been itching to get a position on to generate some returns. Might not be the best solution, but a small position to keep me interested won't hurt that much if it goes against me.
Rationale for this trade:
1. IWM seems to have found another range here from 192 to 209. I like to play these ranges when I can enter into a position that meets return requirements (10% Return on margin) and also provides a significant margin of error or entry point. In this case, the short leg at 191 puts me just outside this range, and paid enough to enter the trade.
Trade Management:
My normal rule is -200% of credit received stoploss or 50% take profit, given that we are currently at the top of this range, if we move back down towards my strike I will likely take this off earlier and look to reset once we show signs of upwards strength.

Closed (IRA): SPY April 14th 391 Short Put... for a .20 debit.
Comments: More taking off stuff approaching worthless on this volatility contraction/rip. Collected a total of 6.40 in credits with rolls. (See Post Below). Closing out here results in total realized gains of 6.20 ($620).

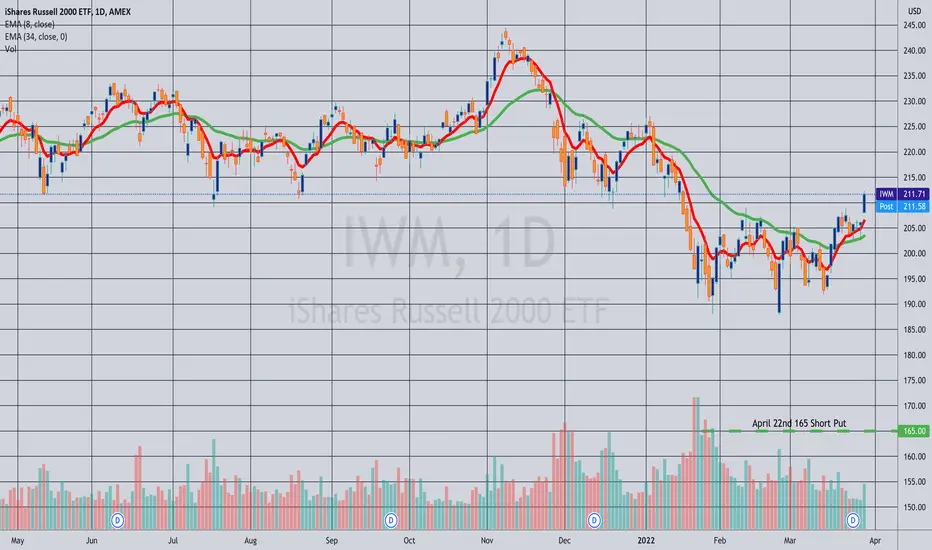
Closed (IRA): IWM April 14th 165 Short Put... for a .20 debit.
Comments: Cleaning up stuff that is approaching worthless ... . Opened for a 1.73/contract credit. (See Post Below). Closing out here results in a profit of 1.53 ($153)/contract. Still left with the April 29th and May 6th "rungs."
iwm watchin the chicklets for targetswatching the vwaps for target/ price chickelts.
and of course fib .618

IWM: Weakness PrevailingIWM Looking like will lead us to the downside this week. The weakness comes at the top of the macro bear flag we cover in depth here. We post videos every Sunday to get your week ready!

Russel2000According to the Russel2000 index, I change my idea to the opposite one. The index cannot overcome the resistance level, which has served as a support level for it for more than a year. A flat is formed, which in this case serves as a pattern to continue the downtrend. The target level for moving down is the level of $160. The fall will not be fast.

Russel2000, RTY, IWMThe Small Cap Index has been erratic over the past year. I will assume its movement, as indicated in the attached forecast, with the target of growth until the end of the year up to a value of 270.

Russel2000, Small CapsShort-term forecast for Russel2000, relevant mainly for small caps companies. The index, starting in September 2020, bounced off the support level of 2100 several times, and on December 20 of this year found itself in the superpoint zone, from where it went up strongly yesterday. Growth is expected to target up to 2500, up to the support level of the sloping resistance. Having reached this target, the index will behave like the S&P500, as indicated in the previous forecast - it will begin a correction.
In terms of growth, we fit into Santa Rally - that is, the beginning of January, which is in good agreement with the previous forecast for the S&P500. You can short-term reject patterns in long at small caps, or unload positions that you do not like, since the bulk of the companies that make up this index are unprofitable.
I do not recommend accumulating short positions on this movement, they will probably try to endure it.

Closing (IRA): IWM April 14th 160 Short PUt... for a .13 debit.
Comments: Opened for 1.73, (See Post Below); closing it out here for a 1.60 ($160) profit. Still have April 22nd, April 29th, and May 6th rungs on which I'll either close or roll out as I get to them from a duration standpoint.

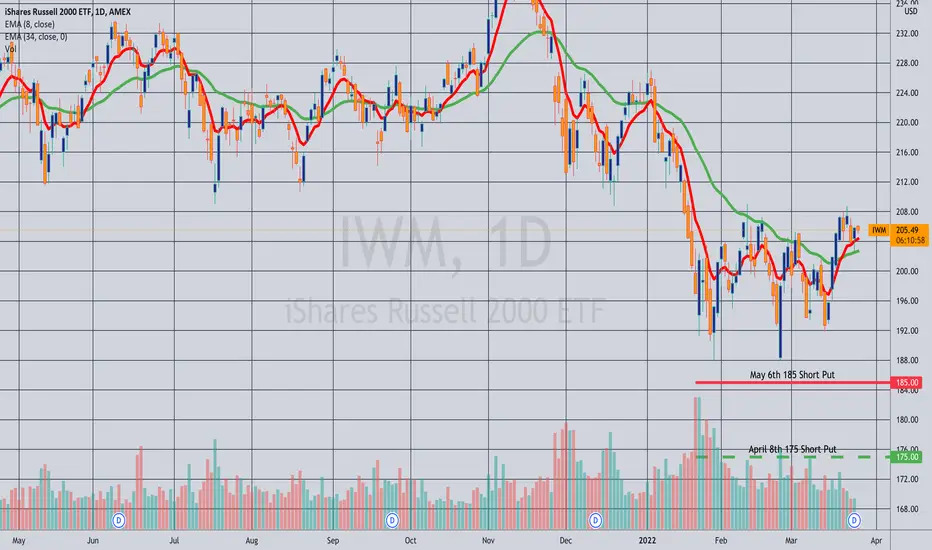
Rolling (IRA): IWM April 8th 175 Short Put to May 6th 185... for a 1.69 credit.
Comments: With only .17 left in the April 8th 175, rolling it out to the <16 delta May 6th strike paying at least 1% of the strike price in credit. Total credits collected: 4.08 (See Post Below) plus the credit received here of 1.69, for a total of 5.77 relative to the May 6th 185 short put value of 1.81, so I've realized gains of 3.96 ($396) so far.
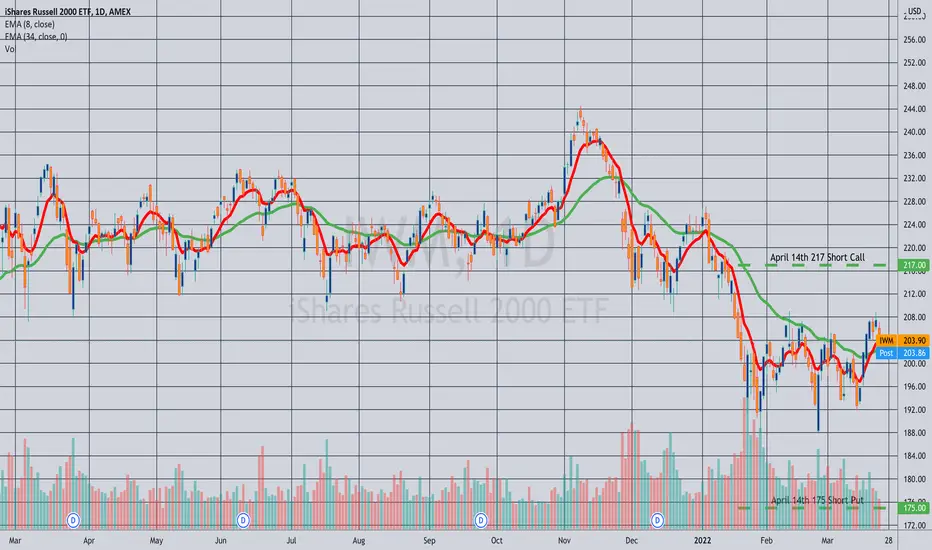
Closed: IWM April 14th 175/217 Short Strangle... for a 1.84 debit.
Comments: Filled for a 3.68 credit. (See Post Below). Closed out here via a good-until-cancelled order to take profit at 50% max. 1.84 ($184) profit.
NEXT LEG DOWN SET IWM The chart posted is one of the most important charts as it s decline was a perfect A=C IN A ABC TO .382 I have a panic cycle to start and be in full force on march 25th and the bottom for this year in the bear market is due april 7/10 date I have moved out of ALL LONGS ACROSS THE INDEXES AND I am now 100 % short sp 4511 and qqq at 354.6

$IWM | WEEKLY WATCHLIST$IWM
Relative strength in small caps here. Broke above downtrend from ATH, looking for continuation.
📈$209.15 | $215, $220, $226
📉$204 | $200, $195, $190


US Small Caps ($IWM) Small caps looks a bit tired, just hit trend resistance from 2001, and has been on down trend since.
Monthly RSI is also showing that we have turned down, which means increased likelihood that we are revisiting 100WMA (golden MA) or lower soon.
Monthly RSI might hold at this level and reach to upper trendline again, but R:R ratio is a bit... meh.
HOWEVER, relative to SPY small caps still present good value.

Small Caps ($IWM) to outperform S&P 500?Risk-reward of relative performance points to small caps outperforming large caps in the next few years.
HOWEVER, in recessionary bear markets... small caps tend to underperform, so be aware!

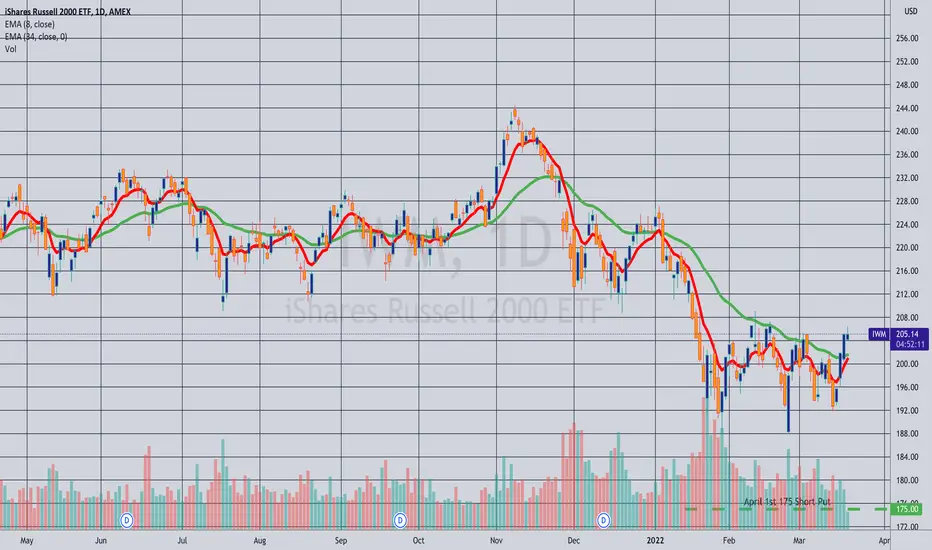
Closing (IRA): IWM April 1st 175 Short Put... for a .27 debit.
Comments: Opened this for a 1.98 credit. (See Post Below). Out here for a net profit of 1.71 ($171). Still have April 8th, 14th, 22nd, and 29th rungs on.
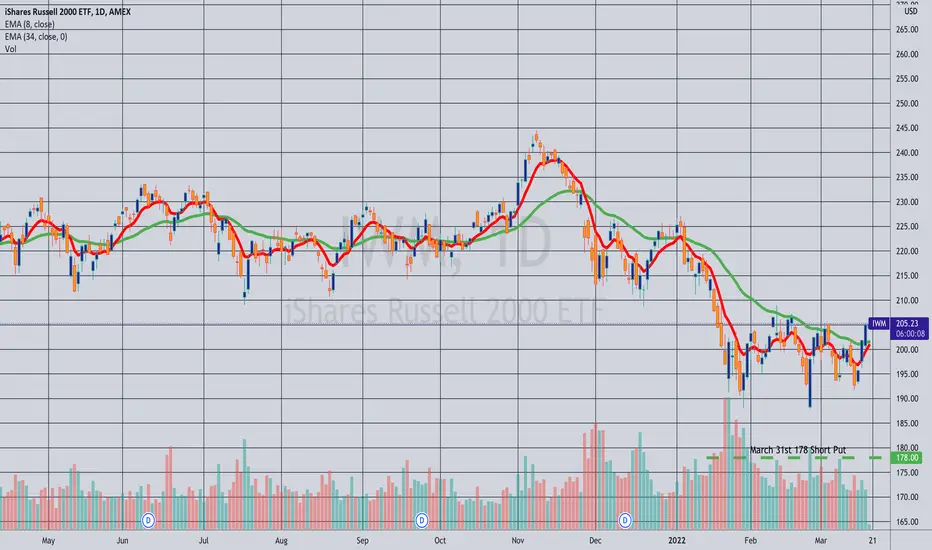
Closed (IRA): IWM March 31st 178 Short Put... for a .29 debit.
Comments: I'd ordinarily roll this out to the weekly, but we don't have a May 6th expiry yet. I've already got a rung on in the April 29th expiry, so am just taking profit here. Total credits collected of 2.67. (See Post Below). Closing hour here results in a profit of 2.38 ($238).
IWMH&S still in tact. Want to see YTD VWAP (purple line) hold as resistance here. Otherwise h&s is invalid.

IWM sella very strong green candel breaking the level of resistance with loot of force indicates the end of the uptrend and a fall under the level
