Market Update - 4/6/2025Was contemplating selling some puts to bet on a rebound next week given how oversold we are on all measures, but decided to pass. We are in uncharted territory and you never know how steep these markets can fall before they find support. After all, I'm not in the falling knife catching business.
As for my active account, I only had a few small trades booking a small loss for the week. Still flat for the past month. Overall likely cash will continue to be king for a while. I'm always on the lookout for high RS names though, but now things are extremely shaky to be buying breakouts.
IWM trade ideas

US Small Companies Index ‘Russell 2000’ in Critical Trend!US Small Companies Index ‘Russell 2000’ in Critical Trend!
Let's take a look from a Fundamental and Technical perspective;
In 2020, the middle band (main trend line) of the logarithmic rising channel was broken and the upward movement had continued since then. Today, however, the same critical support level is being tested again.
If it cannot hold at this level, a long-term trend break may occur. This would significantly increase the risk perception in Russell 2000 companies.
What is Russell 2000?
It does not include large technology giants such as Nasdaq or S&P 500, but small and medium-sized companies that hold the real pulse of the US economy.
These companies are more fragile and more vulnerable to economic fluctuations.
The spread of anti-Trump protests shows that small businesses are starting to be affected both physically and economically.
The prospect of no interest rate cut by the Federal Reserve (FED) is crushing these companies under high borrowing costs.
The contraction in consumer spending can directly hit the profits of these companies because they are dependent on the domestic market.
Possible Scenarios for This Week:
🔴 If the protests deepen and the market panics:
If a break below $180 comes, the $170 support level is tested.
With panic sales, the $150 - $160 region, which is the lower band of the channel, may come to the agenda.
🟢If the environment calms down and economic data signals a recovery:
Strong purchases come from the middle trend line.
$200 - $210 band can be targeted.
In short, support is now being tested, if it breaks, the risk of serious decline is on the table.

IWM 20/03/2025 - LongPrice action is in an uptrend(higher high)and has touched the 0.5 confirmed Fibonacci level, the price is also "sitting" on the weekly and 2-week moving average and a strong multi-year horizontal trend line(the purple one just beneath the 0.5),
But,
Everything can change at any moment, and the market can resume the broader market's downtrend because of the uncertainty surrounding it.
Wishing you good luck

Opening (IRA): IWM May 16th 190/195/220/225 Iron Condor... for a 1.70 credit.
Comments: I think I have more than enough long delta on at the moment, so opting to go nondirectional/delta neutral here. Selling the 25's and buying the wings out from there, collecting one-third the width of the wings in credit.
Metrics:
Buying Power Effect: 3.30
Max Profit: 1.70
ROC at Max: 51.5%
50% Max: .85
ROC at 50% Max: 25.8%
Will generally look to take profit at 50% max, roll in oppositional side on side test.

IWM Below $195! Can it Survive the Gamma Squeeze Pressure?🧠 Macro Context
* The Trump tariff news shocked risk-on assets, and small caps were hit hardest.
* IWM broke below the $195-$199 demand zone, now sliding into dealer gamma hedging territory.
* GEX flow now clearly suggests a momentum-driven selloff, with risk of gamma acceleration if $192 breaks down.
📊 Technical Analysis (1H)
🔺 Previous Structure:
* IWM retested $201 after consolidating for days, then dumped hard, invalidating the breakout structure.
* The large red candle broke through the HVL zone ($199) and cleared multiple support levels in one move.
🔻 Current Zone:
* Trading near $192.40, where there's no immediate gamma support, making this a vulnerable spot.
Key Levels:
* Immediate Resistance:
* $198 – PUT Wall zone (2nd wall)
* $199–$201 – HVL, former support now resistance
* $203–$206 – stacked GEX CALL walls
* Support Zone:
* $191.43 – session low
* $190–$188 = potential short-term bounce zone if VIX compresses
* Below $188 = open gamma air pocket to $185
🧨 GEX + Options Sentiment
GEX Analysis (Options GEX ):
* 🔴🔴🔵 GEX = short gamma, dealers are likely short puts and hedging by selling into weakness.
* $198: 2nd PUT Wall and GEX floor — breaking this triggered the slide.
* No firm GEX support until $190, meaning price can overshoot downward.
Options Oscillator:
* IVR 40.4 / IVx avg 39.7 – moderate vol setup, but rising put pressure post-tariff.
* PUTs 21.5% – leaning bearish
* Spike in upcoming OPEX gamma positioning means dealers are reactive, not supportive.
🎯 Trade Setups
🐻 Bearish Continuation:
* Entry: Breakdown below $192.00
* Target: $190 → $188
* Stop: Above $195 reclaim
* Contracts: 0DTE or 2DTE $190P / $188P
🐂 Bounce Reversal Play:
* Only viable if $192.00 forms a strong base and we reclaim $195 with volume
* Target: $198–$201 (retest of breakdown)
* Contracts: 0DTE $195C / Spread to $198
🔍 Conclusion:
IWM is under pressure with no strong gamma cushion until $190. If $192 fails, expect volatility spikes. Dealers are likely hedging against further downside. Only reversal signal would be a strong reclaim above $195–$198, which may spark a reflex rally.
Suggested Play:
* Scalpers: $192.00 key pivot
* Swing: Bearish bias into $190 unless bulls reclaim $195 HVL zone
* Options: Puts for continuation / tight call spreads only above $198
Disclaimer: This is for educational purposes only. Always manage risk and trade with discipline.

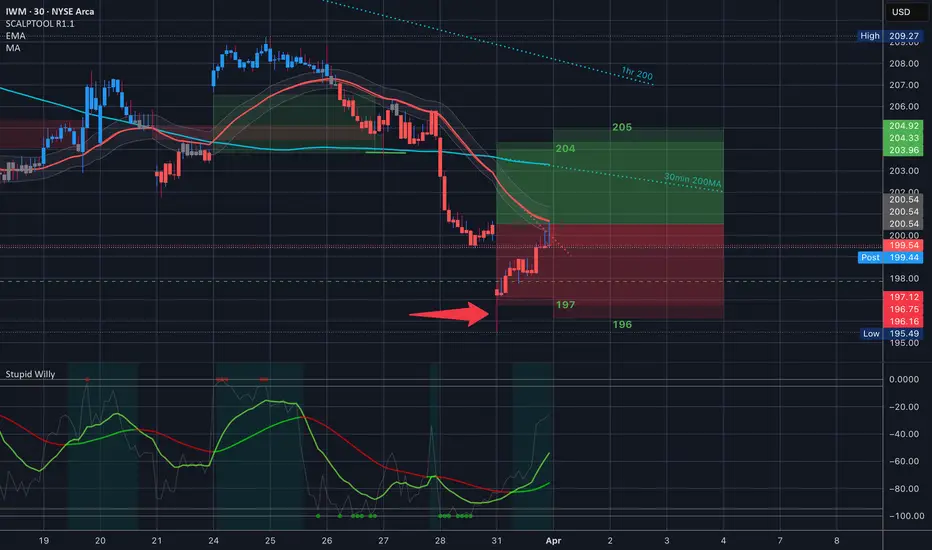
$IWM BOOOM Perfectly Nailed the Bottom in last nights video
197/196 Bull put spreads were the money play today on that drop. And of course that would have been the place to go long on the day.
Market Update - 3/30/2025Correction: * New leg lower
Market seems to be accelerating to the downsides. I was ignoring the warning signs and entered a few poor quality setups so I lost probably around 2% from last week.
I've had enough so I created a new rule where I can only enter picture perfect 5* setups in bad market environments like we are in now.
Despite all this, I'm flat for the month and sitting on 100% cash, which is quite refreshing to see given the indexes lost quite a lot and we're probably heading lower.
I need to remember that sitting on cash is an edge.
We've been in a bad environment for over 120 days which is the longest consecutive one since 2015. I expect another leg lower but I think once we find bottom, we can see a really strong rally. Maybe that rally will only last 1-2 weeks and then the market rolls over and we continue the correction, but the momentum leaders with 99 RS ratings in that rally will likely go up 100%+ in short amount of time. And I will be prepared.
For now, sitting and waiting.

$IWM Analysis Key Levels & Targets
Heading into the island gap here.
Not taking a position here yet. The implied move was strangely wide today but maybe an opportunity will come up. For now here’s just the chart

$IWM: Retest the trendline?Just another TA that I want to watch and test. Big gap below. Possibly retest the trendline?
Yellow lines are my levels.
Green Ray for my possible entry

Market Update - 3/23/2025Chop-chop -> worst market environment for my style.
I'm 100% cash, not much progress since last week, but I'm happy I could hold onto my winners and not give back basically anything.
My biggest lesson right now is to learn how to be more selective with my trades. Even though I risk MUCH less than before so even if I mess them up it doesn't have much impact on my results, they still add up. If I take 10 losing trades of 0.3% risk (which is not at all uncommon in this environment), that's still a 3% drawdown that could have been avoided just by sitting on cash. My FOMO is something I need to work on and not feel bad for missing trades. I need to develop probabilistic thinking more and realize that missing a few trades doesn't matter in the grand scheme of things. But damn this lesson is hard.

This run ends at 213The yellow line represents the highest gap. only shows up on the 5 minute for me. i think that is the point at which this uptrend stops and we continue down. the weekly has already turned over and the month is very close. I recommend shorting at 213, but I am certain we are headed to 213 before we continue the downtrend.

$IWM - Trading Levels for March 20 2025AMEX:IWM - Trading Levels for March 20 2025
THIS is the game plan today - if you know you know.

$IWM - Trading Levels for March 19 2025
The only MA’s in today’s trading range is the 30min 35EMA which we opened right at, and the 30min 200 At the top.
Just one bear gap here at the same level where we filled the last one. Seems like a level with a lot of resistance (205)
35EMA is the level to watch - right now it’s neutral/bearish and if the 35EMA crosses above the 30 200 it will be bullish and if we get pushed back down under the 35EMA It will be bearish.
198 is current support

$IWM - Trading Levels for March 18 2025
Not too much to write today because I’m on Spring Break and even though I am trading I’m not at my computer as much.
We are Neutral bearish here being above the 30min 25EMA but under the 30min 200MA - premarket taking it right to the 35EMA
We filled the bear gap yesterday so look to just under 206 as resistance.
Grab this chart and let's GO!!!

IwmInteresting spot here near 200.00
Honesty it's the most oversold Stock/Index on my watchlist.
Actually price has been trading inside this channel here
After finishing up a H&S pattern
Over the next 2weeks I think we can see a move back to 214 channel top and H&S neckline
I don't think that move will be straight V shape either, maybe a pop to 206 or 207 gap close then a pullback ; if that pullback at holds 199 support then we could see 214, if we break below 198 then the move up is done and we keep sliding
The bigger picture is this, IWM is headed back to trendline support of 15yr channel around 175-180

$IWM - Trading Levels for March 14 2025
Are you guys ready?
The 35EMA - is a BEAST
We closed yesterday right at support
Is today the day we break above the 35EMA for a swing? Grab this chart and let's GO!!! It’s Friday and no matter what happens I’ll be playing one of these sides at these strikes.

Is History Repeating on IWM?1. Historical Pattern Repeating?
✅ Symmetry Between 2021-2022 & 2024-2025
• Both price structures show an initial sharp rally, followed by a head-and-shoulders-type decline, then an extended bearish wave lower.
• In 2022, IWM broke its long-term trendline (yellow) and crashed into a lower range.
• Now in 2025, IWM is showing the same breakdown pattern below that same yellow trendline, suggesting another leg down.
✅ Fractal Pattern Match
• The zigzag pattern (white lines) from 2021-2022 matches closely to the current market structure.
• If this fractal pattern repeats, IWM could be heading for another prolonged decline toward $180 or lower.
✅ Major Resistance Held Strong
• The yellow downward-sloping trendline acted as resistance in both 2021 & now in 2025.
• This rejection in 2025 adds to the bearish probability of history repeating itself.
⸻
2. Technical Indicators Confirm Bearish Bias
📉 Stochastic RSI (Momentum Indicator)
• Currently oversold (~23.29), but no bullish reversal yet.
• This suggests that momentum is still to the downside with no sign of a bounce.
📉 MACD (Trend & Momentum)
• Bearish crossover confirmed, with the MACD histogram turning increasingly negative.
• This reinforces that downward momentum is strong, aligning with the 2021 crash pattern.
📉 Moving Averages Acting as Resistance
• The 200-day EMA (purple line) was broken & rejected, which is a strong bearish signal.
• This rejection mirrors the 2021 rejection, which led to a deep sell-off.
⸻
3. Price Targets & Potential Moves
If IWM follows the 2021 fractal pattern, here’s where it could go:
🔴 Bearish Targets (If Breakdown Continues)
• First Target: $190.00 → Minor support zone.
• Second Target: $180.00 → Key historical support.
• Final Target: $160.00 → Full fractal breakdown completion.
🟢 Bullish Reversal (Invalidation Point)
• If IWM reclaims $204-$210, it could invalidate the pattern and start a recovery.
• Breaking above the yellow trendline (~$210.85) would signal a bullish shift.
⸻
4. How to Trade This Setup?
🔻 Bearish Trade Ideas (If IWM Stays Below $198.75 & Breaks $198.10)
1. 0DTE Put Option (High Risk, High Reward)
• Buy IWM $195 Put (Exp. 3/14)
• Target: $190.00
• Stop-Loss: If IWM reclaims $200.
2. Bear Put Spread (Safer Play)
• Buy IWM $195 Put (Exp. 3/14)
• Sell IWM $185 Put (Exp. 3/14)
• Max Profit if IWM closes below $185.
3. Sell a Bear Call Spread (Credit Strategy)
• Sell IWM $205 Call
• Buy IWM $210 Call
• Profit if IWM stays below $205.
🟢 Bullish Trade (If IWM Reclaims $204 & Breaks Above $210.85)
• Buy IWM $210 Call (Exp. 3/14) → Target $217+
⸻
5. Conclusion – Is IWM Repeating the 2021 Crash?
✅ Yes, the fractal pattern suggests history is repeating.
✅ Downtrend confirmed, rejection at key resistance, and bearish indicators align.
✅ Watch for a break below $198.10 for further downside to $180-$160.

$IWM - Trading Levels for March 13 2025AMEX:IWM - Trading Levels for March 13 2025
We are holding the 198 support but also seeing resistance at the 35EMA. That’s a tough level. The top of the trading range has a bear gap waiting.
I’m going to be looking to the outer spreads here - so 206/207 and 196/195
Don't forget to grab this chart & See y’all in the morning

Time to Scoop up Small Caps?The Russell 2000 is down 17% from November highs. According to Bank of America, small caps are not pricing in a recession. Historical small-cap selloffs during recessions have been 35-40%, with forward P/Es dropping about 30%. Earnings are still 38% below their peak. Small caps trade at 14.2x earnings, slightly below the historical average, suggesting they reflect a mild manufacturing slowdown rather than a recession. P/E valuations suggest 9% annualized returns for the Russell 2000 over the next decade, compared to 5% for mid-caps and 1% for large caps.
IWM Technicals:
- Multi-year log trend support.
- Vastly under the yearly average (yellow).

IWM call FOMCgonna grab IWM $210 calls for next Friday FOMC is Wednesday seems like trump is pushing for rate cuts. also had Canada cut .25 today and if this bit of green carries over it will be a banger. as always trim along the way make the FOMC trade free. lets eat

late day updateBefore I go shopping. Bulls have everything to prove into the close. Some indexes are showing triangles and rising wedges. Nothing is certain this will be a bullish breakout yet.

$IWM - Trading Levels for March 12 2025
30min 35EMA still holding as resistance - 198 support.
196 bottom of the implied move, and a bear gap above.
Wow I really did that in no particular order, huh?
GL, y’all - I put an iron condor on this 194/196/206/207 at 1.97

IWM Stock Chart Fibonacci Analysis 031125Trading Idea
1) Find a FIBO slingshot
2) Check FIBO 61.80% level
3) Entry Point > 202/61.80%
Chart time frame: B
A) 15 min(1W-3M)
B) 1 hr(3M-6M)
C) 4 hr(6M-1year)
D) 1 day(1-3years)
Stock progress: C
A) Keep rising over 61.80% resistance
B) 61.80% resistance
C) 61.80% support
D) Hit the bottom
E) Hit the top
Stocks rise as they rise from support and fall from resistance. Our goal is to find a low support point and enter. It can be referred to as buying at the pullback point. The pullback point can be found with a Fibonacci extension of 61.80%. This is a step to find entry level. 1) Find a triangle (Fibonacci Speed Fan Line) that connects the high (resistance) and low (support) points of the stock in progress, where it is continuously expressed as a Slingshot, 2) and create a Fibonacci extension level for the first rising wave from the start point of slingshot pattern.
When the current price goes over 61.80% level , that can be a good entry point, especially if the SMA 100 and 200 curves are gathered together at 61.80%, it is a very good entry point.
As a great help, tradingview provides these Fibonacci speed fan lines and extension levels with ease. So if you use the Fibonacci fan line, the extension level, and the SMA 100/200 curve well, you can find an entry point for the stock market. At least you have to enter at this low point to avoid trading failure, and if you are skilled at entering this low point, with fibonacci6180 technique, your reading skill to chart will be greatly improved.
If you want to do day trading, please set the time frame to 5 minutes or 15 minutes, and you will see many of the low point of rising stocks.
If want to prefer long term range trading, you can set the time frame to 1 hr or 1 day.
