IWM a hit to the gut, on the DailyIWM hitting low after its highs and consolidating, now with the entire market going down, IWM is just doesn't have enough steam behind it with so much shorts and so much uncertainty.
IWM trade ideas

Where's that impulse, Scottie?Visual analysis strongly suggests the Russell's rise from covid crash is a three wave fake MMT induced wave. If that's the case, what might come next? This is just a wild guess. Could be completely off my rockers.

IWM [Russel 2000] Inverse Head & Shoulders & BreakoutThe IWM as seen from the chart has been forming a solid and strong Inverse Head & Shoulders.
An Inverse Head & Shoulders is a strong Bullish Chart Technicals Pattern, that can be seen here. 2 Shoulders, and 1 head in the middle, making the low.
I am sharing this idea, as it is a pattern which has been printed on the Russel-2000 this past week, and can't go unnoticed!
The Russel-2000 Index has also been in a YEAR-long consolidation, and is ready to make a move one way or another.
On the weekly time frame of the Russel, the TTM_SQUEEZE Indicator a momentum indicator that can also predict big moves has been flashing red (signaling squeeze) and that a big move is coming one way or another.
AFTER This recent breakout attempt in November from IWM, and a retest of the bottom consolidation levels, the russel seems ready to bounce up with this inverse head and shoulders, or make a break down.
I think this is something to definitely keep on your radar folks!
Good Luck Trading!
I am personally looking at playing this with either :
IWM febuary monthlys OR $URTY a 3x leveraged russel ETF

IWMWas waiting all morning for this gap (pink line) to fill. Of course as soon as I get distracted with something, it fills and pulls away. Oh well. Probably bounces up to around $209 if I had to guess.

IWM trade update, and more swing putsIn my previous chart (linked) I gave notice of IWM breaking down from its range. The upper gray line marks the lowest close of the sideways range, and the lower line marks the dip last January. There is a lot of air underneath.
I took profits on the dip to 205 yesterday. Today I bought 18Feb puts again at the 208-209 resistance. Now looking at 198 break, then 193, 185.
fyi - My option swing trades usually last 1 day to 2 weeks. I only use long calls or puts, single leg.

Breaking DownWe broke down from a year long Darvas box.
We broke up last year then failed. That was the biggest signal last year that something is wrong.
2022 will be a long year if you are not prepared for it.

IWM set to take a leg down. IWM (russell 2k ETF) has been stuck in a ranging rectangle consolidation pattern for like a year. Everyone can see it, it's definitely no secret. This is why I think the last bull spike above resistance failed and was sold off; it trapped a lot of people who assumed it was an upward breakout.
Anyhow, this simple mockup just adds more bad juju, as you can see it's formed a descending triangle pattern in addition to the 200SMA now being resistance. Both of these are very bearish. I am shorting IWM simply too many factors against it....with these two just dumping fuel onto the fire. We might see a bounce at support, yes, but with each bounce lately has came less and less volume. Im interpreting this as the bulls losing confidence, while at the same time the declining trend line that makes the "descending" part of the triangle clearly shows the bears are jumping in earlier and earlier. I think it's just a matter of time now before we formally break the support of the bottom of not only the triangle, but the rectangle bottom support line just below it.
It was a good ride!

$spy $iwm Finally brokeThere is an airpocket and lack of support till it reaches 197 and fills that big gap.

𝗦𝗺𝗮𝗹𝗹-𝗰𝗮𝗽 𝗨𝗽𝗱𝗮𝘁𝗲: $IWM Daily. WARNINGConcerning chart. Looks like a backtest today ... as long as below 209 there's substantial risk to the downside
$RTY_F $AMC $CROX $SPY $ES_F $QQQ $NQ_F $VIX $TLT $TNX $DXY #Stocks #Trading 📉

Russel Wyckoff distribution phase DIWM looks like it is about spend the next week or so completing Phase D of Wyckoff distribution, a test of the resistance overhead seems likely followed by a subsequent fall off into Phase E downtrend, the gap down to 163 seems like a likely PT by all metrics, including Fib .786 retrace between what I would consider the last 2 major pivots.

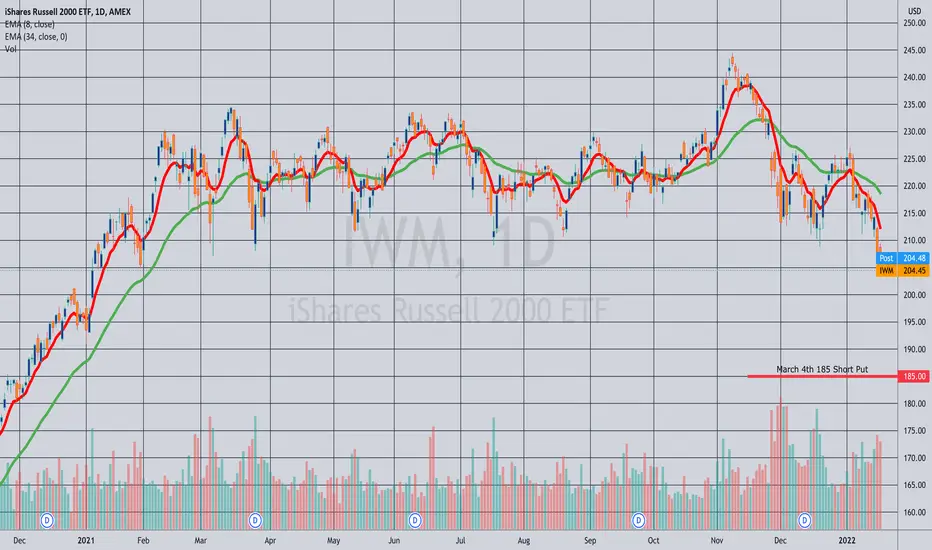
Opened (IRA): IWM March 4th 185 Short Put... for a 2.50 credit.
Comments: Sold premium right at the close in the expiry nearest 45 days to emulate dollar cost averaging into small caps.
Holistically, I've been using IWM for shorter duration trades (~45 days until expiry) and SPY for longer duration ones (since it doesn't pay as well as a function of buying power effect), and then coupling that with a longer-dated short delta hedge or hedges. (See, e.g., Post Below). I'm still net delta long, just not as long as I would be were I to be all short put without some kind of short delta aspect.
iwm short there is so much you can do when monitoring shares. i missed the trendline break. iwm closed and broke support . would look only for short

Time to short the Russell 2000 ETF IWM, and here's why.Here is a chart of the entire IWM ranging behavior over the past like 9-10 months. You can clearly see the resistance and support lines. The top resistance line also coincides with the R1 monthly pivot resistance line.
Below is the OBV with the same ranging behavior over the same time span. Obviously, volume should confirm price.....and up until recently it more or less has, also ranging up and down between the support and resistance lines drawn on the OBV indicator itself.
My point is...... look at the far right, where the purple rectangle boxes are. See the problem? OBV has already plowed downward well out of the rectangle and below the support line. Notice how it also never confirmed the prior IWM break out of the range. It was a leading indicator there that the break out would fail.....and it did.
Now it's clearly indicating that IWM is going to blow right through that rigid support line it's bounced off of many times before. My money is betting on that it's right.

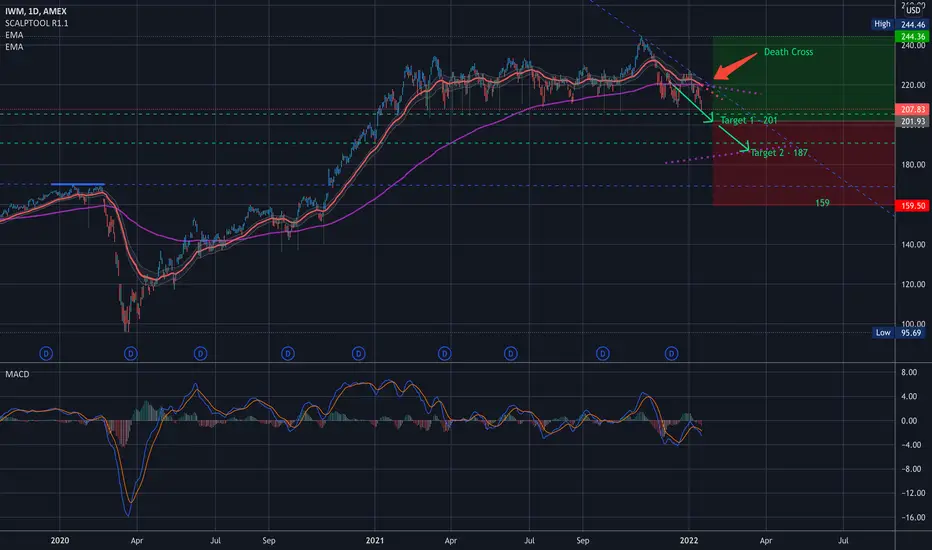
$IWM Key Levels & Analysis & Targets $IWM Key Levels & Analysis & Targets
Well, here comes that 201
Death cross on the daily
Lot’s of resistance to the up side
GL, y’all…
——————
I usually trade both ways, but lately I’ve been focusing more to the downside because of how high the market is. It makes more sense to sell puts right now, and I’m usually at Target 2 or 3.
——————
I am not your financial advisor, but I will happily answer questions and analyze to the best of my ability but ultimately the risk is on you. Check out my ideas, but also do your own due diligence.
I am not a bull. I am not a bear. I just see what I see in the charts and I don’t pay too much attention to the noise in the news.
If you want me to analyze any stock or ETF just leave me a comment and I’ll do it if I can. (If I have time)
Have fun, y’all!!
(\_/)
( •_•)
/ >🚀
$IWMBox is breaking out on top.
But stochastic false bar is still on top.
I will wait for a bar to come below stochastic which will confirm stage 4 decline . Target 160-170 levels

IWMDaily Chart Report
IWM finally breaking to the downside. The first price target is at 198 support level. It think it could move even lower. According to the TA a full measured move to the downside is at 168 support level.
