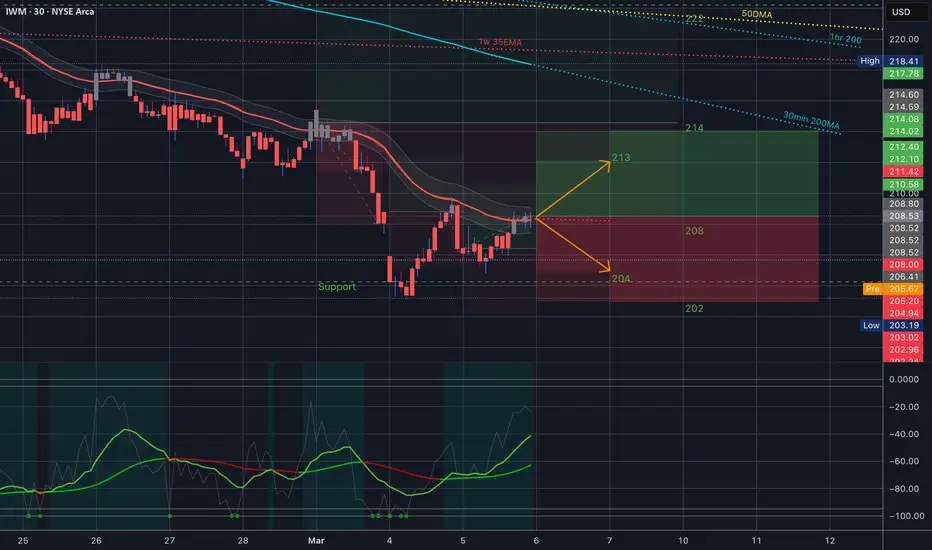
$IWM Trading Levels for March 7 2025
The 30min 35EMA has been STRAIGHT resistance for two weeks now. I wonder what is gonna happen today!!
+/-2.53% today
Let’s goooooo!!!
IWM trade ideas

IWM Staying ShortVery nice short lower highs
look MA crossing down thru one another
Staying short looking for dead cat bounce rally
to add back short. Looking 218 add to short

chart does thing as something happens in the newssame ole same ole. they know exactly where they are taking the price, the news means nothing. IWM will fill the gap @200 and go up from there. pump all day tomorrow, dump to 200 overnight.

$IWM Analysis, Key Levels & Targets for March 6th 2025
That 30min 35EMA though LOL. Just keeps smacking it down!!
=
+/- 1.72% today
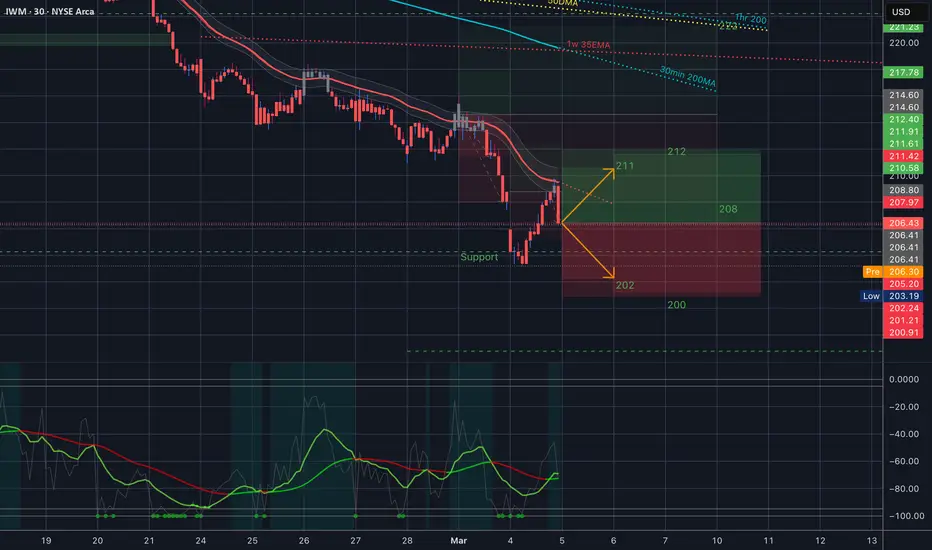
$IWM Analysis, Key Levels & Targets for March 5th 2025
What is running through the trading range today?
Just the 30min 35MEA - and if you follow it back a little bit it has been the resistance for a minute. Just getting over that would be a good sign, lol.
Expected move 202 to 211 (+/- 2.02%)
$IWM - It could bounceAMEX:IWM Currently sitting on a VWAP and POC support. It could find a footing here and bounce! 👀


RUSSELL 2000 Chart Fibonacci Analysis 030425Trading Idea
1) Find a FIBO slingshot
2) Check FIBO 61.80% level
3) Entry Point > 206/61.80%
Chart time frame: B
A) 15 min(1W-3M)
B) 1 hr(3M-6M)
C) 4 hr(6M-1year)
D) 1 day(1-3years)
Stock progress: A
A) Keep rising over 61.80% resistance
B) 61.80% resistance
C) 61.80% support
D) Hit the bottom
E) Hit the top
Stocks rise as they rise from support and fall from resistance. Our goal is to find a low support point and enter. It can be referred to as buying at the pullback point. The pullback point can be found with a Fibonacci extension of 61.80%. This is a step to find entry level. 1) Find a triangle (Fibonacci Speed Fan Line) that connects the high (resistance) and low (support) points of the stock in progress, where it is continuously expressed as a Slingshot, 2) and create a Fibonacci extension level for the first rising wave from the start point of slingshot pattern.
When the current price goes over 61.80% level , that can be a good entry point, especially if the SMA 100 and 200 curves are gathered together at 61.80%, it is a very good entry point.
As a great help, tradingview provides these Fibonacci speed fan lines and extension levels with ease. So if you use the Fibonacci fan line, the extension level, and the SMA 100/200 curve well, you can find an entry point for the stock market. At least you have to enter at this low point to avoid trading failure, and if you are skilled at entering this low point, with fibonacci6180 technique, your reading skill to chart will be greatly improved.
If you want to do day trading, please set the time frame to 5 minutes or 15 minutes, and you will see many of the low point of rising stocks.
If want to prefer long term range trading, you can set the time frame to 1 hr or 1 day.

$IWM Analysis, Key Levels & Targets for March 4rd
We have to levels in tomorrow’s Trading range to be aware of -
1. The 35EMA on the 30min timeframe.
2. Support at 204 (from sept 2024)
That’s it in the trading range but of course you can see a lot around it and I went over it all in tonight’s video.
Gonna be a wild one - let’s go!!!

IWM Approaching Key Support! Reversal Incoming or Further Down?📊 Technical Analysis (TA):
1. Trend & Structure:
* IWM remains in a strong downtrend, marked by multiple Break of Structure (BOS) signals.
* A recent Change of Character (ChoCH) attempt suggests a possible reversal, but confirmation is needed.
* Key Resistance: ~215-218 (supply zone)
* Support Zone: ~205-208 (current demand area)
2. Indicators Suggesting a Possible Reversal:
* MACD: Starting to flatten, showing potential for a bullish divergence.
* Stochastic RSI: Deeply oversold, indicating a potential bounce.
* Volume Spike: Increased volume at support suggests possible accumulation.
🔹 GEX & Options Flow:
1. Call Walls (Resistance) 🚧
* 218-222: Strong resistance where gamma resistance intensifies.
* 230: Major call wall, unlikely to be tested unless a strong bounce occurs.
2. Put Walls (Support) 🛑
* 205: Highest negative NETGEX, meaning a breakdown could accelerate downside pressure.
* 200-195: Next major support levels if 205 fails.
3. IV Rank & Skew:
* IVR 45.2, indicating mid-range implied volatility.
* Puts account for 34.4%, showing strong downside interest.
* Implied move ±0.32%, suggesting potential large swings.
📌 Trading Plan & Suggestions:
* Bullish Reversal Scenario:
* If IWM holds 205-208, we could see a bounce toward 215-218.
* Ideal trade: April 210C or 215C, targeting a reversal move.
* Bearish Breakdown Scenario:
* If IWM loses 205, downside targets extend to 195-200.
* Ideal Put Play: Buy March-April 205P or 200P, targeting 190-195.
⚠️ Key Warning: If IWM fails to reclaim 210 quickly, bearish momentum could extend further.
🔥 Conclusion: IWM at a Decision Zone – Bounce or Breakdown?
Russell 2000 is testing a key support area, with early reversal signals forming but heavy put positioning remains. The next few sessions will decide if we get a bounce or another leg lower. Watch price action near 205-208 closely before making a move. 🚀📉
🚨 Disclaimer:
This analysis is for educational purposes only and does not constitute financial advice. Always do your own research and trade responsibly.

$IWM Analysis, Key Levels & Targets for March 3rdAlright, y’all… I am still sick and still dealing with the fatigue so I’m not going to write a whole lot but here are the levels for tomorrow
You know what to do with them… lol
And we will go over it all tonight.
Don’t forget to hit the “Grab this Chart” button under this chart is you want to use it.

IWM BUY ZONEMy trading plan is very simple.
I buy or sell when:
* Price tags the top or bottom of parallel channel zones
* Money flow spikes beyond it's Bollinger Bands
* Price at Fibonacci levels
So...
Here's why I'm picking this symbol to do the thing.
Price in Green buying zone
Stochastic Momentum Index (SMI) at oversold level
Money flow momentum is spiked negative and under bottom of Bollinger Band
I'm buying in this green zone, again if price hits $212 near the yellow zone or red line. Will sell and/or short when price reaches green zone overheard around $226.

$IWM - Analysis Key Levels and Targets for Feb 25
35EMA to the upside and the next support at 214 to the downside. That is all in today's range
Make sure to grab this chart (button just under the chart that says "Grab this chart" and let’s gooo…

$IWM Analysis, Key Levels & Targets for Feb 24
Only Level in our trading rant today? 35EMA. Don’t underestimate it.
Support at 214
Don’t forget to grab the chart and lets goooo…

The IWM is sitting at critical support!!!On Friday, the IWM broke through a multi year support line (beige) and closed below a multi year parallel channel. Thankfully, it found support at its 200 day MA. If the IWM cannot recapture the inside of the parallel channel this week and confirms a close below the 200 day MA - watch out below. This should be on every one’s watch list this week because where the small caps go - every other risk asset will follow!!!

$IWM Recap of Last Week Feb 18-21
Last week IWM opened up and got rejected right away at resistance and there was a LOT of resistance there - the 50DMA being the Main one - being a Downward facing 50 Day Moving Average.
Tuesday and Wednesday we continued to get rejected at the 50DMA
Thursday we gapped down and dropped
And on Friday we opened with a pop to almost the top of the implied move and got SMACKED by the dognap and the downward 50 Day Moving Average.
Were you guys watching Stupid willy below? Tuesday end of day we got the red signal line and it plain out all week. From last Friday to Tuesday we saw a bearish divergence and then the red signal.
Wild day, y’all!! And wild week.
Moral of the week - DON'T go long at a downward facing moving average.

$IWM Analysis, Key Levels & Targets for Feb 21
The top of the implied move today looks intense.
Downward facing 50DMA, Downward facing 30min 200 (which is at least above the 50DMA which is an improvement momentum-wise. And the 1hr 200MA.
That Gap from yesterday runs through all of that.
That area looks pretty mean.
227/228 bear call spreads for sure if we pop up to there.


$IWM Analysis, Key Levels & Targets for Feb 20
30min 200MA right in the middle and flat.
35EMA underneath it with the 50 day moving average.
I always say, don’t go long at a downward facing 50DMA and we’ve been seeing that as resistance and also a loss in strength. Red signal line being tested here as well.
Pretty big trading ranges today, definitely got an expansion from options for some reason.
Let’s have some fun, y’all…

Small Caps Spring Loaded... But Which Way?Smalls caps seems to be building a base in which momentum will play out sharply one way. The million dollar question is which direction that momentum releases. In instances like this I don't hate the idea of being long premium (straddle).
EMA stack is bullish so probability favors the bulls.
We will see how this plays out in the days/weeks to come.

$IWM Analysis, Key Levels & Targets for Feb 19
Red signal line, Downward facing 50 Day moving Average
A 225/224 bull put spread could look good at open. Even if we’re bearish closing within range is still likely.

$IWM Analysis, Key Levels & Targets for Feb 18
Welcome back, y’all. We just had a 3 day weekend so we got an extra day of theta burn if you had any spreads on over the weekend.
Holy Battling Momentum here.
Downward Facing 50DMA and 30min 200 - that is what hit us on Friday!! So watch for that, as we probably aren’t going to be flying past that level too far while it’s still turned downward.
35EMA in the red with the 1hr 200MA as support

$IWM RECAP of Last Week Feb 10-14
YOU DON’T WANT TO GO LONG AT A DOWNWARD FACING MOVING AVERAGE - And in Friday’s Trading Range we had two of them. The 50 Day Moving average and the 30min 200MA and we got SMACKed back down after gapping over those on Friday.
So Last Week was inflation Data.
Monday we opened under the 35EMA and the 35EMA was underneath the 30min 200MA. That is a bearish signal. You can see how it acted as resistance and Tuesday we followed through with a gap down.
Wednesday was CPI which came in hot and we gapped down to start the day and then traded up but still closed in the red.
Thursday was PPI which was also hot and that brought us back to the 35EMA and we closed above it.
Friday we made a run for the 50 Day moving average and opened with a gap above it - and you don’t want to go long at a downward facing moving average. Just a general rule of thumb and the 50 Day MA has a pretty decent downward momentum teamed up with the 30min 200MA that was going to get smacked. It just was.
IWM closed flat on Friday -.08%
