$IWM Analysis, Key Levels & Targets for Today and TomorrowSo we are just underneath 35 EMA if we manage to get above it 50 day moving average will be the target and if we get above that 230 on the day. 231 on tomorrow’s contract. Would be looking at 230 231 bear calls spreads if we do get over the 50 day.
Underneath us, we have that downward facing one hour 200 moving average we also have the four hour two under average and 225 which has held us up so far this week. 223 is the bottom of the move and for tomorrow it’s 222. Underneath that we do have an island gap which we still need to fill, but it’s not in today’s trading range and , I wouldn’t call that a target just yet
IWM trade ideas
IWM Technical Analysis and GEX Insights (1-Hour Timeframe)Current Overview
* Price: IWM is trading at 226.91, showing consolidation within a narrow range.
* Trend: The price remains range-bound, testing both support and resistance levels.
* Market Note: Be cautious of potential gaps or momentum shifts at the market open. The current analysis may require adjustments once trading begins. Feel free to reach out for updates post-open.
Technical Analysis
1. Key Levels:
* Support:
* 225.21: Immediate support level, critical for short-term stability.
* 220.00: Major support, aligning with high negative gamma exposure.
* 215.00: Key put wall and significant downside support.
* Resistance:
* 229.63: Immediate resistance, likely to be tested with bullish momentum.
* 230.94: Key level, marking the upper trendline and strong resistance.
* 235.00: A potential breakout target if momentum strengthens.
2. Momentum Indicators:
* MACD: Showing mild bullish divergence but still neutral.
* Stochastic RSI: High, indicating potential overbought conditions in the short term.
3. Volume:
* Volume remains moderate, reflecting cautious market sentiment in the range.
4. Trendlines:
* The downward-sloping trendline above 229.63 acts as a dynamic resistance level.
GEX (Gamma Exposure) Insights
1. Gamma Walls:
* Call Walls:
* 230.94: Significant resistance with high positive gamma exposure.
* 235.00: Next major resistance level for a breakout scenario.
* Put Walls:
* 220.00: Strong support aligned with significant negative gamma.
* 215.00: Critical downside level to watch for bearish continuation.
2. IVR and Options Flow:
* IVR: 16.3, indicating relatively low implied volatility.
* Calls vs. Puts: Calls account for only 11%, showing neutral to bearish sentiment.
* GEX Direction: Leaning neutral, with slight bearish undertones.
Market Direction Scenarios
1. Bullish:
* A breakout above 229.63 could push prices toward 230.94 and possibly 235.00 with strong momentum.
2. Bearish:
* Failure to hold 225.21 may lead to a test of 220.00 and lower levels near 215.00.
Key Notes
* Price action may change drastically at the market open, potentially creating gaps or trend shifts. Keep a close eye on premarket data and initial moves after the bell.
* If you’d like updated levels and insights following the open, feel free to message me directly.

Russell 2000 $IWM Trending UP versus Nasdaq $QQQ Here is a ratio chart of the Russell 2000 Index etf called AMEX:IWM and the Nasdaq Composite Index etf called $QQQ.
The NASDAQ:QQQ returns over the past 7+ years have been extraordinary while the AMEX:IWM has been stagnant at best and hasn't beaten inflation.
That ratio of performance has just turned in a way that suggests the AMEX:IWM will outperform the NASDAQ:QQQ for the next 11 weeks to the tune of 10%.
The ratio has already moved up last week by 4% of the 10%, so there is only another 6% to go for this signal. If there are any pullbacks of 1%-2%, those would be lower risk entries as the distance to the "stop" level at 0.45 vs 0.4704 last would be less. The target is 0.51 vs 0.4704 last.
So follow this ratio for the next 10 weeks and see if even more relative outperformance happens.
Over the next few years, it is possible for AMEX:IWM to do 50% better than $QQQ.
We would need lower oil prices and lower interest rates and some rational pricing in the big tech names that are over $10 trillion dollars now for 3 companies: NASDAQ:NVDA , NASDAQ:MSFT and $AAPL.

$IWM Analysis, Key Levels & Targets for Day TradersIWM returned to center pretty quickly here and we are back above the 35 EMA, even though we dropped underneath it at open AND WE DO HAVE THE 50 DAY MOVING ABOVE US HOWEVER STUPID WILLIE HAS A RED SIGNAL LINE AND WE HAVE A DOWNWARD FACING 1hr 200MA underneath us with the four hour 200 removing average and the 30 minute moving average those levels could draw us in with a corrective move here. I don’t know why I had all cops up there, but I’m gonna leave it cause I’m in hurry. I will review all of these levels on tonight‘s video.

IWM is on a downtrendIWM is currently in a clear downtrend, forming lower highs and lower lows within a declining channel. A significant selloff could occur in the final week of January, potentially driving the price to establish another lower low. A solid trading strategy to capitalize on this trend would be selling call credit spreads or buying puts to align with the bearish momentum.

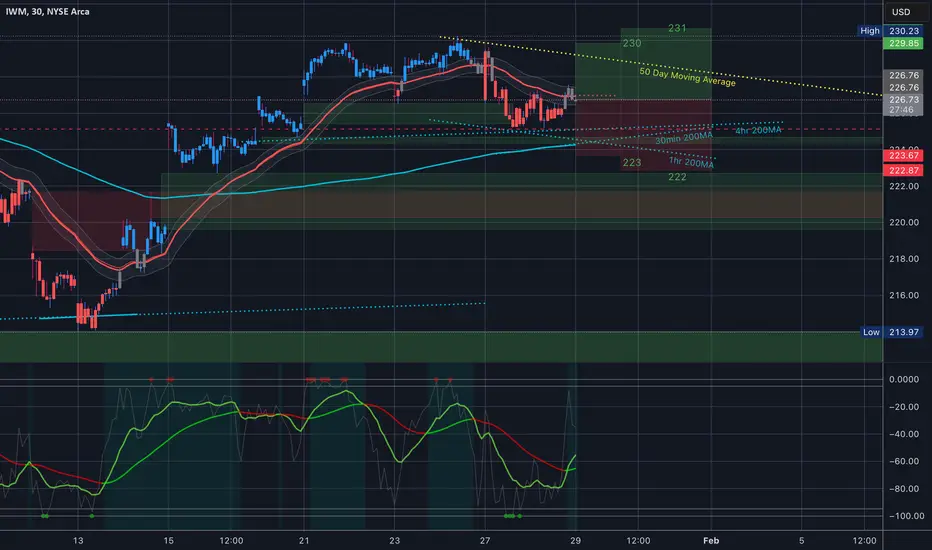
$IWM Analysis, Key Levels & Targets for Today & MondayToday’s expected move in IW is between 227 and 232 which is a 1.19% move. We are sitting right at the 35 EMA, which has been a support level however we do have a downward facing one hour to average that we need to meet up with and turn back around, that is a really real target and that four hour moving average is there well they meet up around 225 so 225 could be a really great support level. We also have the 30 minute moving average underneath that and just the fact that it is underneath those two levels is a bar signal and above us. We do have the 50 day moving average, which we did see as resistance on Tuesday Wednesday.

$IWM Analysis, Key Levels & Targets for Today & Tomorrow226-232 is the implied move for today - we got pushed away at the 50DMA toward the downward facing 1hr 200MA. Red signal line and right here we have the first oversold signal - which definitely downs mean we’re done going down since we still need to turn that 1hr 200MA

IWM Technical Analysis and GEX Insights for Jan. 22Technical Analysis
* Trend: IWM shows an upward momentum with a breakout above the previous resistance level at $227.
* Support and Resistance:
* Immediate Support: $227, previously a resistance level, may now act as support.
* Major Resistance: $230 is the next significant resistance level, aligned with the GEX 2nd
CALL Wall.
* Critical Support: $226 acts as a safety zone, below which the bearish sentiment might strengthen.
* Indicators:
* MACD: Positive momentum; however, the histogram shows slight consolidation.
* Stochastic RSI: Overbought zone, indicating caution for long entries in the short term.
Gamma Exposure (GEX)
* Key Levels:
* Highest Positive GEX (Call Resistance): $230 – Major resistance zone, where call option sellers may cap upward movement.
* Support Levels:
* $227: The 3rd CALL Wall level offering intermediate support.
* $226: HVL level aligned with GEX support zones.
* IVR & Sentiment:
* Implied Volatility Rank (IVR): 14.7 - Low IV, suggesting cheaper option premiums.
* GEX Sentiment: Positive skew with minimal PUT protection, indicating bullish sentiment overall.
Trading Plan
* Bullish Setup:
* Entry: Above $227 with volume confirmation.
* Target: $230.
* Stop-Loss: Below $226.
* Bearish Setup:
* Entry: Below $226 with high selling volume.
* Target: $224-$222 range.
* Stop-Loss: Above $228.
Disclaimer
This analysis is for educational purposes only. Always conduct your own due diligence and manage risk appropriately before trading.
$IWM Analysis, Key Levels & Targets for Today & TomorrowI'll dive into these levels a bit deeper tonight.
We opened at the top of the implied move and I got 229/230 bear call spreads filled at the top here... wooot
See you guys tonight!!

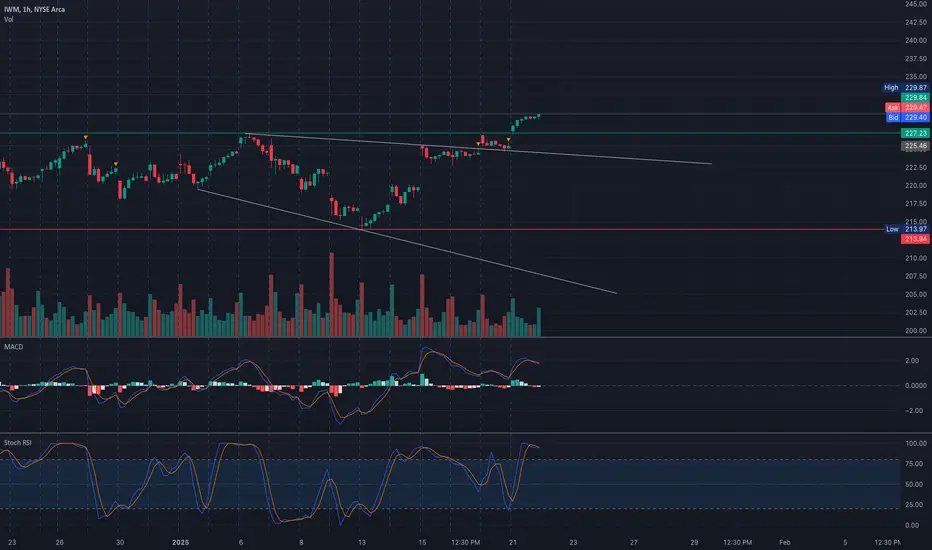
IWM Testing Key Resistance! Potential Breakout or Reversal AheadMarket Structure:
* Trend: IWM is in a short-term consolidation phase within a descending wedge pattern, suggesting a potential breakout setup. Price is hovering near the upper trendline resistance.
* Key Resistance: $227.09, marked by the highest positive NETGEX/Call Resistance.
* Support Levels: $224.00 (local support), $213.97 (major swing low).
Momentum Indicators:
* MACD: Showing mild bearish divergence, indicating a potential slowdown in momentum.
* Stochastic RSI: Currently trending lower from overbought levels, suggesting a potential pullback.
Volume Analysis:
* Volume is decreasing near resistance, which might indicate indecision among traders or a possible breakout awaiting stronger catalysts.
Gamma Exposure (GEX) Insights for IWM Options
Key GEX Levels:
* Major Call Wall: $227.00 (36% GEX concentration).
* Major Put Wall: $217.00 (1.05% GEX concentration).
Options Setup:
* Bullish Play:
* Buy Call: Strike $227, Expiry Jan 26.
* Target: $230, with stop loss at $224.
* Rationale: A breakout above $227 could lead to a test of $230, supported by strong call GEX levels.
* Bearish Play:
* Buy Put: Strike $225, Expiry Jan 26.
* Target: $222, with stop loss at $228.
* Rationale: Failure to break $227 could lead to a retracement toward $222, aligning with descending wedge support.
Risk Management:
* Keep position size small given the wedge pattern's potential for high volatility.
* Monitor price action closely near $227 for confirmation of breakout or rejection.
Actionable Suggestions:
* Breakout Traders: Wait for a confirmed close above $227 with volume before entering long.
* Reversal Traders: Watch for rejection at $227 and signs of selling pressure to go short.
Disclaimer:
This analysis is for educational purposes only and does not constitute financial advice. Always do your research and trade responsibly.

IWM Trade IdeaIWM short worked out well on Friday 1/18/2025. Going to try for it again this week.
Entry is right below the supply zone, the stop is right above it.
Target is the top of the gap.
My decision to enter or exit depends on price action.
KEY:
-White Horizonal Lines: Resistance levels (multiple timeframes).
-Green boxes: Supply or demand

$IWM Tomorrow's Trading RangeNo words tonight - just the chart for tomorrow. wild trading range here. Red signal line

IWM Testing Resistance! Key Trade Setups Ahead Analysis:
IWM is consolidating within a narrowing wedge pattern near the $224-$225 resistance zone. The stock is showing signs of a potential breakout or breakdown as it approaches the apex of the wedge. The MACD is neutral but trending slightly bearish, while the Stochastic RSI is in the mid-range, suggesting indecision among buyers and sellers.
Volume has been steady, with resistance near $227 and strong support at $222. A break above or below these levels will likely dictate the next directional move.
Key Levels to Watch:
* Resistance Levels:
* $225-$227: Strong resistance zone, aligning with the second call wall and positive GEX levels.
* $228: Extended resistance target.
* Support Levels:
* $223: Immediate support near the wedge’s lower trendline.
* $222: Key support level aligned with the highest negative GEX.
* $220: Extended downside support.
GEX Insights:
* Gamma Exposure (GEX):
* Positive GEX peaks at $227-$228, indicating significant overhead resistance.
* Negative GEX levels at $222-$220 provide critical support and signal increased volatility if breached.
* Options Activity:
* IVR: Low at 17, reflecting reduced implied volatility.
* Put/Call Ratio: Low put activity at 3.3%, indicating bullish sentiment is stronger.
Trade Scenarios:
Bullish Scenario:
* Entry: Break above $225 with strong volume.
* Target: $227 (first target), $228 (extended target).
* Stop-Loss: Below $223.
Bearish Scenario:
* Entry: Break below $223 with increasing selling pressure.
* Target: $222 (first target), $220 (extended target).
* Stop-Loss: Above $225.
Directional Bias:
Neutral bias as IWM remains within the wedge pattern. A breakout above $225 or a breakdown below $223 will confirm the next directional move.
Actionable Suggestions:
* For Scalpers: Focus on quick trades near $223-$225, watching for volume surges.
* For Swing Traders: Look for a confirmed breakout or breakdown from the wedge pattern before committing to a position.
Disclaimer: This analysis is for educational purposes only and does not constitute financial advice. Always do your own research and manage your risk before trading.

IWM ResistanceShort entry at the start of resistance. To enter or not depends on price action. Planned this trade using the daily chart. Target is the gap on the daily which also happens to be around were the 1hr 20ema is.

IWM Eyes Resistance! Will the Bulls Break Through?Technical Analysis Overview:
4-Hour Chart:
* Trend: IWM is recovering within a rising channel, currently testing resistance near $220.
* Indicators:
* MACD: Bullish momentum continues with a positive histogram.
* Stochastic RSI: Overbought at 88, indicating potential short-term consolidation or pullback.
30-Minute Chart:
* Price Action:
* IWM is consolidating near $220, just under key resistance at $221.
* Support at $218 has held steady, showing buyer strength at lower levels.
* Volume: Moderate, consistent with the ongoing recovery.
Key Levels to Watch:
Support Levels:
* $218: Immediate support zone, aligning with GEX7.
* $216: Secondary support, coinciding with the 3rd PUT Wall.
* $215: Strong support near the HVL.
Resistance Levels:
* $220: Immediate resistance, aligning with the highest positive NETGEX.
* $221-$223: Key resistance zone, highlighted by the 3rd CALL Wall.
* $227.5: Major resistance aligning with prior highs.
GEX Insights:
Key Gamma Levels:
* Positive Gamma Walls (Resistance):
* $220: Highest positive NETGEX and immediate resistance.
* $221: 24.67% GEX (3rd CALL Wall).
* $223: 3.14% GEX (2nd PUT Wall).
* Negative Gamma Levels (Support):
* $218: Support backed by GEX7 (7.71%).
* $216: Key PUT Wall support (-0.7% GEX).
* $215: Strong support with HVL alignment.
Options Metrics:
* IVR: 34.2, indicating moderate implied volatility.
* IVx: 29.3, close to average, suggesting stable conditions.
* Call/Put Bias: PUTs dominate at 6.6%, showing caution in the market.
Trade Scenarios:
Bullish Scenario:
* Entry: Above $220 with volume confirmation.
* Target: $221-$223.
* Stop-Loss: Below $218 to limit downside risk.
Bearish Scenario:
* Entry: Rejection at $220 or a breakdown below $218.
* Target: $216-$215.
* Stop-Loss: Above $221 to control losses.
Directional Bias:
* IWM's consolidation near $220 suggests bullish momentum, but the resistance zone at $220-$221 is critical. A breakout could lead to a rally toward $223 and possibly $227, while a failure to clear resistance may result in a pullback to $218 or lower.
Conclusion:
IWM is at a pivotal resistance zone near $220. A breakout could signal further bullish continuation, while a rejection might trigger consolidation or a retracement. Traders should closely monitor volume and price action for confirmation.
Disclaimer:
This analysis is for educational purposes only and does not constitute financial advice. Always conduct your research and trade responsibly.

SPY & IWM H&S Retest before LOWER?!AMEX:SPY AMEX:IWM
👏 BREAKOUT 👏 RETEST 👏 LOWER
This correction or crash looks inevitable at this point, got to go with my strategy and where the probabilities are pointing friends.
Can always change but it's not looking good.
Not financial advice

$IWM - make-or-break momentAMEX:IWM this is it. It's make-or-break time. If the 200DMA fails, we are looking at the $205 to $203 area.
Knowing that, would you play for a bounce here?

$IWM 5dte View AMEX:IWM 5dte View
210 - 224 for the week here
Clear down trend under the 30min 200MA
211 is an important level + that support gap above it - I’ll go over it in the video tonight.

$IWM Recap of Last week - 30min 200MA resistance - Under 50DMAFor times sake right now I’m going to just post this chart and I will be back to write a description later if it is even necessary. I just want a record of last week and how it played out before I move into the next days trading range. The week started at the red arrow And took a nose dive from there. 30 minute two under average is currently resistance and we’re trading pretty far underneath the 50 day moving average.
Let me know your thoughts on IWM

#IWM USA#IWM time frame 1 DAY
created a bullish Gartley pattern
entry level at 219 TO 217
stop loss 216
first target at 226.30
second target 232.36 up to 236.67
NOTE : this data according to time frame I DAY
Its not an advice for investing only my vision according to the data on chart
Please consult your account manager before investing
Thanks and good luck

IWM Technical Analysis & GEX InsightsMarket Structure Analysis:
* Current Trend: IWM shows a short-term ascending wedge pattern on the 4-hour chart, indicating a consolidation phase with upward bias.
* Support Levels:
* Key Support at $221.36: Significant level backed by Gamma Exposure (GEX) analysis indicating strong PUT activity.
* Critical Support at $217.84 and $216.70: These levels provide additional safety nets in case of a bearish breakdown.
* Resistance Levels:
* Immediate Resistance at $223: Corresponds to CALL wall activities with notable Gamma Resistance.
* Major Resistance at $227.41: An inflection zone coinciding with recent highs and GEX analysis.
Key Gamma Levels:
* Gamma Resistance:
* $223 (39.39% CALL Resistance): Expected to act as an immediate resistance.
* $227 (8.91% 2nd CALL Wall): A crucial level, challenging further bullish movement.
* Gamma Support:
* $221.36 (Highest Negative NETGEX PUT Support): This is the most substantial support level, critical for holding bullish sentiment.
Technical Indicators:
* MACD: Flattening near zero, suggesting potential sideways movement or preparation for a breakout.
* Volume Profile: Diminishing volume in the consolidation zone, often preceding a significant move.
Trade Scenarios:
1. Bullish Case:
* Entry: Above $223 with increased volume.
* Target: $227 (1st target) and $230 (2nd target).
* Stop-Loss: Below $221.36.
2. Bearish Case:
* Entry: Below $221.
* Target: $217.84 (1st target) and $216.70 (2nd target).
* Stop-Loss: Above $223.
Outlook:
* Consolidation within the wedge suggests indecision; the breakout direction will set the tone for IWM in the short term.
* High Gamma activity around $223 and $221 implies that these levels are pivotal for the upcoming price action.
Disclaimer: This analysis is for educational purposes only and should not be considered financial advice. Always conduct your own research and manage risk responsibly before trading.


IWM Facing Critical Resistance! Will the Breakout Succeed?
30-Minute Timeframe Analysis
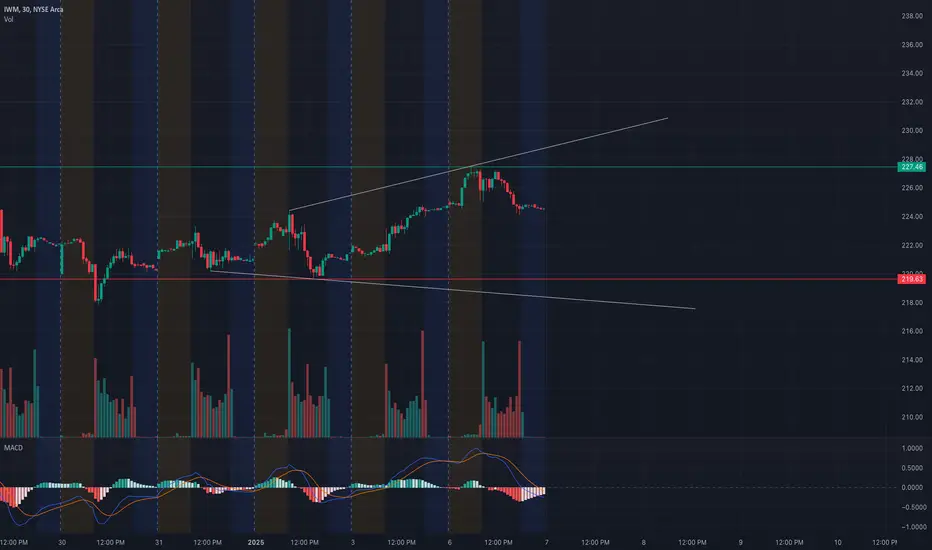
* Trend Overview: IWM has been trading within a rising wedge pattern, with recent resistance near $227.46 and support forming around $219.68. The price is showing signs of consolidation after a sharp move higher, indicating potential indecision. The market may gap up or down, which could disrupt this structure, so traders should reassess at the open and adapt accordingly.
* Key Levels:
* Support: $224.00 and $219.68 are important levels to hold if the price pulls back, especially during a gap down.
* Resistance: $227.46 and $228.00 are immediate levels to break for further bullish momentum, especially if the market gaps up.
* Indicators:
* MACD: Bearish crossover, suggesting a potential pullback or consolidation unless a gap up invalidates the signal.
* Volume: Decreasing volume near resistance signals caution; any breakout or breakdown needs to be supported by a surge in volume.
1-Hour GEX (Gamma Exposure) Insights
* Key Gamma Levels:
* Positive GEX: $225 and $227 are strong call resistance zones, with $225 being the highest positive gamma wall. A gap up could test these levels quickly.
* Negative GEX: $222 and $221 are key put support levels, providing protection in case of a gap down.
* Options Metrics:
* IVR: Low at 21.3, indicating a calm market environment, but potential for large moves remains if volatility spikes.
* Calls vs. Puts: Slightly bullish bias with calls at 1.1%, showing muted optimism.
* Actionable Gamma Zones:
* Bullish Scenario: Sustained price above $227.46 or a gap up could trigger a rally toward $228 and beyond.
* Bearish Scenario: A gap down below $224 may activate put support and drive the price toward $221.
Trade Scenarios
* Bullish Setup:
* Entry: Break and hold above $227.46, or after a gap up that sustains above $228.
* Target: $230.00 and $233.00.
* Stop-Loss: Below $225.00.
* Bearish Setup:
* Entry: Breakdown below $224.00, or after a gap down that fails to reclaim $225.
* Target: $221.00 and $219.68.
* Stop-Loss: Above $226.00.
Important Note for Traders
* Market gaps at the open can disrupt the current structure. Reassess price action during the pre-market session and adjust your plan to align with the updated conditions.
* If you need technical analysis for IWM or any other ticker, feel free to reach out for a personalized breakdown and actionable insights.
Disclaimer: This analysis is for educational purposes only and does not constitute financial advice. Please conduct your research and trade responsibly.