IWN Russel Index ETF ShortIWN on the reliable daily chart has been trending down for two in a descending channel as
shown on the chart with upper and lower trendlines drawn with the tool. The Stochastic RSI
oscillates in the interval between oversold and over bought and presently is well
overbought at nearly 100. Wh
Key stats
About iShares Russell 2000 Value ETF
Home page
Inception date
Jul 24, 2000
Structure
Open-Ended Fund
Replication method
Physical
Dividend treatment
Distributes
Distribution tax treatment
Qualified dividends
Income tax type
Capital Gains
Max ST capital gains rate
39.60%
Max LT capital gains rate
20.00%
Primary advisor
BlackRock Fund Advisors
Distributor
BlackRock Investments LLC
IWN delivers a portfolio of value stocks drawn from the Russell 2000, which represent the US small-cap equity space. The fund's large basket favors the smallest firms, with minimal spillover into midcaps, and typically carries a bit more risk and slightly less dividend yield. Unlike other value funds that use various metrics, IWN relies solely on price-to-book to identify value stocks. Overall, IWN offers solid value exposure to small-caps. Note: instead of replicating the index, the fund uses representative sampling indexing. The index is reconstituted annually.
Related funds
Classification
What's in the fund
Exposure type
Finance
Stock breakdown by region
Top 10 holdings

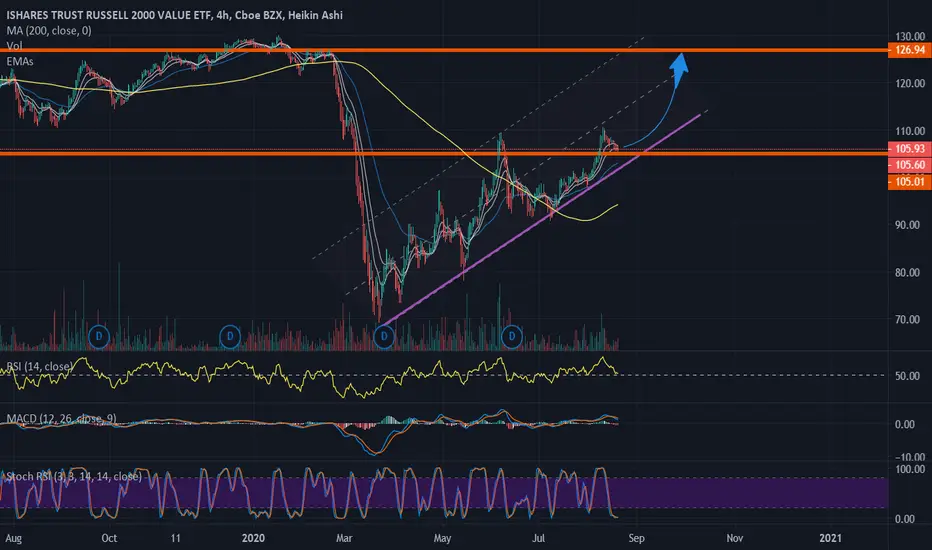
RUSSELL 2000 IWN is approaching a key levelIWN as shown on the weekly chart has been obviously in a downtrend as also shown by
the EMA ribbon.
Using the uptrend from the Covid crash into November 2021 and then a retracement from that,
IWN is approchaing the 38.2 Fibonacci level at 128
From there it could bounce up or continue the downtr

Sector Rotation from Small Cap Growth to ValueSector Rotation from Small Cap Growth to Value -
IWO: the Ishares small-cap Value ETF
IWN: The Ishares small-cap Growth ETF.
This chart plots the strength of Value vs Growth - if its trending Higher Value is in favor by the markets. If it's trending lower, Growth is in favor.

Price ActionFollow where the Price Action is going. I back tested and it works 85% reliable. Follow the trend and you'll get more winning result.

IWN option swing$165 calls for 8-20. Price Target $170. Looking good for a MACD cross above the 200 MA and parabolic sar showing

IWN - 10.50% Potential Profit - Swing Trade SetupGood risk / reward ratio on this trade.
Breakout past a 3-month correction.
- Target Entry: $167.50
- Target Stop Loss: $165.02
- Target Exit: $185.29
- Risk / Reward Ratio: 7.17
About me
- Note that I tend to adjust stop losses in order to secure profits early and preserve capital. This means th

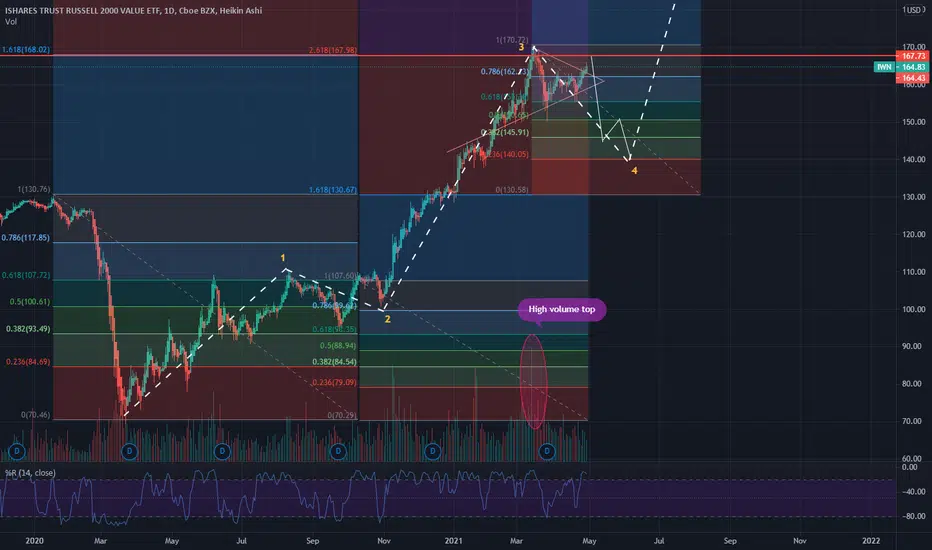
ABC downLooks like a head and shoulders top with a ABC down forming. IWN had a similar patter last June with a ABC down then - see chart. Not financial advice.


See all ideas
Summarizing what the indicators are suggesting.
Oscillators
Neutral
SellBuy
Strong sellStrong buy
Strong sellSellNeutralBuyStrong buy
Oscillators
Neutral
SellBuy
Strong sellStrong buy
Strong sellSellNeutralBuyStrong buy
Summary
Neutral
SellBuy
Strong sellStrong buy
Strong sellSellNeutralBuyStrong buy
Summary
Neutral
SellBuy
Strong sellStrong buy
Strong sellSellNeutralBuyStrong buy
Summary
Neutral
SellBuy
Strong sellStrong buy
Strong sellSellNeutralBuyStrong buy
Moving Averages
Neutral
SellBuy
Strong sellStrong buy
Strong sellSellNeutralBuyStrong buy
Moving Averages
Neutral
SellBuy
Strong sellStrong buy
Strong sellSellNeutralBuyStrong buy
Displays a symbol's price movements over previous years to identify recurring trends.
Frequently Asked Questions
An exchange-traded fund (ETF) is a collection of assets (stocks, bonds, commodities, etc.) that track an underlying index and can be bought on an exchange like individual stocks.
IWN trades at 159.84 USD today, its price has fallen −2.05% in the past 24 hours. Track more dynamics on IWN price chart.
IWN net asset value is 157.06 today — it's fallen 2.46% over the past month. NAV represents the total value of the fund's assets less liabilities and serves as a gauge of the fund's performance.
IWN assets under management is 10.82 B USD. AUM is an important metric as it reflects the fund's size and can serve as a gauge of how successful the fund is in attracting investors, which, in its turn, can influence decision-making.
IWN price has fallen by −2.75% over the last month, and its yearly performance shows a −0.76% decrease. See more dynamics on IWN price chart.
NAV returns, another gauge of an ETF dynamics, have fallen by −2.46% over the last month, showed a 6.05% increase in three-month performance and has decreased by −6.47% in a year.
NAV returns, another gauge of an ETF dynamics, have fallen by −2.46% over the last month, showed a 6.05% increase in three-month performance and has decreased by −6.47% in a year.
IWN fund flows account for −1.21 B USD (1 year). Many traders use this metric to get insight into investors' sentiment and evaluate whether it's time to buy or sell the fund.
Since ETFs work like an individual stock, they can be bought and sold on exchanges (e.g. NASDAQ, NYSE, EURONEXT). As it happens with stocks, you need to select a brokerage to access trading. Explore our list of available brokers to find the one to help execute your strategies. Don't forget to do your research before getting to trading. Explore ETFs metrics in our ETF screener to find a reliable opportunity.
IWN invests in stocks. See more details in our Analysis section.
IWN expense ratio is 0.24%. It's an important metric for helping traders understand the fund's operating costs relative to assets and how expensive it would be to hold the fund.
No, IWN isn't leveraged, meaning it doesn't use borrowings or financial derivatives to magnify the performance of the underlying assets or index it follows.
In some ways, ETFs are safe investments, but in a broader sense, they're not safer than any other asset, so it's crucial to analyze a fund before investing. But if your research gives a vague answer, you can always refer to technical analysis.
Today, IWN technical analysis shows the neutral rating and its 1-week rating is buy. Since market conditions are prone to changes, it's worth looking a bit further into the future — according to the 1-month rating IWN shows the buy signal. See more of IWN technicals for a more comprehensive analysis.
Today, IWN technical analysis shows the neutral rating and its 1-week rating is buy. Since market conditions are prone to changes, it's worth looking a bit further into the future — according to the 1-month rating IWN shows the buy signal. See more of IWN technicals for a more comprehensive analysis.
Yes, IWN pays dividends to its holders with the dividend yield of 1.85%.
IWN trades at a premium (0.02%).
Premium/discount to NAV expresses the difference between the ETF’s price and its NAV value. A positive percentage indicates a premium, meaning the ETF trades at a higher price than the calculated NAV. Conversely, a negative percentage indicates a discount, suggesting the ETF trades at a lower price than NAV.
Premium/discount to NAV expresses the difference between the ETF’s price and its NAV value. A positive percentage indicates a premium, meaning the ETF trades at a higher price than the calculated NAV. Conversely, a negative percentage indicates a discount, suggesting the ETF trades at a lower price than NAV.
IWN shares are issued by BlackRock, Inc.
IWN follows the Russell 2000 Value. ETFs usually track some benchmark seeking to replicate its performance and guide asset selection and objectives.
The fund started trading on Jul 24, 2000.
The fund's management style is passive, meaning it's aiming to replicate the performance of the underlying index by holding assets in the same proportions as the index. The goal is to match the index's returns.