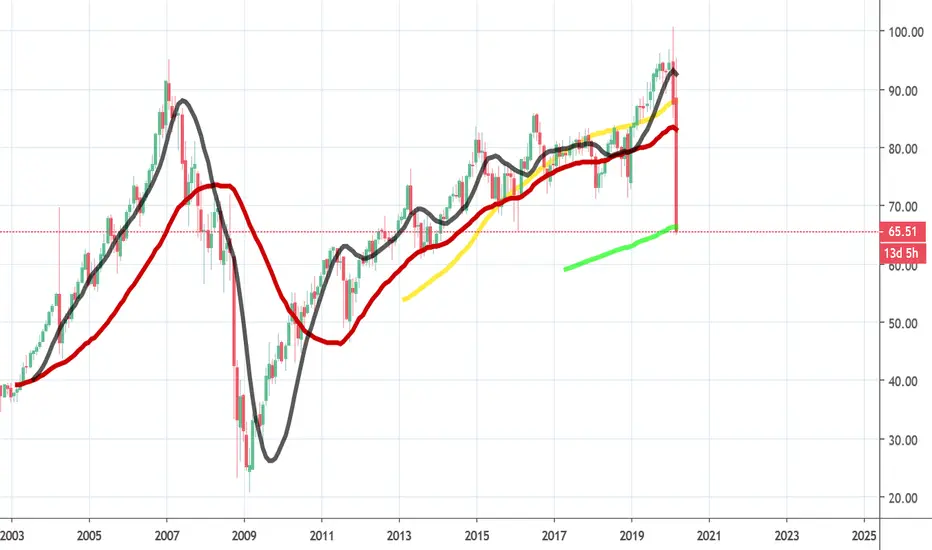
REIT etf year in review: O $92.57 H $100.75 L $56.27 C <=> $84REIT etf year in review:
O $92.57
H $100.75
L $56.27
C <=> $84
Do your own due diligence, your risk is 100% your responsibility. You win some or you learn some. Consider being charitable with some of your profit to help humankind. Small incremental steps work : If you double a penny a day for a month it = $5,368,709. Good luck and happy trading friends...
*3x lucky 7s of trading*
7pt Trading compass:
Price action, entry/exit
Volume average/direction
Trend, patterns, momentum
Newsworthy current events
Revenue
Earnings
Balance sheet
7 Common mistakes:
+5% portfolio trades, risk management
Beware of analysts motives
Emotions & Opinions
FOMO : bad timing
Lack of planning & discipline
Forgetting restraint
Obdurate repetitive errors, no adaptation
7 Important tools:
Trading View app!, Brokerage UI
Accurate indicators & settings
Wide screen monitor/s
Trading log (pencil & graph paper)
Big organized desk
Reading books, playing chess
Sorted watch-list
Checkout my indicators:
Fibonacci VIP - volume
Fibonacci MA7 - price
pi RSI - trend momentum
TTC - trend channel
www.tradingview.com
IYR trade ideas

IYR looking Bullish into 2021 - CVision TradingWe See IYR as Multi Quarter Swing Trade opportunity to be Bullish and Fade into the Wave B up Terminus.
We will keep you in tuned.

Real estate has to go up because of HyperinflationBeside Gold, Real Estate has been a good hedging tool for a Hyperinflation period like 2009.

Real Estate crash coming?It has been a long time since our last ETFs discussion. Today I have something to share. IYR (US Real Estate) is getting ready for a new decline. COVID is a real disaster for an offline business. Thousands of restaurants and other retail businesses have already closed and this number will be increasing. It is a dangerous sign. With that in mind, we can experience the start of a new decline in the USA commercial real estate in the coming 2 – 3 months. Once the destruction of earning levels reflects into the economic cycles, banks will tighten lending opportunities. That means the number of capable buyers will decrease at a time when home inventories may begin to skyrocket. Does it remind you of something? – It is very similar to what happened before the 2008-09 credit crisis.
Pay attention to the Case-Shiller data. It is showing home price levels had already exceeded 2006-07 levels. So, what do we have? – Extremely high price levels, combined with the uncertainty of future earnings, unemployment, a big number of closed retail businesses, falling consumer confidence, layoffs, etc. What result can we expect? Real Estate ETFs can decline another 30 – 50%. So, if you deal with USA commercial real estate, it makes perfect sense to hedge your risks. And active traders have another pending opportunity to get substantial gains.

OPENING (IRA): IYR AUGUST/SEPTEMBER 66/68 SHORT PUT LADDER... for a total of 3.00 in credit.
Notes: With rank/implied at 49/38, looking to re-up an acquisitional setup in this dividend yielder (3.36%) for the IRA.

THE WEEK AHEAD: ORCL, CCL, KMX EARNINGS; XLE, IWM, IYREARNINGS:
I'm not really seeing anything at the moment that meets my criteria for good liquidity, high rank/high implied to play this coming week for earnings-related volatility contraction plays.
While ORCL (53/44/9.8%) announces Tuesday after the market close, 30-day's only at 44 with the July at-the-money short straddle paying 9.8% of the stock price, which doesn't exactly get my motor running for a volatility contraction play.
CCL (47/142/31.6%) announces Thursday. It has the right volatility metrics and the July short straddle is paying a whopping 31.6% of the stock price, but most are playing this for a recovery from a coronavirus beat-down. For what it's worth, the July 15th 17 short put (19 delta; bullish assumption) is paying 1.17 at the mid price with a cost basis of 15.83 if assigned.
KMX (60/71/15.11%) announces on Friday morning, but isn't the most liquid thing in the world, with the July 17th 75/105 showing bid 3.60/mid 3.80/ask 4.00.
SECTOR EXCHANGE-TRADED FUNDS SCREENED FOR >35% 30-DAY:
XLE (55/61)
XLU (53/38)
SLV (51/38)
EWW (49/46)
GDXJ (49/63)
EWZ (45/61)
SMH (45/46)
GDX (45/41)
XOP (41/79)
USO (18/68)
Notes: I don't have any XLE on currently. The August 21st 32/48 (17 delta) is paying 1.76.
BROAD MARKET:
IWM (66/50)
EFA (42/36)
QQQ (41/34)
SPY (39/35)
Notes: If you're going to sell premium in broad market, small caps is probably the place to do it. Unfortunately, we're kind of mid-cycle here with July only having 34 days left in it and the August, 69, but if you're willing to go a bit longer with duration: IWM August 21st 113/159 (17 delta), paying 4.81.
DIVVY YIELDING EXCHANGE-TRADED FUNDS FOR THE IRA:
IYR (65/47)
EWA (57/44)
XLU (53/38)
EWZ (45/61)
HYG (45/26)
EFA (42/36)
SPY (39/35)
TLT (23/20)
EMB (23/18)
Notes: Pictured here is an IYR (3.51% yield) September 18th 65 short put paying 2.02 at the mid. I've been generally laddering out as an acquisitional play for the IRA, but July has only 34 days left, and there is currently no August (although there will probably be one post June opex), so a single September put would have to do.


Real Estate Questions Hi All,
I had originally created this video to answer a number of questions regarding real estate over at MERC but I think it can clear up my views on what my thoughts are on Real Estate over the coming years/decades.

SHORT IYR - low risk high profit scenario.Real Estate? Boom. IYR - major break in resistance. Momentum low, break in structure. Breakdown commin. This will free fall.

Real estate ETF has a lot to loseThis ETF went inside down on the week and at major resistance. It's a bonafide short although I rarely short the ETF itself and look for the weakest names held by the ETF instead. Just like the home-builders sector there is a major disconnect from the real economic reality and price here. The FED can pump the larger market ad infinitum but there will be huge reduced demand for real estate and homebuilding because people cannot get loans to build even IF they still have a job. This is the reality and it's not gonna change soon.
Ironically if I am correct and I profit from these shorts I will use that profit to buy some real estate in the inflationary cycle that is coming after all this washes out!!!

OPENING (IRA): IYR APRIL/MAY/JUNE 54/55/56 SHORT PUT LADDERYet another acquisitional setup in the IRA, filled for 9.38 total.
Notes: I already have some IYR covered calls in the IRA (3.50% yield), but figured I'd potentially add here on this brutal down move. I would note that markets are wide and had to nickel down or more to get a fill on the ladder as a unit. And we'll see how that goes ... .