JNK BreakdownIdea to track the breakdown in AMEX:JNK . Considering the rise in yields across the board, I am expecting one last dead cat before breakdown.
JNK trade ideas

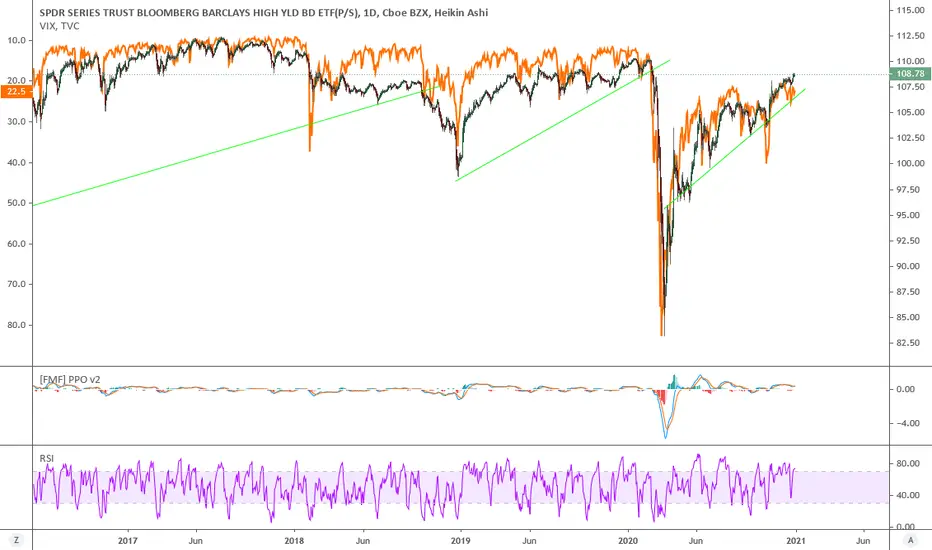
JNK is telling you: BE CAREFUL BUYING STOCKSJunk bonds are very important among risk assets, and they often send signals that anticipate what will happen to stocks. Seing the rejection at the all-important falling resistence, and the break of the rising trendline from last spring, one can't help but feel uneasy about the markets in the near to mid term... especially after a rally that's sucked EVERYBODY in, and going into a notoriously treacherous month like March. Continued weakness in JNK would strongly confirm the idea of entering opportunistic shorts on stocks and indeces. This one for me is on the front burner.

Weekly Leading Indicators Part IThese are my first set of market leading indicators, namely, JNK, IWM, DJT and VALUEG.
Slightly confusing and not yet totally aligned;
JNK and IWM have weekly candlesticks that are reminiscent of a top bearish reversal pattern, such as the Dark Cloud Cover, observed.
DJT MACD has a bearish divergence.
Nothing super obvious here... just a couple of early red flags at best.

JNK/TLT is screaming SHORTY RTY!JNK/TLT is my favorite indicator I have found. It tells me when to go long and when to short. And right now short RTY is probably the best short of the century. the green line has been an indicator of shorting rty I am going to start to build a position in RWM and will be planning to hold it for a large correction to becoming in RTY.

Leading Indicators gone bear... here we goNo need to say much as previous;y mentioned about the bearish divergence.
Looking at the panel again just adds confirmation of how bearish a turn it just had.
Some decent downside will follow...

Leading Indicators divergent - a subtle warningJust want to highlight that the first panel of leading indicators are bullish like hell, and are also obviously bearishly divergent having MACD crossed down in the DJ Transportation Index, with the rest weakening significantly.
First warning shot...

Leads telling that equity markets (S&P500) are in trouble!A scan of my leading indicators show that 4 out of 4 have topped out and are in clear reversal/retracement mode. Candlestick patterns and technical indicators suggest so.
While this is happening, we see more all time highs being clocked on seasonally low volumes.
Clearly something is amiss and divergence is about to converge...
CAVEAT EMPTOR!


Market Pairs TradingHow to play this divergence in corporate bonds vs market. The best way I think of is Pair em up.
1. Buy QQQ and Sell HYG
2. Buy SPY and Sell JNK
They will have to converge and even out.


SteadyJNK did not show real weakness, could indicate the equity market is just taking a breather. Keep it on your radar.


GoNoGo Charts sees investors embracing riskOften used as a proxy for risk, the trend in the ratio between junk bonds and treasuries can be very informative.
The GoNoGo Trend indicator shows that during the month of May, the ratio was able to battle out of the “NoGo” trend that it had been in since the end of January.
This ratio tends to lead stocks as it did when it signaled investors to be “Risk off” at the end of January.
Interestingly, stocks rallied so quickly out of the lows in March that the JNK/TLT ratio flagged “Go” later than stocks.
This tells us that investors were slow to accept that the rally was as strong as it has been.
Long term, looking at a weekly chart, the GoNoGo charts show risk is still “Off”, with the GoNoGo Oscillator riding the resistance line from below.


High Yield Bonds (JNK) at Major ResistanceJNK has stalled at major resistance. The current trend is down so a reversal here should be interpreted as a resumption of the prevailing trend.

Big picture idea... JNKWhen all the $trillions of BBB corporate credit gets downgraded to junk... many if not most large institutional investors will have to sell (due to their bylaws) because they're not allowed to own junk. Wait for repricing to occur and buy the junk for pennies on the dollar.

$JNK Well that break above didn't last very long. Failed during the breakout on this one. Sold down very quickly.


Short Junk BondsBearish MACD and RSI divergences, coupled with unusually high put option order flow. I'd set this as a longer term trade, with puts expiring March.

$spy The junk bond chart should concern you $jnkIf we see this pattern break down it would target 103. See 2018 break down for comparison

$JNK still far below the trend line.Filled in the gap that was left above, some ok green volume lately, but be cautious still.
