$JNK Needs to keep above that lower trend line to stay bullish.Watching this closely, this bottom trend line is being tested, will the hammer push it back up?
JNK trade ideas

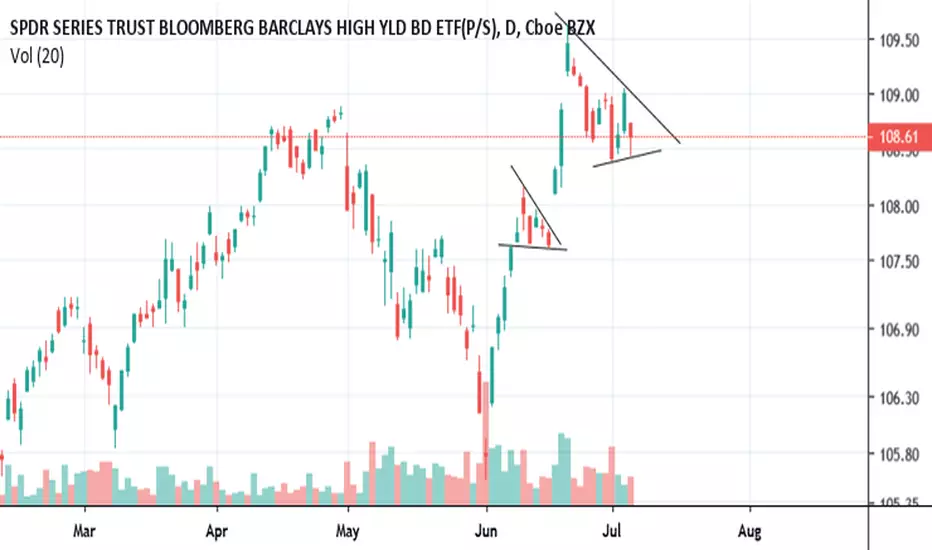
$JNK First wedge broke out, let's see what this one does.Watching to see if this larger wedge breaks out, nice hammer on bottom.
JNK, High Yield Bonds - SPY studyThe comparison shows a high correlation between junk bonds and equities. The last Friday’s rally sparked by NFP and the news related to AMZN moved the equities ahead of the junk bonds. What we need to see next week, whether the junk bonds are going to retest the broken trend line first or start a continuation to downside. It seems the AB-CD pattern is not completed. If this is the case we could see a pullback in SPY too.
05/05/2019


Short Junk BondsThis nonsense put up all time highs on daily RSI today. When junk bonds go, everything will go... (down, of course)

JNK / W1 : Overbought & Divergent... Risk down the corner ?NOTE : The low risk trading area reamains higher in the context channel (the gray ribbon) but we're signaling overbought on the trendchannel... This may be a concern if the market reverses here... Cause reversing on trendchannel means there will pbly be a trend trade to come right after... Not the best case scenario for stock though if junks were about to break down the major support trendline.
SIDE NOTE : Some analysts say that there is a dangerous bubble in corporate credit... So this may add to the technical view seen here. If anything goes wrong in the sector, junks may be the first to show signs of tension...
CONCLUSION : It's not something to trade just like that, more likely something to bare in mind for the coming months... as a potential systematic risk trigger that could cause hell of a panic wave...
Hope this idea will inspire some of you !
Don't forget to hit the like/follow button if you feel like this post deserves it ;)
That's the best way to support me and help pushing this content to other users.
Kindly,
Phil

SPX v JNKSPX - Stocks run rich to JNK - Junk Bonds and then the correlation re-couples. This tends to indicate a short term bottom in stocks has been reached.

Recession Indicator ChartA combination of collated charts I'll be updating as predictors of an impending recession. If these charts aren't screaming look out I don't know what is. Currently looking for decent CDS (credit default swaps) data to add to the mix.
Credit to @GetBusy88 for LQD/HYG

Too weak from bond market Slower economic growth and higher interest rates lead to weaker performance in #JNK

$jnk $spx JNK paying a high dividend but failing below supportNot a bad one for the retirement account paying an almost 5% dividend. Potential buy here if can get above support.


JNK Bonds looking like a significant bottomThis is the second week in a roll solid inflows into corporate bonds. This is a bullish indicator for the broad markets. I used 2 weekly charts with different indicators. This is not leading the market lower which it should be.

Junk Debt Again at Very Attractive Levels to ShortPerhaps this is another dead-cat bounce?
These custom support resistance indicator lines show decent places to enter or exit.
The Blue indicator line serves as a Bullish Trend setter.
If your instrument closes above the Blue line, we think about going Long.
If your instrument closes below the Red line, we think about Shorting.
For Stocks, I prefer to use the Yellow line as my Bearish Trend setter (on Daily charts).
Find out more. Send Private Mail (PM) to @MasterCharts

Junk Bonds: Is this a Bearish Break? Weekly Close Now ImportantNote that this instrument is now trading below the Red Support line. In the past, such breaks, on several occasions were accompanied by a sell-off in risk assets, such as stocks.

Caution need with SPX500!!This is one chart worth watching . I overlayed SPX on JNK bonds. JNK bonds are breaking down. If you look at the overlay of weekly chart, SPX is making all time highs every few days and Junk bonds did not move much. Now chikou is below price and daily chart is bearish. Macd has been diverging for a while. The divergence is going on forever and one or the other will catch up. Not saying that you should cherry pick the top and short it right away but be cautious. If you are long, trail stops . We are long due for correction.
Shanghai composite is showing some signs too and yield curve on far end is kind of flattening. VIX has been pinned down like no tomorrow . Another divergence worth noting is in USDJPY and Nikkei. You can see it by overlaying chart. FTSE is also breaking down.
December FOMC meeting is a big one. Market already knows that there is going to be a hike but its all about forward guidance from here. Keep an eye on 2y and 10y yields and gold. There will be plenty of opportunities when the time comes.
Thanks for the read.

Important support levels for #junk #bonds ..Teal and Yellow lines now may act as future support. $JNK $HYG #Trading #investing


JNK - Dip below 200MA has recovred past 5/5 timesThe past 5 times JNK has dipped below its 200MA it has recovered. Also has support from trendline.

JNK: Junk Has Never Smelled So Good.. Really ??With the backdrop of economic expansion, loose monetary policies and positive sentiment among investors, huge amounts of money flowed into corporate bonds.
To be exact, high yield "Junk" corporate bonds.
The EXIT door might be too small for these investors if there is a mad rush for the exits.
Prices have completed a textbook a-b-c retracement since its low in 02/2016.
The final c wave has evolved in the form of an Ending Diagonal.
The initial down wave has completed and is in the final phases of upward retracement.
A strong and incisive break down from current price will confirm the completion of the retracement.
A break above micro wave ((5)) at $37.46 could hint that the Ending Diagonal is not complete or other patterns are forming.

JNK/EEM BUY 0,80-0,81 AREABUY JUNK BONDS SELL EMERGING MARKETS
LIMITED RISK , HUGE RRR, LONG TERM BOTTOM LINE AT 0,81

JNK bond bubble, what bond bubble, oh that oneSee chart. Note the timing in cycle days between the last one and this one, and all of them actually, surprisingly similar, wow what a cycle. Exactly the same, if we of course break down now. Equities have to bow to this leader. Our vix bottom indicator is actually below the extreme levels of past bubble bursts. No where to go but down (chart), and up on the indicator.
