JNUG – Looking to Breakout of WedgeChart Details
Long consolidation wedge ready for breakout. Caution with gaps above and below.
World events and monetary policy tell me this goes higher.
Next Daily trend is Bullish. Weekly trend already Bullish and turned up.
Weekly RSI trend is our guide for stop.
Price target $100
Stop $74
About Me
www.moneypatterns.com
Options Strategies, Video Technical Analysis, Instant Alerts, Specific Options Order Entry Details, Daily Updates, Equities & Crypto, Weekly Breakdowns, Charting Service, & More in Members Area!
Thank you for liking, commenting, throwing up a chart, following, or viewing.
I am not a financial advisor. My comments and reviews are based on what I do with my personal accounts and on www.moneypatterns.com
JNUG trade ideas


HARD COMPLEX WAVE ESTRUCTURE IN THIS BULL GOLD MINNERS 3X ETF NOW IN FALLING WEDGE FINISHING CORRECTIVE STRUCTURE IN THIS BIG TREND THEN FOR BULL POWER MOVES.

JNUG - Short Term BullishI AM NOT IN THIS TRADE
Per request, here is an update for JNUG
I do think that gold and gold ETF's will turn bullish if general market turns down.
Each person has their own preference for Gold ETF's (if they use them).
I prefer GDX for price and pattern.
Chart Details
Price broke out of blue wedge and then yellow triangle as expected. See last chart.
If JNUG breaks most recent ATH around $100, this can indicate a new pattern.
More analysis/data is needed at $100 to see how price reacts.
Let me know if you need update later. I will help if I can. :)
Entry Options
If I was already entered, I would hold and would be watching $110 for possible exit, or stall of price. Should go up to fill gaps.
If I am not entered, I would look to enter long at lower gap fills or return to 10WeekMA.
About Me
Thank you for liking, commenting, throwing up a chart, following, or viewing.
I am not a financial advisor. My comments and reviews are based on what I do with my personal accounts.
I am transitioning to my new website www.moneypatterns.com and have updated my name previously jbird7839. Same guy - new name. :)
Website will be ready for launch mid-January 2020. Thank you for your patience while I try to juggle everything and maintain the same standards.
Disclosure - I am long BTCUSD, GBTC. Short term GDX Bullish, SPXS Bullish
Previous JNUG Chart

JNUG: Bye Bears: JNUG to $130.00What I called back in mid November has came to fruition:
Gold is finally gearing up for its 'true bull run'. What we saw this year was a premature run based off USA-China trade, however now, we will start to see the real bull in the making.
A re-test of 155-1560 is very likely before between late January and early February with new multiple year records thereafter.
2020 will be a fantastic year for Gold, Silver and Platinum.
Don't forget about Platinum! PPLT (etf: bullion) and Impala Platinum (IMPUY) are the top Platinum picks.
- zSplit


$JNUG Is A Great Way To Play $GLD #GOLD ReboundWe have been bullish on $GLD and gold miners for the past year now. We believe the current pullback represents a great buying opportunity and $JNUG is a great way for aggressive investors to play the Gold bull market.
Based on just fibonacci retracement, we can see $JNUG easily bouncing to $63, $70 and $77 in the short-term. Although, we still believe the highs are not in for $JNUG or for Gold and Silver.
Direxion Shares ETF Trust - Direxion Daily Junior Gold Miners Index Bull 3X Shares is an exchange traded fund launched by Direxion Investments. It is managed by Rafferty Asset Management, LLC. The fund invests in public equity markets of global region. The fund invests directly, through derivatives and through other funds in stocks of companies operating across materials, metals and mining, gold, silver sectors. The fund uses derivatives such as futures, swaps to create its portfolio. It invests in growth and value stocks of companies across diversified market capitalization. The fund seeks to track 3x the daily performance of the MVIS Global Junior Gold Miners Index. Direxion Shares ETF Trust - Direxion Daily Junior Gold Miners Index Bull 3X Shares was formed on October 3, 2013 and is domiciled in the United States.
The investment seeks daily investment results, before fees and expenses, of 300% of the daily performance of the MVIS Global Junior Gold Miners Index.The fund invests at least 80% of its net assets (plus borrowing for investment purposes) in financial instruments, such as swap agreements, and securities of the index, ETFs that track the index and other financial instruments that provide daily leveraged exposure to the index or ETFs that track the index. The index includes companies from markets that are freely investable to foreign investors, including "emerging markets," as that term is defined by the index provider. It is non-diversified.
As always, trade with caution and use protective stops.
Good luck to all!


JNUG - Daily View - Part 2 of 2Someone asked me to chart JNUG . Here is the outcome.
Please see the JNUG - From Outter Space - Part 1 of 2 chart at bottom of page for longer view.
I am not currently in this position. THIS IS NOT READY IN MY OPINION - BUT CLOSE
Daily view confirm bullish pattern correction incoming.
Blue wedge is bullish pattern by itself.
RSI trend confirms breakout should occur.
Trend filter dots confirm bullish trend is next.
If I were playing this trade, I would wait for price to fill tip of blue triangle.
If it breaks into bottom gap, add to position partially.
If further breakdown into far bottom gap, add rest of entry.
If no breakdown into bottom, your choice to add at blue wedge breakout or wait for confirmation at yellow wedge tip.
Further analysis is needed as time progresses to see possible outcomes.
Thank you for liking, commenting, throwing up a chart, following, or viewing.
I am not a financial advisor. My comments and reviews are based on what I do with my personal accounts.
Disclosure - I am long MARA, GBTC, BTCUSD, GDX, VIXY.
Short SPY and AAPL.
JNUG - From Outter Space - Part 1 of 2

JNUG - From Outter Space - Part 1 of 2Someone asked me to chart JNUG. Here is the outcome.
View is 9D chart.
I am not currently in this position. THIS IS NOT READY IN MY OPINION - BUT CLOSE
We see a downtrend of blue patterns inside a yellow wedge.
The yellow wedge overall is bullish with the bottom support being upward sloping.
Inside the yellow wedge at the point, are two blue wedges.
These two blue wedges are bullish in formation. Current price action suggests bullish breakout.
There are price gaps above and below current price action.
Gaps above and below price means we need to see a clear breakout before entry to either side for confirmation.
RSI trend is very interesting.
We have predictable pattern currently with downtrend possible for next few weeks.
Appears to be entry upcoming based on RSI pattern.
Trend filter dots confirm bullish trend is next.
Thank you for liking, commenting, throwing up a chart, following, or viewing.
I am not a financial advisor. My comments and reviews are based on what I do with my personal accounts.
Disclosure - I am long MARA, GBTC, BTCUSD, GDX, VIXY.
Short SPY and AAPL.

JNUG: Last Legs of Corrective Phase; Then Up We Go!Gold has undergone a medium sized correction and has remain suppressed for the last few months. What is positive for the Gold bugs is that many of the top performing stocks have actually made yearly highs except for some of the more overbought mid-tier and seniors.
JNUG is on the last stands of its corrective value and will likely consolidate in the $52-58 range on average for the next 2-3 weeks before steadily rising new to yearly highs to the 120-130 level through mid Q1 2020. While a touch just under 50 or just over 60 levels are possible, the average will remain as stated.
Investors should avoid leveraged funds as based on simple math, they decay towards 0. In addition, many of the stocks "included" in the etf distributions here are heavily induced by short interest.
For investors that are more conservative but looking for growth, I recommend FNV and KL.
For investors that want some risk, I recommend stocks with upside potential such as GCM, GORO and IMPUY which happen to be my three favourites.
For investors that want to be exposed to a potential winner and speculative, I will direct your attention towards AGG. AGG is in my opinion, one of the very few highly speculative juniors that will likely be a winner in the upcoming Gold run.
- zSplit


JNUG, in accumulation Area.Hi,
JNUG in speculative accumulation area. The contraction that started in August is close to be finished, the accumulation area is showed in Green color.
Price touched the area and was rejected, seems it is creating a resistance in $53, this could be this end of contraction wave.
Confirmation is above $60
- Target 1 is at $103, this represents +90% of opportunity
- Stop bellow $44.5
- 3.7x Risk/Reward ratio

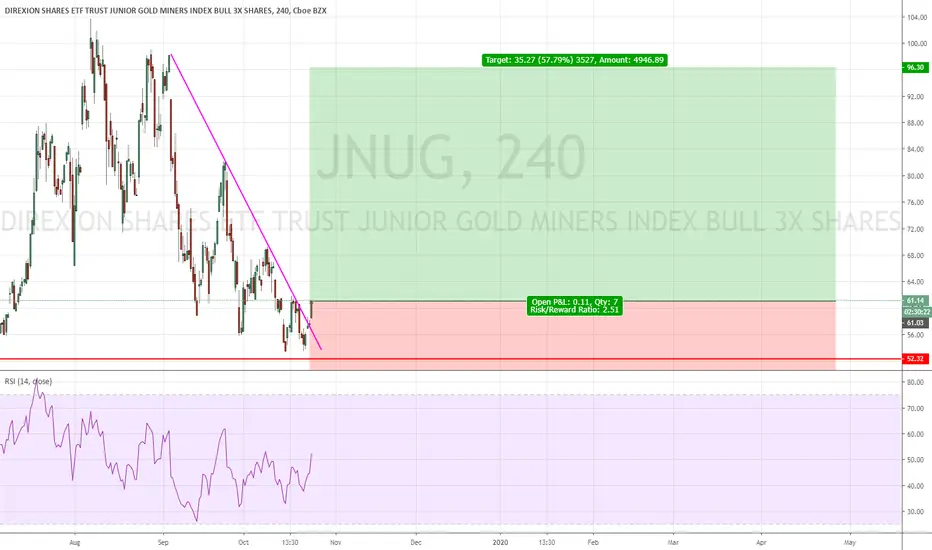
JNUG Falling wedge. Opportunity for 18% in 10 daysJNUG has been making lower lows for the past 3 months but a support has revealed itself at about $54. At the end of the wedge is a possible breakout which is most likely to be a bull run based off of the last breakout about 5 months ago.

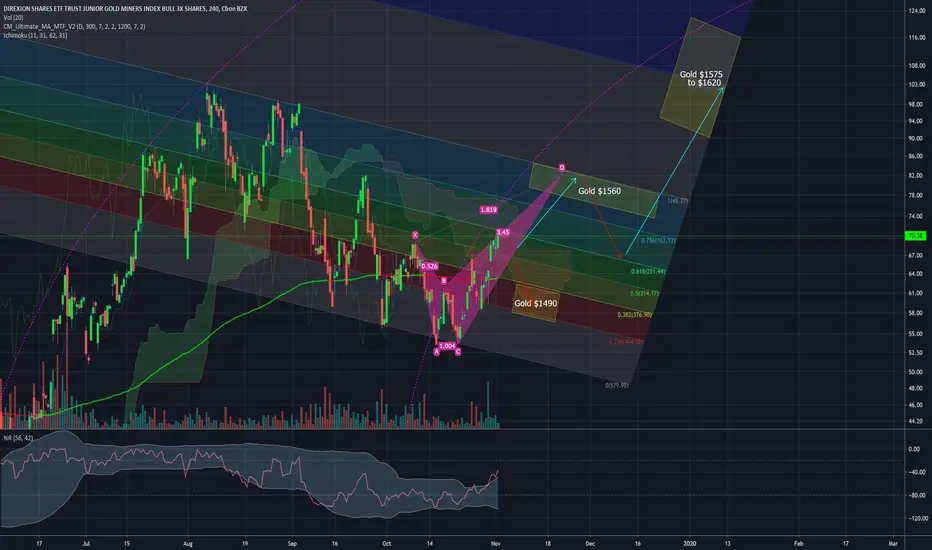
Target for $JNUG at different $gold spot prices $GDX $NUGT $GLDThe ascending triangle in the gold price displayed here:
Has produced a double bottom and bullish XABCD pattern displayed above in pink on the $JNUG chart.
A return to the recent highs will likely send $JNUG back into the $76 to $83 range.
Gold is, momentarily, no longer inversely correlated with the stock market. Negative real interest rates globally and the inverse correlation with USD is now the primary driving force in the price of gold.
Lower interest rates and (not QE ) QE are repricing the US dollar against major world currencies and gold:
Great potential buy on JNUG for 50% ReturnJNUG shows a bull flag with a potential 50%+ return due to the U.S. market being overextended / overbought. Great risk / reward buy for JNUG.


Watch JNUG for a trend line breakThe junior gold miners' leverage ETF has been making a long-term downward trend line since September as the dollar showed strength and gold showed weakness. Surprisingly, gold and JNUG have stayed in their downtrends despite dollar weakness throughout the month of October.
That's presumably because the dollar index, now at 97.48, has a support trend line around 96.86. Gold and JNUG will break upward out of their downtrends if the dollar breaks downward through that support.
It probably won't happen before the Fed meeting, although conceivably it could. Futures traders are pricing the probability of a Fed rate cut at 94%, and yesterday's headlines included "The Fed Just Printed More Money Than Bitcoin’s Entire Market Cap." The dollar is up today, but only because it's making a technical pullback from oversold territory. I expect it to touch its support line soon.
Assuming the futures markets aren't completely out to lunch, we should get a rate cut next Wednesday and then our breakout should come.

This is one of the prettiest weekly charts I've seen... JNUGMassive, textbook 2x bottom with equally symmetrical tight consolidation into a major trend reversal confirmation... Look at that volume....
Major target levels:
$124 and $170
Minor target levels:
$72, $82, $89

