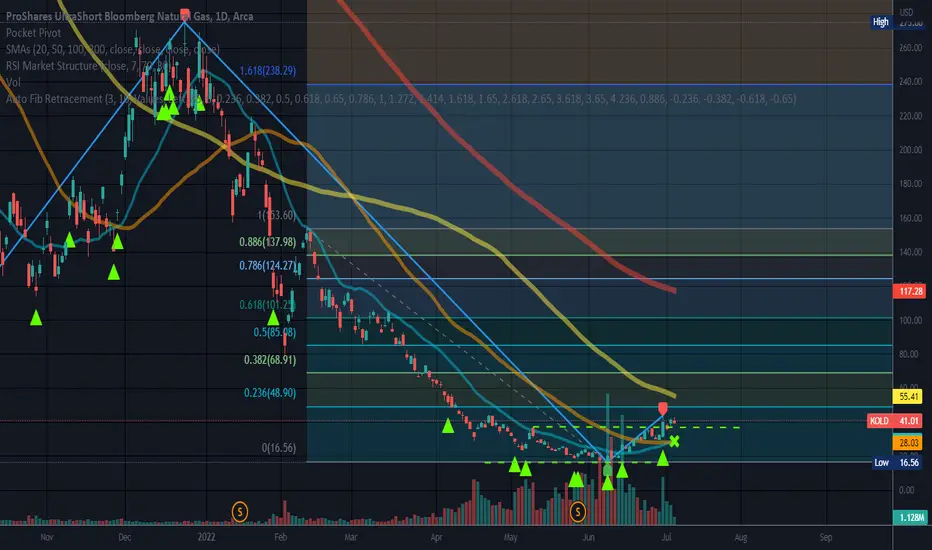
$KOLD in a selling climax? Sometimes trend ends in a selling climax, meaning on a relative huge volumes. To my opinion it is clear only when the trading tool is rebounded later. So now, just a question mark ❓️
No investment or any other advice is here.
KOLD trade ideas

KOLD is petty HotKOLD (gas short 3x) seems like an nice straight forward Elliott set up, scale in you position over time, (gas can bounce before it gets started) good 100% potential gain.
GAS is volatile so Please do NOT use margined and don't bet the farm or the kids. Don't Gamble GAS should be just one average size position of the many. (use risk management)

KOLD: Potential Reversal Play Near Demand ZoneInstrument: ProShares UltraShort Bloomberg Natural Gas (KOLD)
Timeframe: 4H Heikin Ashi
The ETF has been in a downtrend, characterized by a descending trend line connecting the lower highs.
Recent price action suggests an early breakout above the descending trend line, signaling a potential shift in momentum.
Stochastic RSI also shows oversold conditions with a bullish crossover forming, indicating momentum may favor an upward move.
Sector Rotation:
Recent trends suggest the energy sector is undergoing a sector rotation as market participants focus on cyclical and value stocks, especially in commodities like natural gas. This aligns with a potential upside for KOLD in the short term.
Trump Policy Influence:
With renewed attention on energy policies influenced by Trump's stance on energy independence and deregulation, investor sentiment in the energy sector is expected to shift. This policy backdrop could provide additional momentum for a bullish move.
Entry: ~ $33.72
Stop Loss: Below $26.70 (demand zone distal line).
Targets:
$34.01 (short-term target, RRR ~2:1).
$42.79 (mid-term target, RRR ~4:1).
$48.68 (long-term target, RRR ~6:1).
Position size: Risk no more than 1–2% of account balance per trade.
Supply Zones:
Supply Zones identified at $42.79, $48.68, and $63.22, providing potential take-profit areas for bullish trades.
A major resistance at $78.83, marking the upper boundary for a long-term bullish trend.
Demand Zone:
Significant Demand Zone in the $26.73–$27.78 range, a critical area for potential price reversal .
Disclaimer:
This idea is for educational and informational purposes only and does not constitute financial or investment advice. Trading involves significant risk, and past performance is not indicative of future results. Always do your own research and consult a licensed financial advisor before making any trading or investment decisions. You are solely responsible for your actions and decisions.

KOLD (from $57.85 to $64)MODs have suggested that I provide more detail about the picks I make.
Sorry. I'm not as verbose as y'all, and I don't like things to be complicated.
My trading plan is very simple.
I buy or sell at top & bottom of parallel channels.
I confirm when price hits Fibonacci levels.
Bonus if a TTM Squeeze in in play.
I hold until target is reached or end of year, when I can book a loss.
So...
Here's why I'm picking this symbol to do the thing.
Price at bottom of channels
Stochastic Momentum Index (SMI) at oversold level
VBSM is negative
Impulse MACD is crossing over to the downside
Price at near Fibonacci level
In at $57.85
Target is $64 or green channel top

MAY 30 MEMBERS DAILY ANALYSISMega cap tech saw massive selling.
MSFT & NVDA hit hard today. Cloud based stocks under pressure.
Small caps ripping!
Natural Gas collapse...Profits secured! KOLD
Weak GDP & Housing data send yields lower.

KOLD triple leveraged inverse ETF for Natural Gas LONGKOLD on the 15 minute chart shows a prior uptrend followed by a large falling wedge pattern
from which in broke out then to form another smaller falling wedge. Anchored VWAP bands are
added showing price is now just above the support of the mean VWAP line also confluent
with the Fibonacci retracement of the uptrend of the first 20 days of February. The RSI
indicator shows relative strength low and less low time frame lines near to the 50 level.
I see this as an excellent setup to take a long trade in KOLD with the target and stop loss
on the chart looking to capture 15% upside.

KOLD Natural Gas Pivots Again LONGKOLD on the 15 minute chart has reversed and swung upside. The the anchored VWAP price
dropped through the mean VWAP and is now in the deep undervalued territory of the second
lower VWAP band line. This is an oversold zone for buying. On the chart, a green arrow is a buy
while a red arrow is a sell. New share buys are funded with profits from BOIL positions
now closed. Relative volatility and volume indicators support the analysis.
I will add further to the position whenever there is an entry provided by a correction found
on a lower time frame of 3-10 minutes.

BOIL vs KOLD Natural Gas Leveraged ETFs : LONG KOLDThe KOLD / Boil Ratio is shown here on a daily char. A rising ratio level indicates KOLD is rising
and BOIL is falling making the ratio rather extreme If KOLD rises 10% in a week and so BOIL falls,
in a hypothetical say they start out 140 and 20 respectively and KOLD goes to 154 while KOLD falls to 18 the ratio moves from 7 to 154/18 = 8.55 the ratio moves 22% for the week.
What does this all mean ?
With triple leveraging and management fees taken out long leveraged ETF shares may experience time decay on a daily basis. Share values are net after expenses.
From the chart's visible the only time the ratio fell and BOIL was the long play was
September 25,'23 to November 15, '23 and December 14, '23 to January 14, '24.
In 2023 prior to late September KOLD was always the long play, In 2024, after January 15
and to the present KOLD is the long play and the ratio is accelerating and getting more
volatile as it is potentially getting over-extended. Combined volume in the range of 20 M /day
is 2X showing great interest by market participants.
I conclude especially since natural gas spot prices are falling as recession fears are not yet in the past, that KOLD is the leveraged gas futures ETF to take long. This trader considers the
management fees as a cost of business. The futures are stratified and leveraged obivously
the cost brings value.
I will take shares of KOLD and take a call or two along the way for an expiration in the fall
whenever price rises about an even $5.00 amount to be assured of the lowest price.
I will follow KOLD on a 60-90 minute chart looking for topping wicks or a price fall under
the EMA 7 as a sign that it should be on watch for a market top. Frankly, I do not expect to see it. This is because on the 2-time frame RSI indicator ( by Chris Moody) with the 4H in green
and the 1W in red, both lines are rising and in a healthy 75 +/- range. If they top out and fall, then I again think I might be seeing bullish divergence and put the trade on watch.
For those who trade VWAP bands and volume profile, the ratio has been in an obvious breakout since early November with a pullback in mid-December after the ratio rose outside the third upper VWAP band. Using the VWAP bands and the volume profile will make any fades very obvious most especially on lower time frames.

KOLD and BOIL will no longer screw me, I am the destroyer of GASI have been buying BOIL too early and selling it too soon and never really thought about playing both sides with KOLD until now.
I plan to use one of my accounts to test out this hypothesis over the next couple of months until the recession hits or yields actually peak.
I expect bond yields to have a pause the next two weeks. I plan to sell my TLT and TMF positions then. This will be a fake out and get many people to ape into TLT and TMF.
I believe yields will continue to rise and Yellen will continue to sell into this blow off bottom of bonds.
Look at stockcharts.com stockcharts.com
The seasonality shows that KOLD finishes up on the month 100% in December and 75% of the time up on November.
The opposite is true with BOIL so I plan to sell my KOLD a little early and buy BOIL at its bottom
stockcharts.com
Flip to BOIL for Jan/Feb and back into KOLD for March. By then TLT should be pumping and yields should be coming down sharply. After that is back into BTC miners

$KOLD one more leg up? Short Natural gas for 100% gain?Really liking the look of the AMEX:KOLD chart.
We've largely been in sideways consolidation since early February and with the recent test of the bottom of the structure, KOLD looks poised to move higher.
I bought throughout the day today with the average entry at $61.23. I'm looking for around 100% move to the upper resistance.
Risks:
- A reversal that goes through the bottom support of the structure
- 1 more retest of the bottom of the structure before the real move starts (if that happens, I'd be looking at price action having a tough time making it through $72 leading to a reversal).
Reward:
Upside 100% with an exit at $123.29

Rising Wedge on $KOLDBearish rising wedge on AMEX:KOLD , with a doji candle on the close. Closed on previous support, Looking for support to turn into resistance as NATGAS bulls reclaim momentum.

KOLD levelsKOLD ProShares UltraShort Bloomberg Natural Gas is two times the inverse (-2x) of the daily performance of Natural Gas. KOLD is a short of an index of natural gas futures contracts. It reacts slightly different than shorting the spot price of natural gas. Natural Gas is often referred to by traders as the “Widow Maker” because of its hyper-volatility compared to other assets. The commodity has had wild swings the past two years especially.
I'm posting this as a long KOLD, which means a short on Natural Gas from 2.8usd/mmbtu. However, if Natural Gas breaks this 2023 trend and goes above 3usd/mmbtu this short thesis is invalidated. Here's a split frame 1 day chart of KOLD and NG1!.
KOLD levels:
R3 = 105
R2 = 96
R1 = 87
pivot = 78
S1 = 69
S2 = 60
S3 = 51

RectangleLeveraged
Zone of support beneath it.
Borderline oversold.
Neutral until broken.
You can calculate target using the vertical width of the structure and projecting it from the top or bottom line.
No recommendation.
ProShares Trust II - ProShares UltraShort Bloomberg Natural Gas is an exchange traded fund launched by ProShare Capital Management LLC. It is co-managed by ProFund Advisors LLC and ProShare Advisors LLC. The fund invests in the commodity markets. It takes short positions and uses derivatives such as futures contracts to invest in natural gas sector. The fund seeks to track -2x the daily performance of the Bloomberg Natural Gas Subindex. ProShares Trust II - ProShares UltraShort Bloomberg Natural Gas was formed on October 4, 2011 and is domiciled in the United States.
The investment seeks daily investment results, before fees and expenses, that correspond to two times the inverse (-2x) of the performance of the Bloomberg Natural Gas SubindexSM for a single day. The fund seeks to meet its investment objective by investing in Natural Gas futures contracts. It may also invest in swaps if the market for a specific futures contract experiences emergencies or disruptions (e.g., a trading halt or a flash crash) or in situations where the Sponsor deems it impractical or inadvisable to buy or sell futures contracts (such as during periods of market volatility or illiquidity). Benchmark: Bloomberg Sub Natural Gas TR USD

Is KOLD getting chilled out ?KOLD's trend down may be continuing. They say weather climate conditions are for things
heating up. this trader concurs albeit from one of the traditional hottest places in the entire
USA and so with that bias come hell or bitter winter chill. On the chart, a persistent trend
down for KOLD underneath the Ichimoku cloud of the Luxalgo indicator is easily seen.
Luxalgo's Bollinger Band oscillator shows that price is riding down along the lower BB band
without any outlook for a reprive. Furthermore, price is well below the high volume
area of the volume profile and in the lowermost bands of the anchored VWAP. On the MACD
indicator, the MACD and signal are both trending down and well below zero.
In short, the value of KOLD is crashing down. Any traders long are best to consider liquidating
while any value remains. I am not long KOLD and happily continue my long positions in
BOIL, the inverse of it until analysis dictates otherwise.

Can KOLD make it through the summer?KOLD is a leveraged inverse of natural gas futures contracts. Natural gas prices could see a rise
this summer as it is fuel for electric plants to make electricity to power air conditioning and
charge all the new electric cars. Hydroelectric and wind might be green put they contribute
little to the large power grid. NG is better than coal and diesel. So if a supply and demand
imbalnce develops what does Eco 101 say will happen to prices ? KOLD will go down and BOIL,
its inverse will go up as rising current prices will reflect in futures contracts in months ahead.
On the chart, KOLD is seen in an uptrend and the RSI has crossed over the 50 line while
price has crossed over the POC line of the profile ( mean price at which the most shares traded
over the given date range). Bullish momentum is slightly dominating with moving averages
diverging. A volume void above may result in a small jump along the way. Will the summer
heat drive up NG prices and make KOLD melt?

KOLD drops with Natural Gas RisesOn the daily chart KOLD has been testing resistance since February with a single touch in
February , a head and shoulders in April and a double top in early May. It is now retracing
due to the rise in natural gas prices in the past 10 days. A support line from a prior
retracement in early March is drawn at 41.45. This analysis is further supported by the zero-lag
MACD oscillator. I will take a trade of put options but short selling is another alternative.
Once in the trade, a signal to close will be the red zone outside the bands as was the case
in late February. The actual sell signal being the thick MACD black line inflecting from moving
downward to upward. KOLD could drop 80% from the present price down to the POC line of
the volume profile at about $ 12.50. If leveraged with put options this could represent
a 5X profit or better. Any sustained rebound in natural gas prices will lend heavy support to
this idea. IF a trader wants to capture smaller moves albeit at the risk of getting into a chop
zone, a smaller time fram such as 30-120 minutes could be used.

KOLD long short scenario natural gas bearish symbol
this is long short scenario..
based on harmonic theory~~~


KOLD uptrend inside uptrend inside uptrend and possible going upThe oversold AMEX:KOLD presents us with an interesting pattern of 3 uptrends inside each other on the 15 min chart, coming from a daily reversal.
The zone on the analysis is located in a sweet spot, giving us the opportunity for a first target at 5:1 and second target over 10:1. Even more if we're wanting to be patient and wait for the breakout the weekly resistance.
Risk: 0.76 per share
Shares: 131 ($100 total risk)
Target 1: 75.43
Target 2: 80.91
I will take the trade a second time if price hits stop loss and goes back up in the trade direction, as price crosses entry point going up. There's a second zone sitting right below the first one.

bull flag set up hidden inside bullish cypher patternand you'll also notice that previous resistances is currently acting as support. There are two bullish set ups.. the bull flag, which you can clearly see if you remove the bullish cypher pattern. Looking for price action to breakout out the triangle and retest the highs

Time to short KOLDKOLD always loses value over time. Getting the timing right however, is somewhat of an art. You will want to invest when natural gas is over sold and you figure bounces coming then short KOLD.

KOLD 3X INVERSE NATURAL GAS REVERSALKOLD is at a monthly low; support is set at Volume Profile POC.
Relative volume tells the story. Natural Gas has had the
highest YTD appreciation of all commodities. Needed in Europe
( by Liquid Gas- LNG) to burn to generate electricity to
air condition the heat wave right now but this ETF
is tracking futures not the spot NG price.
Assuming price action to reach the prior monthly high in
early July price could go from $15 to $40 or about
more than 200% potential upside.
Price is at the POC confluent with the midline of the EMA 9
band channel as well as the bottom of the cloud
on the one-hour chart.
KOLD goes up when natural gas drops on a future basis.
Airconditioning will decrease in the fall and then NG heating
will increase in the winter.
Options volume is available but low. At least at the monthly
bottom a fairly tight stop could be set with potential upside
on the 8/19 expiration for the strike 18/19 with a potential
on the upside of 10X.
Pull Back FishingNatural Gas is pulling back.
Chart is below.
Volatile security and is leveraged x 2. The 20 is crossing up through the 50
No recommendation.
ProShares Trust II - ProShares UltraShort Bloomberg Natural Gas is an exchange traded fund launched by ProShare Capital Management LLC. It is co-managed by ProFund Advisors LLC and ProShare Advisors LLC. The fund invests in the commodity markets. It takes short positions and uses derivatives such as futures contracts to invest in natural gas sector. The fund seeks to track -2x the daily performance of the Bloomberg Natural Gas Subindex. ProShares Trust II - ProShares UltraShort Bloomberg Natural Gas was formed on October 4, 2011 and is domiciled in the United States.
The investment seeks daily investment results, before fees and expenses, that correspond to two times the inverse (-2x) of the performance of the Bloomberg Natural Gas SubindexSM for a single day. The fund seeks to meet its investment objective by investing in Natural Gas futures contracts. It may also invest in swaps if the market for a specific futures contract experiences emergencies or disruptions (e.g., a trading halt or a flash crash) or in situations where the Sponsor deems it impractical or inadvisable to buy or sell futures contracts (such as during periods of market volatility or illiquidity). Benchmark: Bloomberg Sub Natural Gas TR USD