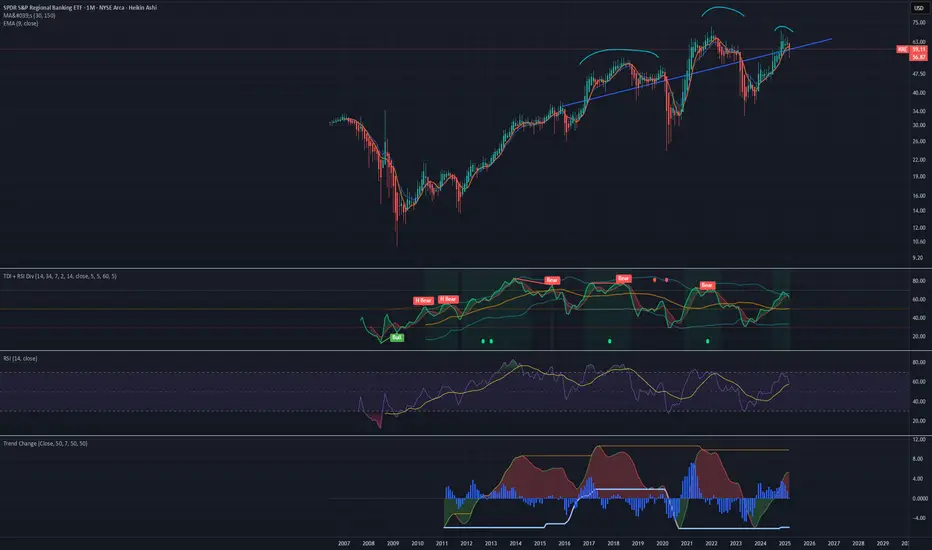
KRE eyes on $54.xx: Major Resistance zone to Break or RejectKRE recovering nicely from the tariff tantrums.
But up against a major resistance zone $54.23-54.79
Want a Break-n-Retest or dip to lower fib at $51.39
Key stats
About SPDR S&P Regional Banking ETF
Home page
Inception date
Jun 19, 2006
Structure
Open-Ended Fund
Replication method
Physical
Dividend treatment
Distributes
Distribution tax treatment
Qualified dividends
Income tax type
Capital Gains
Max ST capital gains rate
39.60%
Max LT capital gains rate
20.00%
Primary advisor
SSgA Funds Management, Inc.
Distributor
State Street Corp. (Fund Distributor)
KRE covers the regional banks segment of the S&P Total Market Index, an index that tracks the broad US equity market. Companies that meet certain market-cap and liquidity requirements will be included in the funds final holdings. Selected securities are then equally-weighted, subject to liquidity constraints. Overall, KREs equal-weighting scheme reduces single stock risk in the smaller names and helps to draw further distinctions from peers with big positions in large-cap names. The funds holdings may change significantly at each quarterly rebalance.
Related funds
Classification
What's in the fund
Exposure type
Finance
Stock breakdown by region
Top 10 holdings

$KRE Swing Trade Strangle Call Debit Spread & Put Debit SpreadAMEX:KRE
Bto 6/17/25 3:48pm PDS Jul18 54/53 Paid 0.27
Open BB 8EMA at Trap bearish, with error at the gap down. keep position until confirmation to change trend.
Bto 6/25/25 3:50pm CDS Oct17 69/70 Paid 0.06
Open BA 8EMA , Confirmation pull back , and PBJ 200SMA/200EMA. This day NYSE:C NYSE

KRE Regional Banks In Trouble?KRE is starting to scream Danger! Wave 3 up ending. Multiple head and shoulders (one massive) the current uptrending is now starting to CRACK! signaling that the right shoulder will now start to form.
I see no benefit for bulls to hold on as risk is now very high. Furthermore, this is a bad sign fo

$KRE CRASH COMING ... Not yet tho..we'll find out..Regional Banks seem to be heading on a slippery path identical to the most previous crash pattern back when they needed all the loan Bailouts. Now that all the loans have stopped, I'm sure some banks may be heading towards loan restructuring perhaps, maybe defaults, I'm not sure honestly. I just kno

$KRE REGIONAL BANK Crash? Identical Setup to March 23'Identical Setup to 23' Regional Bank Crash. As always, not sure what the trigger will be, but I will do my best to keep everyone updated as usual. Target of $58 from $60s reached. I'll be expecting a bit more come June. Watch for the sideways movement and rally until then.

KRE is bearish short term as wellAMEX:KRE is breaking down from a short term perspective and timeframe as well

KRE is predicting a Bank collapseAMEX:KRE has a very nasty looking head and shoulders currently playing out that is predicting the banking sector will collapse soon
Important Warning for 2025:There’s a big problem brewing in the economy. A chart shows that regional banks’ stock prices are under a lot of pressure. This means small, local banks (like those serving small towns in Pakistan) are facing trouble. If these banks struggle, it can cause problems for the overall economy. In 2025, w

KRE Seems to be in troubleIts in a big trouble.
Entry Short: 61
Stop Loss: 63.60
Exit: ~36
This is a potential 40% gain in 6 months.
All the best.
Marketpanda
Disclaimer: The information provided is for general informational and educational purposes only, and does not constitute financial, investment, or legal advice. N

Regional Banks - Monthly break out, shall it continue?Well, with RTY outperforming the CrackDaq and Spiders TODAY, let's see if a flight to quality takes place as we transition into 25' and the Orange Man's presidency.... tariff's if the come may not be good for larger corporations, but small business and regional banks may be a safe haven in this time

See all ideas
Summarizing what the indicators are suggesting.
Oscillators
Neutral
SellBuy
Strong sellStrong buy
Strong sellSellNeutralBuyStrong buy
Oscillators
Neutral
SellBuy
Strong sellStrong buy
Strong sellSellNeutralBuyStrong buy
Summary
Neutral
SellBuy
Strong sellStrong buy
Strong sellSellNeutralBuyStrong buy
Summary
Neutral
SellBuy
Strong sellStrong buy
Strong sellSellNeutralBuyStrong buy
Summary
Neutral
SellBuy
Strong sellStrong buy
Strong sellSellNeutralBuyStrong buy
Moving Averages
Neutral
SellBuy
Strong sellStrong buy
Strong sellSellNeutralBuyStrong buy
Moving Averages
Neutral
SellBuy
Strong sellStrong buy
Strong sellSellNeutralBuyStrong buy
Displays a symbol's price movements over previous years to identify recurring trends.
Frequently Asked Questions
An exchange-traded fund (ETF) is a collection of assets (stocks, bonds, commodities, etc.) that track an underlying index and can be bought on an exchange like individual stocks.
KRE trades at 59.65 USD today, its price has risen 1.41% in the past 24 hours. Track more dynamics on KRE price chart.
KRE net asset value is 58.84 today — it's fallen 4.19% over the past month. NAV represents the total value of the fund's assets less liabilities and serves as a gauge of the fund's performance.
KRE assets under management is 3.27 B USD. AUM is an important metric as it reflects the fund's size and can serve as a gauge of how successful the fund is in attracting investors, which, in its turn, can influence decision-making.
KRE price has fallen by −5.14% over the last month, and its yearly performance shows a 10.77% increase. See more dynamics on KRE price chart.
NAV returns, another gauge of an ETF dynamics, have risen by −4.19% over the last month, have fallen by −4.19% over the last month, showed a 5.31% increase in three-month performance and has increased by 3.80% in a year.
NAV returns, another gauge of an ETF dynamics, have risen by −4.19% over the last month, have fallen by −4.19% over the last month, showed a 5.31% increase in three-month performance and has increased by 3.80% in a year.
KRE fund flows account for −62.11 M USD (1 year). Many traders use this metric to get insight into investors' sentiment and evaluate whether it's time to buy or sell the fund.
Since ETFs work like an individual stock, they can be bought and sold on exchanges (e.g. NASDAQ, NYSE, EURONEXT). As it happens with stocks, you need to select a brokerage to access trading. Explore our list of available brokers to find the one to help execute your strategies. Don't forget to do your research before getting to trading. Explore ETFs metrics in our ETF screener to find a reliable opportunity.
KRE invests in stocks. See more details in our Analysis section.
KRE expense ratio is 0.35%. It's an important metric for helping traders understand the fund's operating costs relative to assets and how expensive it would be to hold the fund.
No, KRE isn't leveraged, meaning it doesn't use borrowings or financial derivatives to magnify the performance of the underlying assets or index it follows.
In some ways, ETFs are safe investments, but in a broader sense, they're not safer than any other asset, so it's crucial to analyze a fund before investing. But if your research gives a vague answer, you can always refer to technical analysis.
Today, KRE technical analysis shows the sell rating and its 1-week rating is buy. Since market conditions are prone to changes, it's worth looking a bit further into the future — according to the 1-month rating KRE shows the buy signal. See more of KRE technicals for a more comprehensive analysis.
Today, KRE technical analysis shows the sell rating and its 1-week rating is buy. Since market conditions are prone to changes, it's worth looking a bit further into the future — according to the 1-month rating KRE shows the buy signal. See more of KRE technicals for a more comprehensive analysis.
Yes, KRE pays dividends to its holders with the dividend yield of 2.66%.
KRE trades at a premium (0.04%).
Premium/discount to NAV expresses the difference between the ETF’s price and its NAV value. A positive percentage indicates a premium, meaning the ETF trades at a higher price than the calculated NAV. Conversely, a negative percentage indicates a discount, suggesting the ETF trades at a lower price than NAV.
Premium/discount to NAV expresses the difference between the ETF’s price and its NAV value. A positive percentage indicates a premium, meaning the ETF trades at a higher price than the calculated NAV. Conversely, a negative percentage indicates a discount, suggesting the ETF trades at a lower price than NAV.
KRE shares are issued by State Street Corp.
KRE follows the S&P Regional Banks Select Industry. ETFs usually track some benchmark seeking to replicate its performance and guide asset selection and objectives.
The fund started trading on Jun 19, 2006.
The fund's management style is passive, meaning it's aiming to replicate the performance of the underlying index by holding assets in the same proportions as the index. The goal is to match the index's returns.