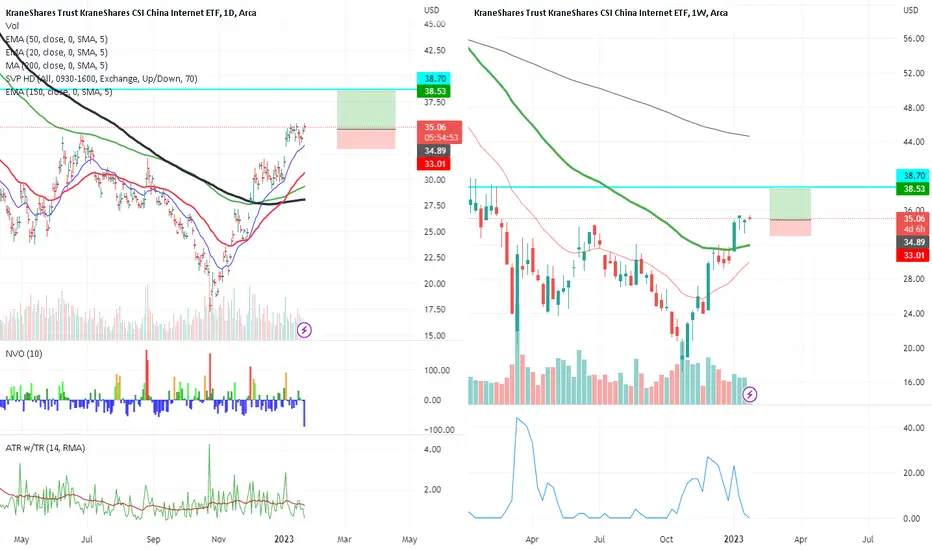
$KWEB - breaking outAMEX:KWEB looks like it is breaking out of the descending wedge. If you zoom out the IHS is still intact. If the price can get above $28.50 it could run to $31 - $33 area. Downside risk is $26 - $25.
Not an investment advice.
KWEB trade ideas
All Roads Lead to China $KWEB $CQQQNo government is performing at a higher level than China's. The biggest risk is they take Taiwan. If that happens any investment you have there could get frozen or could get banned or could get out right stolen. That said I think they take Taiwan by election eventually because even there it is close. There is a big pro China population in Taiwan most people do not talk about.
The upside is if over the next 20 years they become more rule of law, more into developing their own tech. Overtime the market will give them a better multiple and will gain trust in China. Trust right now is lower than its been in a couple decades. It might improve a lot over time depending on their policy and actions. Obviously they could also gain if there's more mistrust of the USA's rule of law if it goes that way in the next couple decades too.

KWEB - Perking up?KWEB had a nice hold at the golden pocket and volume has started to pick up on up days and tail off on down days. With the Nikkei making new 33 year highs and the US markets looking a little long in the tooth, China may be the place to take a shot. Moving averages flattening out and starting to rise. KST, MACD and RSI looking good! Yesterday's move down didn't quite fill the gap but I'm not quibbling over a a few cents. Lots of upside here if China economy can start to pick up after a long period of economic woes due to pandemic.

$KWEB - Looking goodAMEX:KWEB #KWEB Looking good. If the price can break above $28.85, it can go to $33.30 area near term. Downside risk is $25.30.
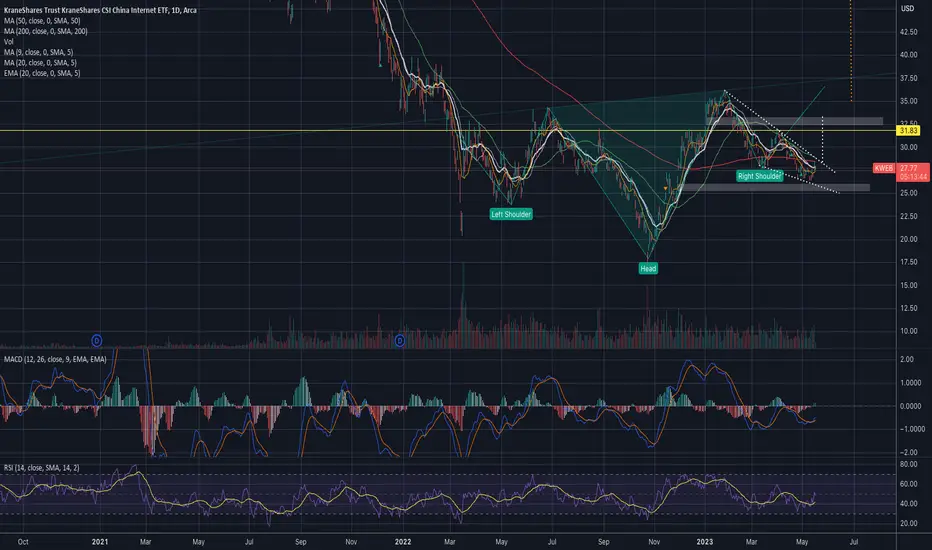
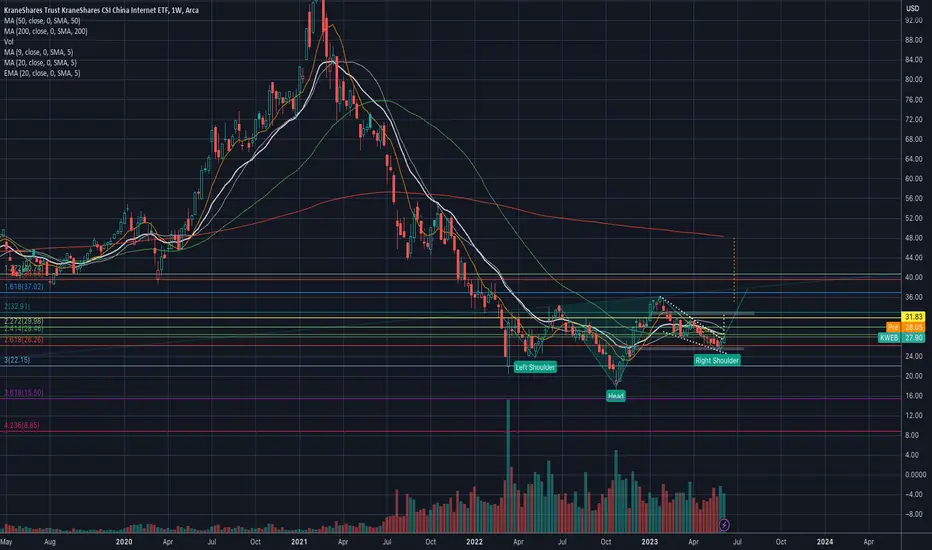
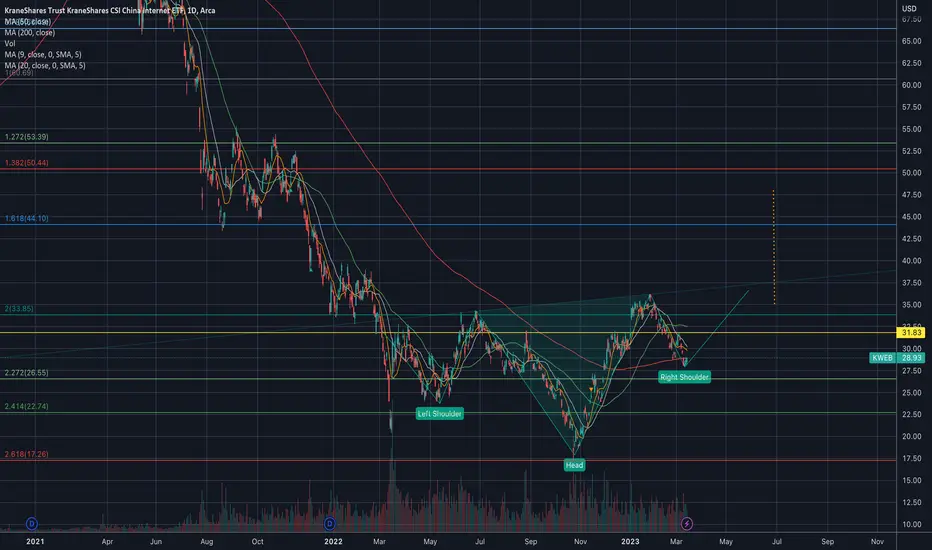
Chinese Internet Stocks - KWEBnext leg up possibly starts very soon. Looking like an inverted head and shoulders bottoming pattern here, and with daily and weekly bullish divergences on RSI, I would think continuation up is likely.
Over 34.5 would be a big step forward and could take it to the 50 area again.
Good luck!

KWEB: patience is neededfor personal use
KWEB tracks the CSI Overseas China Internet Index, which consists of China based companies whose primary business or businesses are focused on internet and internet-related technology.

$KWEB: Timing is right here 👌This is China's internet ETF and a good stock to diversify your portfolio if you have too much exposure to US markets. Look to jump in when the price is above $28.50.

$KWEB- IHS still possible#KWEB recent pull back threatens the IHS formation. So far its recoverable and still possible, if things reverse from here. Its at critical resistance area. 👀
Tip: add 20 EMA to your chart and you can spot patterns easier.

$KWEB - Mini IHS inside outer potential IHS#KWEB Looks like a mini IHS is forming inside the right shoulder of an bigger IHS. If IHS materialized, meaning if the price can break above the neckline at $32.00, we can see further upside to $35.60. On the other hand breaking below 200 DMA could drop it to $26.55.
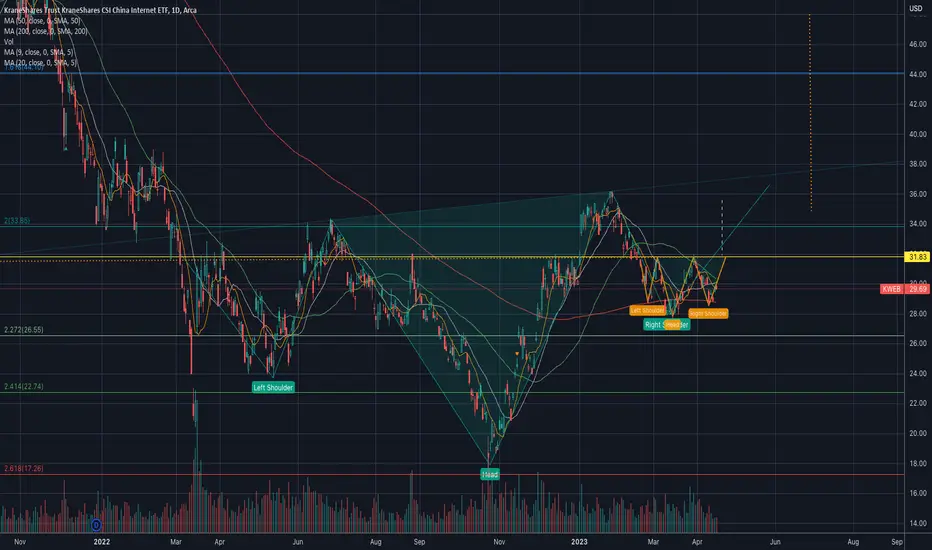
$KWEB - Can it do inverse head and shoulder?#Kweb looks like it could be trying to form inverse head and shoulder. What do you think?
Will the right shoulder complete?
If the pattern complete and validates, the target after validation is $48. 🙏
KWEB - China internet I'm expecting a pullback to the grey box to complete the correction for the five wave moves.

$KWEB beautiful Demark signalsI love how beautiful and elegant the TD Sequential has been working on $KWEB. I am looking for a 9 buy to add to my $KWEB positions and some Vietnamese stocks as well.

Long Kweb on daily with call diagonalsprice broke and seems to be holding abv the resistance well
entering on the consolidation , holding the long term call
Stop at the option expiry for long term 35strike( 361 days)
exit all if the target for short term call reach 38strike (25 Days)
KWEBI believe, for sometime KWEB should take a pause for a brief time:
1) The current price is right at the resistance zone on the weekly chart ($31.xy to $32.nm) - We can see many times in the past the price has turned back from these levels.
2) 50 ema on weekly chart is right at the resistance, working as double resistance for the price move.
3) Dragon fly doji at the resistance means zone of strong supply.
4) The rally has been a swift and strong, now it is a few weeks old for next round of healthy run it should take a pause.
Bull:
1) RSI is healthy.
2) A support is at $28-$29ish
3) Standard Deviation is higher than its previous peak and heading higher
4) Once the pause is over, next pause should be at around $38.50ish
Conclusion: Overall view on KWEB is positive. In a short term the KWEB should take a pause, possibly fall a bit, before starting to run again. If the drama around possibility of US ban on Chinese stocks ends and the Zero COVID policy is lifted, then 2023 will be the year of Chinese Stocks.
PS: I am new to analysis. So, do not forget to do your own research, make your own decision, you are responsible for your trades. I welcome inputs to improve my analysis. So, please share your knowledge and guide me.

V BottomKWEB has moved a lot recently leaving some gaps behind on the way.
ATH is 104.74 and ATL is 17.22 which is at the bottom of this V.
A V bottom is not rounded like a Cup pattern and often consists of a 1 candle sharp bottom.
A V can form a handle but it is not a requirement and this one did.
It is hard to know what sentiment will be regarding China stocks from one day to another.
No recommendation/
I have found most China stocks do fill their gaps but not always in a timely fashion.

KWEB - next target is 50KWEB shows strength compared to SPX. , considering the market structure, I expect KWEB to test the $50 level.

KWEB (China Internet stocks) seems to be ready to outperformThe ratio of KWEB/QQQ seems to have completed its bearish pattern and ready to rise. Support around 0.06, targets/resistances at 0.14 then 0.21.

$KWEB - Inverse head and shoulder reversal#KWEB just broke out of the neck line of a inverse head and shoulder reversal and could see further up side to $28.48 which is 200 DMA.
Target 1 - $27
Target 2 - $28.48
Target 3 - $33
Stop loss - $23
——
Trade is done when it hit one of the target or stop loss is hit.
Disclaimer: Trading note. Not an investment advice.
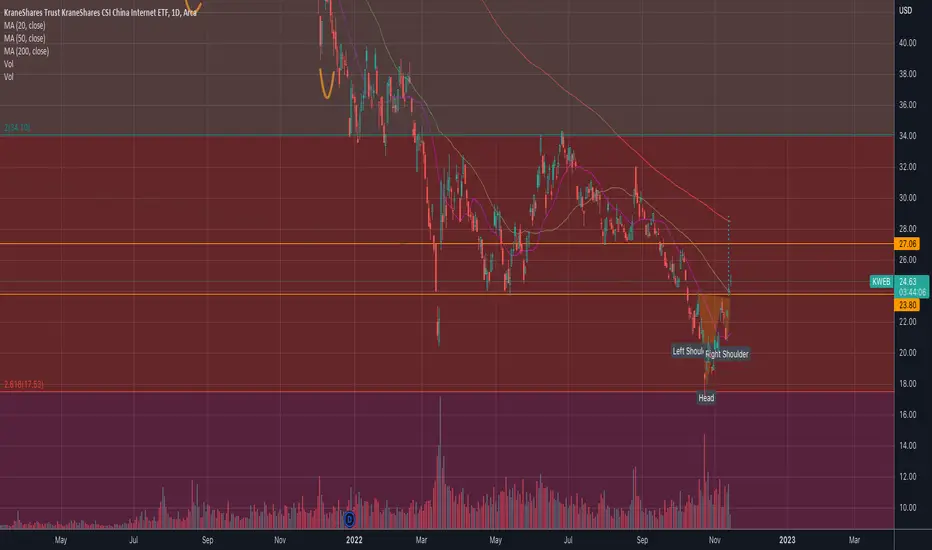
KWEB- Elliott wave forecastI guess the black 5- wave is underway which means the price might see the lows of 17 $ or lower again.

KWEB Accumulation for longer termChina Internet ETF, came down quite a lot.
Looking at accumulating KWEB at current level
On BB we can see that its trading below the median line of 2 STD Deviation for weekly candle stick.
SPOT: $27.70
SL $18.00
TP $52.5

KWEB/VTI WHERE EAST MEETS WEST Hey guys,
Thank you for organizing this interesting competition.
If anyone is interested ! Join in the fun
Thanks for checking out my thesis and hope you guys enjoy it.
==========================================
Basically, i will be doing a TOP-DOWN analysis approach for my thesis between the two major economies. We will be looking at simple macro and very logically comparison.
After which, i will break down the chart into different sections with Momentum theory as the base and other confluence elements as supporting. We will trade what we see on the chart. Nothing speculative.
===================Macro=======================
Macro
$VTI - High inflationary environment / rate hikes / quantitative tightening / bull run for the last 2 years / stocks overvalued / might be looking at negative GDP + inflation = stagflation = risk off for stocks
$KWEB - Moderate inflationary environment / quantitative easing / correction for the last 2 years / low PE ratio / stocks undervalued
===================Technical analysis =======================
Technical analysis
1) Falling wedge formation
The initial momentum was very strong and diminish over time towards the end before breaking out. This shows that the momentum had extinguished and will be looking for a trend reversal. As seen on the break out and retest.
2) The price broke out from the 1 year downward trend line and did a retest / rejected with a engulfing candle forming the left shoulder and head of the inverse head and shoulders. We are no longer making lower lows.
3) As seen on the Momentum theory indicator, the bearish momentum had bottomed out and broke out from the neckline. An emerging bull momentum might emerge once the price action had proven its strength. Momentum will above 0 and will commence its run.
4) We are looking at a potential inverse head and shoulder or cup and handle formations. Both are bullish price action and trend reversal formation. This can be confirmed over the next 1-2 months after the right shoulder / or handle is formed.
Based on point 1,2 & 3. We can established that the $KWEB had ended its bear run / rejected the bottom. And once the right shoulder formed and price moved above the major support & resistance area and 200 moving average. A bull trend will emerge.
===================Entry=======================
Entry.
A multi confluence entry would enhance the confidence, increases the probability of success.
Depending on risk appetite, we have listed two possible entry scenario. Both scenarios have great risk to rewards ratio.
Entry 1
- Right shoulder or handle formed
- Price goes above major support and resistance neckline
- The 50/200 moving average golden cross = this will be the entry trigger. Stop loss can be % of your capital or the low of the inverse head and shoulders
- Exit will be either your preferred target % or ride with trailing moving average i.e 50/200 moving average death cross
Entry 2
- 30% position on bull flag of the cup and handle / or right shoulder formed
- 30% position on breakout of cup and handle / breakout of the major support & resistance neckline
- 40% position once 50/200 moving average golden cross
- Stop loss can be % of your capital or the low of the inverse head and shoulders
- Exit will be either your preferred target % or ride with trailing moving average i.e 50/200 moving average death cross
=====================END=====================
Thank you for your time and hope you enjoyed my analysis.
Trade safe and always manage your risk !
" When you genuinely accept the risks, you will be at peace with any outcome.
- Mark Douglas "

WATCH $KWEBBullish
- Making higher lows since March / June / Sept 2022
- Broke downward trend line & retest
- Funds accumulating
- Great value
- Good R/R trade
Entry idea
- For members
Stop loss depending on entry and risk appetite. But always set meaningful stops.
"“I hear and I forget. I see and I remember. I do and I understand.””
Cheers and happy trading!

