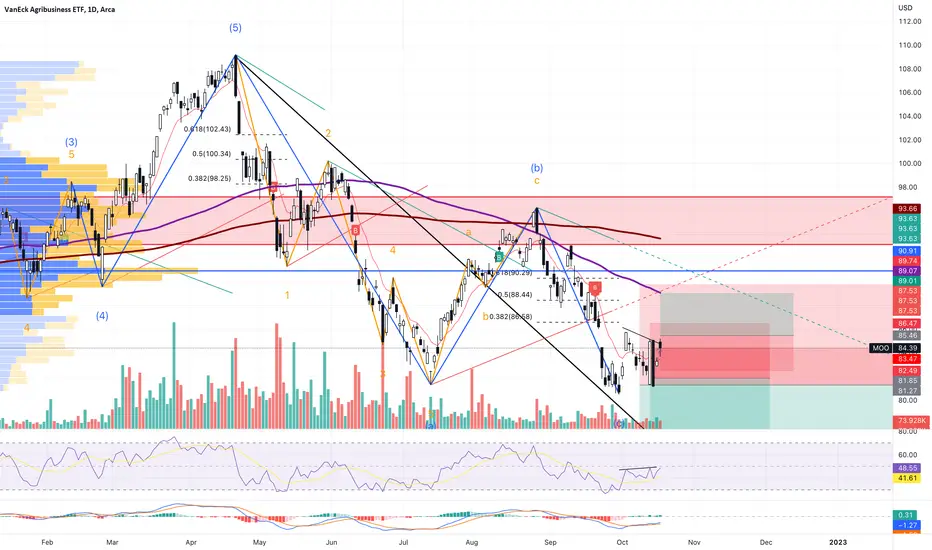
Safest short in the stock marketHey, I think MOO drops, and significantly so. I'm not shorting yet, but I'm posting my idea ahead of time. I WILL short this when SPY hits $390
Key stats
About VanEck Agribusiness ETF
Home page
Inception date
Aug 31, 2007
Structure
Open-Ended Fund
Replication method
Physical
Dividend treatment
Distributes
Distribution tax treatment
Qualified dividends
Income tax type
Capital Gains
Max ST capital gains rate
39.60%
Max LT capital gains rate
20.00%
Primary advisor
Van Eck Associates Corp.
Distributor
Van Eck Securities Corp.
MOO captures a broad portfolio of agriculture companies. Agribusiness is the large business sector that encompasses companies and enterprises that are related to farming and farming-related commercial activities. The fund selects pure-play agribusiness stocks whose revenues are more than 50% derived from agri-chemicals, animal health and fertilizers, seeds and traits, farm/irrigation equipment and machinery, aquaculture and fishing, livestock, cultivation and plantations and trading of agricultural products. Stocks are selected and weighted by market cap. The index is reviewed quarterly, with each companys weighting capped at 8%.
Related funds
Classification
What's in the fund
Exposure type
Process Industries
Producer Manufacturing
Health Technology
Consumer Non-Durables
Stock breakdown by region
Top 10 holdings

MOO daily late entry ABC correctionBuy Stop 85.46 LMT 85.46 GTC
Sell Limit 89.01 GTC
Sell Stop 82.49 DAY
MOO daily late entry ABC correction if we clear both candles from above we can run into MA 200
MOO running out of grassHey everybody,
I've been following MOO as of late as I'm currently short DE and waiting on an entry for CAT short as well; I've noticed that it has essentially been forming a Wyckoff-style distribution pattern, and is one of the few sectors in this market that isn't brutally beaten down at this poi

Stocks To Watch This WeekWeekly charts showing what is working in the market. I show the ETF first and them some strong names in the group. Get a pen and paper because I go quickly and make the trade your own.. These names have shown good relative strength and accumulation volume and most are in the growth sector. This may

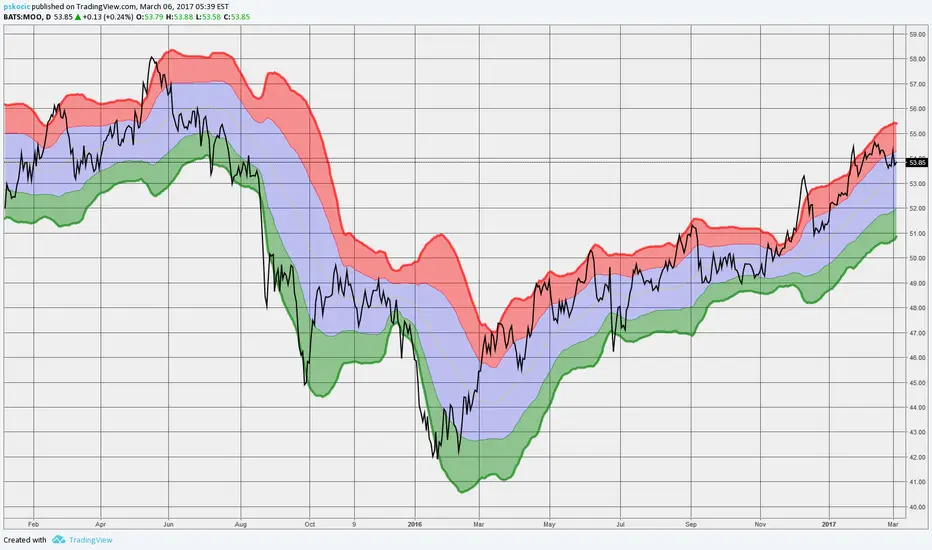
MOO, agribusiness on the moveMarket Vector agribusiness ETF has broke out of the 10months consolidation in ascending triangle
by a GAP up
whether this breakout is for real, we will find out soon if it can find support or not, should it re-test the upper triangle line
However, there is nothing to celebrate yet as you can see th


See all ideas
Summarizing what the indicators are suggesting.
Oscillators
Neutral
SellBuy
Strong sellStrong buy
Strong sellSellNeutralBuyStrong buy
Oscillators
Neutral
SellBuy
Strong sellStrong buy
Strong sellSellNeutralBuyStrong buy
Summary
Neutral
SellBuy
Strong sellStrong buy
Strong sellSellNeutralBuyStrong buy
Summary
Neutral
SellBuy
Strong sellStrong buy
Strong sellSellNeutralBuyStrong buy
Summary
Neutral
SellBuy
Strong sellStrong buy
Strong sellSellNeutralBuyStrong buy
Moving Averages
Neutral
SellBuy
Strong sellStrong buy
Strong sellSellNeutralBuyStrong buy
Moving Averages
Neutral
SellBuy
Strong sellStrong buy
Strong sellSellNeutralBuyStrong buy
Displays a symbol's price movements over previous years to identify recurring trends.
Frequently Asked Questions
An exchange-traded fund (ETF) is a collection of assets (stocks, bonds, commodities, etc.) that track an underlying index and can be bought on an exchange like individual stocks.
MOO trades at 74.78 USD today, its price has fallen −0.09% in the past 24 hours. Track more dynamics on MOO price chart.
MOO net asset value is 74.86 today — it's risen 2.26% over the past month. NAV represents the total value of the fund's assets less liabilities and serves as a gauge of the fund's performance.
MOO assets under management is 648.79 M USD. AUM is an important metric as it reflects the fund's size and can serve as a gauge of how successful the fund is in attracting investors, which, in its turn, can influence decision-making.
MOO price has risen by 1.98% over the last month, and its yearly performance shows a 5.62% increase. See more dynamics on MOO price chart.
NAV returns, another gauge of an ETF dynamics, have risen by 2.26% over the last month, showed a 10.00% increase in three-month performance and has increased by 9.08% in a year.
NAV returns, another gauge of an ETF dynamics, have risen by 2.26% over the last month, showed a 10.00% increase in three-month performance and has increased by 9.08% in a year.
MOO fund flows account for −115.73 M USD (1 year). Many traders use this metric to get insight into investors' sentiment and evaluate whether it's time to buy or sell the fund.
Since ETFs work like an individual stock, they can be bought and sold on exchanges (e.g. NASDAQ, NYSE, EURONEXT). As it happens with stocks, you need to select a brokerage to access trading. Explore our list of available brokers to find the one to help execute your strategies. Don't forget to do your research before getting to trading. Explore ETFs metrics in our ETF screener to find a reliable opportunity.
MOO invests in stocks. See more details in our Analysis section.
MOO expense ratio is 0.55%. It's an important metric for helping traders understand the fund's operating costs relative to assets and how expensive it would be to hold the fund.
No, MOO isn't leveraged, meaning it doesn't use borrowings or financial derivatives to magnify the performance of the underlying assets or index it follows.
In some ways, ETFs are safe investments, but in a broader sense, they're not safer than any other asset, so it's crucial to analyze a fund before investing. But if your research gives a vague answer, you can always refer to technical analysis.
Today, MOO technical analysis shows the buy rating and its 1-week rating is buy. Since market conditions are prone to changes, it's worth looking a bit further into the future — according to the 1-month rating MOO shows the buy signal. See more of MOO technicals for a more comprehensive analysis.
Today, MOO technical analysis shows the buy rating and its 1-week rating is buy. Since market conditions are prone to changes, it's worth looking a bit further into the future — according to the 1-month rating MOO shows the buy signal. See more of MOO technicals for a more comprehensive analysis.
Yes, MOO pays dividends to its holders with the dividend yield of 2.94%.
MOO trades at a premium (0.10%).
Premium/discount to NAV expresses the difference between the ETF’s price and its NAV value. A positive percentage indicates a premium, meaning the ETF trades at a higher price than the calculated NAV. Conversely, a negative percentage indicates a discount, suggesting the ETF trades at a lower price than NAV.
Premium/discount to NAV expresses the difference between the ETF’s price and its NAV value. A positive percentage indicates a premium, meaning the ETF trades at a higher price than the calculated NAV. Conversely, a negative percentage indicates a discount, suggesting the ETF trades at a lower price than NAV.
MOO shares are issued by Van Eck Associates Corp.
MOO follows the MVIS Global Agribusiness. ETFs usually track some benchmark seeking to replicate its performance and guide asset selection and objectives.
The fund started trading on Aug 31, 2007.
The fund's management style is passive, meaning it's aiming to replicate the performance of the underlying index by holding assets in the same proportions as the index. The goal is to match the index's returns.