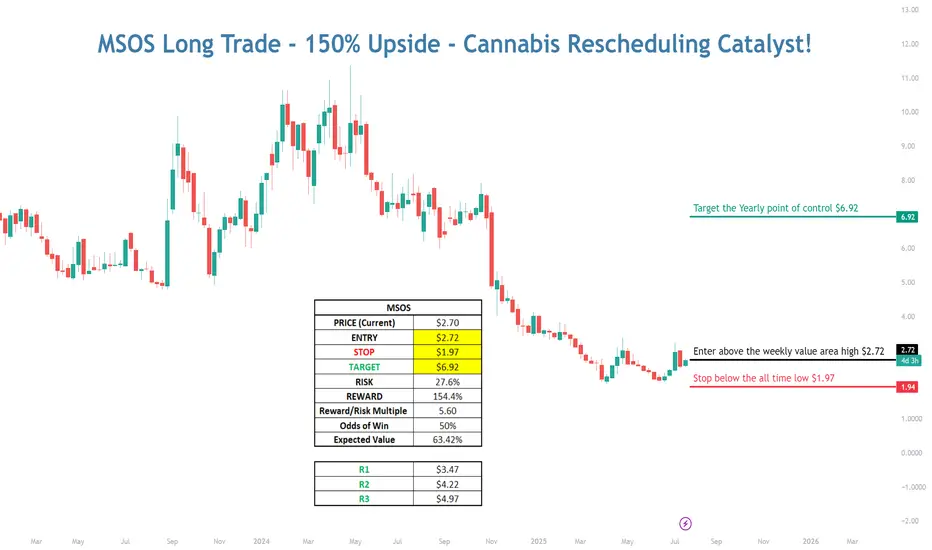
MSOS Long with 150% Upside - Cannabis Rescheduling Catalyst💠 Catalyst : Cannabis is currently classified as a schedule I drug alongside heroin, bath salts, and synthetic opioids that kill thousands every year — all while being safer than Tylenol and legal in over half the country. Cannabis is likely to be rescheduled to a schedule III drug soon after Terry
Key stats
About AdvisorShares Trust AdvisorShares Pure US Cannabis ETF
Home page
Inception date
Sep 1, 2020
Structure
Open-Ended Fund
Replication method
Physical
Dividend treatment
Distributes
Distribution tax treatment
Qualified dividends
Income tax type
Capital Gains
Max ST capital gains rate
39.60%
Max LT capital gains rate
20.00%
Primary advisor
AdvisorShares Investments LLC
Distributor
Foreside Fund Services LLC
MSOS is the first US-listed actively managed ETF to provide exposure solely to American cannabis and hemp companies, including multi-state operators (MSOs). This is the second fund from AdvisorShares dedicated to the cannabis investment strategy. MSOS seeks long-term capital appreciation by investing entirely in legal, domestic cannabis equity securities. Stocks may be of mid- and small-cap companies. In addition, the fund will use total return swap contracts to create such exposure. The fund advisor uses a variety of tools and ratings sources to select securities. Companies must be registered with the DEA specifically for the purpose of handling marijuana for lawful research and development of cannabis or cannabinoid-related products. Stocks selected may focus on areas such as REITs, health care, cannabidiol (CBD), pharmaceutical and hydroponics. In addition to investment risks, investors need to be aware of the ongoing regulatory risks.
Related funds
Classification
What's in the fund
Exposure type
Cash
Stock breakdown by region
Top 10 holdings

MSOS Long with 150% Upside - Cannabis Rescheduling Catalyst💠 Catalyst: Cannabis is currently classified as a schedule I drug alongside heroin, bath salts, and synthetic opioids that kill thousands every year — all while being safer than Tylenol and legal in over half the country. Cannabis is likely to be rescheduled to a schedule III drug soon after Terry
$MSOS long term buy hereAMEX:MSOS hit my long term downside target yesterday of $2.46 and I entered a starter position down there. It's up 9% today.
There is still the possibility that we get a final capitulation move from here down to $1.55 or so, and if we get it, I'll add a much heavier position. But basically from he
Weed stocks over sold from tax loss harvesting?Ive traded gtbif green thumb successful before and think this might be the time to trade again. Gtbif is one of the biggest holdings inside this Msos etf.
I like the etf MSOS, the shares of GTBIF, and any of the other profitable Cannabis stocks.
Looking for mean reversion, even 2x upside potentia

MSOS the cannabis trade we all need to know about Election Day in Florida is right around the corner, and Amendment 3 has got cannabis investors buzzing. If you're keeping tabs on the market, you've probably noticed MSOS popping up everywhere.
MSOS, short for the AdvisorShares Pure US Cannabis ETF, isn't your average investment fund. It's more lik

Preparing for BreakoutSimilar setup to a couple other weed stocks, some which have already broken this down trend line (like ACB). Wait for breakout and retest for ultimate assurance or trust your gut.

Weed or BTC?If you're bullish BTC, you should be even more bullish on weed stocks on a break of this descending wedge.

Could rally over $11 in 4 to 6 weeks IMHOReclassification is here - it's right around the corner.
Overall, rescheduling ain't gonna do much. It will classify marijuana as a drug that has
potential for abuse, while still being acknowledged for its medicinal benefits.
The kicker though is the tax and banking implications.
1. Reclassify

MSOS Long 7/13/24Anticipating the completion of wave following the development of a diagonal wave .
A rapid impulsive reversal should confirm wave is complete and wave is in progress towards and through 11.37. Alternatively, if price fails to develop in an impulsive manner, it may signal wave is not yet com

MSOS Why So Glum?Just marking some key areas for a return to key resistances, One never knows how a chart will end up, but this is a consideration of bullish 12 12 path that I could see.

See all ideas
Summarizing what the indicators are suggesting.
Oscillators
Neutral
SellBuy
Strong sellStrong buy
Strong sellSellNeutralBuyStrong buy
Oscillators
Neutral
SellBuy
Strong sellStrong buy
Strong sellSellNeutralBuyStrong buy
Summary
Neutral
SellBuy
Strong sellStrong buy
Strong sellSellNeutralBuyStrong buy
Summary
Neutral
SellBuy
Strong sellStrong buy
Strong sellSellNeutralBuyStrong buy
Summary
Neutral
SellBuy
Strong sellStrong buy
Strong sellSellNeutralBuyStrong buy
Moving Averages
Neutral
SellBuy
Strong sellStrong buy
Strong sellSellNeutralBuyStrong buy
Moving Averages
Neutral
SellBuy
Strong sellStrong buy
Strong sellSellNeutralBuyStrong buy
Displays a symbol's price movements over previous years to identify recurring trends.
Frequently Asked Questions
An exchange-traded fund (ETF) is a collection of assets (stocks, bonds, commodities, etc.) that track an underlying index and can be bought on an exchange like individual stocks.
MSOS trades at 3.04 USD today, its price has risen 0.65% in the past 24 hours. Track more dynamics on MSOS price chart.
MSOS net asset value is 3.08 today — it's risen 37.06% over the past month. NAV represents the total value of the fund's assets less liabilities and serves as a gauge of the fund's performance.
MSOS assets under management is 386.70 M USD. AUM is an important metric as it reflects the fund's size and can serve as a gauge of how successful the fund is in attracting investors, which, in its turn, can influence decision-making.
MSOS price has risen by 34.63% over the last month, and its yearly performance shows a −60.16% decrease. See more dynamics on MSOS price chart.
NAV returns, another gauge of an ETF dynamics, showed a 15.81% increase in three-month performance and has decreased by −58.98% in a year.
NAV returns, another gauge of an ETF dynamics, showed a 15.81% increase in three-month performance and has decreased by −58.98% in a year.
MSOS fund flows account for 77.71 M USD (1 year). Many traders use this metric to get insight into investors' sentiment and evaluate whether it's time to buy or sell the fund.
Since ETFs work like an individual stock, they can be bought and sold on exchanges (e.g. NASDAQ, NYSE, EURONEXT). As it happens with stocks, you need to select a brokerage to access trading. Explore our list of available brokers to find the one to help execute your strategies. Don't forget to do your research before getting to trading. Explore ETFs metrics in our ETF screener to find a reliable opportunity.
MSOS invests in cash. See more details in our Analysis section.
MSOS expense ratio is 0.77%. It's an important metric for helping traders understand the fund's operating costs relative to assets and how expensive it would be to hold the fund.
No, MSOS isn't leveraged, meaning it doesn't use borrowings or financial derivatives to magnify the performance of the underlying assets or index it follows.
In some ways, ETFs are safe investments, but in a broader sense, they're not safer than any other asset, so it's crucial to analyze a fund before investing. But if your research gives a vague answer, you can always refer to technical analysis.
Today, MSOS technical analysis shows the buy rating and its 1-week rating is neutral. Since market conditions are prone to changes, it's worth looking a bit further into the future — according to the 1-month rating MSOS shows the sell signal. See more of MSOS technicals for a more comprehensive analysis.
Today, MSOS technical analysis shows the buy rating and its 1-week rating is neutral. Since market conditions are prone to changes, it's worth looking a bit further into the future — according to the 1-month rating MSOS shows the sell signal. See more of MSOS technicals for a more comprehensive analysis.
MSOS trades at a premium (1.07%).
Premium/discount to NAV expresses the difference between the ETF’s price and its NAV value. A positive percentage indicates a premium, meaning the ETF trades at a higher price than the calculated NAV. Conversely, a negative percentage indicates a discount, suggesting the ETF trades at a lower price than NAV.
Premium/discount to NAV expresses the difference between the ETF’s price and its NAV value. A positive percentage indicates a premium, meaning the ETF trades at a higher price than the calculated NAV. Conversely, a negative percentage indicates a discount, suggesting the ETF trades at a lower price than NAV.
MSOS shares are issued by Wilson Lane Group LLC
MSOS follows the No Underlying Index. ETFs usually track some benchmark seeking to replicate its performance and guide asset selection and objectives.
The fund started trading on Sep 1, 2020.
The fund's management style is active, aiming to outperform its benchmark index by actively selecting and adjusting assets. The goal is to achieve returns that exceed those of the index the fund tracks.