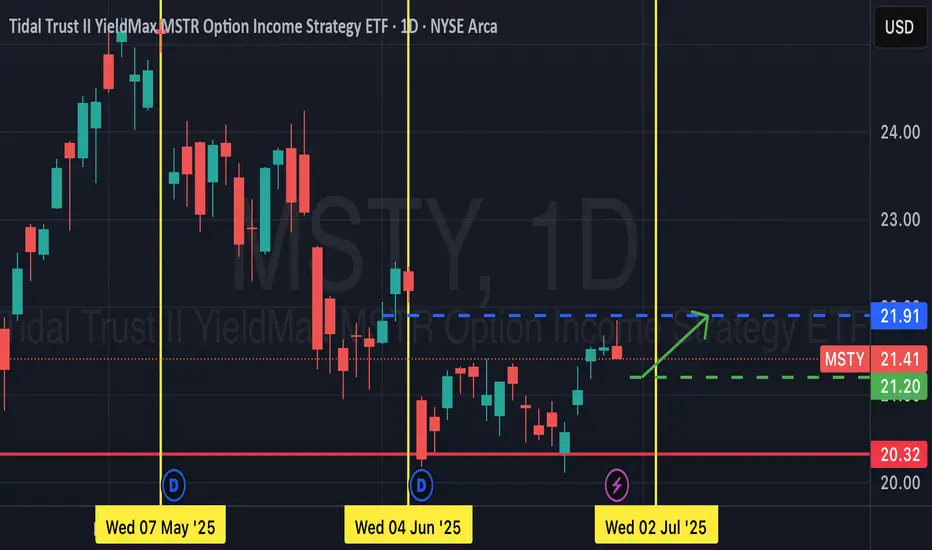
Msty pull back/ dipMsty has a monthly dividend noted by the yellow vertical line. The ex dividend date typically drops, so buying at a favorable price before that ex date is crucial. The chart shows a double bottom followed by a strong bullish movement. This coming week will give a small pullback for a great buying op
Key stats
About Tidal Trust II YieldMax MSTR Option Income Strategy ETF
Home page
Inception date
Feb 22, 2024
Structure
Open-Ended Fund
Replication method
Synthetic
Dividend treatment
Distributes
Distribution tax treatment
Ordinary income
Income tax type
Capital Gains
Max ST capital gains rate
39.60%
Max LT capital gains rate
20.00%
Primary advisor
Tidal Investments LLC
Distributor
Foreside Fund Services LLC
MSTY aims to generate monthly income while providing exposure to the price returns of MicroStrategy stock (MSTR), subject to a cap on potential gains. The fund utilizes a synthetic covered call strategy via standardized exchange-traded and FLEX options, which consists of three elements: i) synthetic long exposure, ii) covered call writing, and iii) US Treasurys for collateral. The synthetic long exposure seeks to replicate the price movements of MSTR by purchasing and selling at-the-money calls and puts that have one- to six-month terms. To generate income, the fund writes call options with an expiration of one month or less and a strike price of approximately 0%-15% above MSTR's current share price. This limits participation in potential gains if MSTR shares increase in value. The short put positions fully expose investors to the downside of the stock. Note: the fund does not invest directly in MSTR stocks. Thus, investors are not entitled to any MSTR dividends.
Related funds
Classification
What's in the fund
Exposure type
Government
Cash
Stock breakdown by region
Top 10 holdings
MSTY trading ideaThis upcoming week is pretty important for Bitcoin: when the tariffs are over, there is a fundamental opportunity for investors, not also that, but the technical chart may be has some justification too. In particular, MSTY is a ticker who has an incredible dividend yield of 154 % so it really helps

MSTY BACK TO $40hi guys this is why i think MSTY will be hitting $40
1. we are in bullish range
2. a lot of bear side liquidity already taken out
3. there a huge liquidity upside to grab
this is a great time to accumulate

MSTY/MSTR RatioRatio has been going downward and seem to have found a floor around 6X (ie MSTR 6x of MSTY)

See all ideas
Summarizing what the indicators are suggesting.
Oscillators
Neutral
SellBuy
Strong sellStrong buy
Strong sellSellNeutralBuyStrong buy
Oscillators
Neutral
SellBuy
Strong sellStrong buy
Strong sellSellNeutralBuyStrong buy
Summary
Neutral
SellBuy
Strong sellStrong buy
Strong sellSellNeutralBuyStrong buy
Summary
Neutral
SellBuy
Strong sellStrong buy
Strong sellSellNeutralBuyStrong buy
Summary
Neutral
SellBuy
Strong sellStrong buy
Strong sellSellNeutralBuyStrong buy
Moving Averages
Neutral
SellBuy
Strong sellStrong buy
Strong sellSellNeutralBuyStrong buy
Moving Averages
Neutral
SellBuy
Strong sellStrong buy
Strong sellSellNeutralBuyStrong buy
Displays a symbol's price movements over previous years to identify recurring trends.
Frequently Asked Questions
An exchange-traded fund (ETF) is a collection of assets (stocks, bonds, commodities, etc.) that track an underlying index and can be bought on an exchange like individual stocks.
MSTY trades at 21.15 USD today, its price has fallen −2.80% in the past 24 hours. Track more dynamics on MSTY price chart.
MSTY net asset value is 21.12 today — it's risen 6.30% over the past month. NAV represents the total value of the fund's assets less liabilities and serves as a gauge of the fund's performance.
MSTY assets under management is 5.67 B USD. AUM is an important metric as it reflects the fund's size and can serve as a gauge of how successful the fund is in attracting investors, which, in its turn, can influence decision-making.
MSTY price has risen by 3.98% over the last month, and its yearly performance shows a −29.94% decrease. See more dynamics on MSTY price chart.
NAV returns, another gauge of an ETF dynamics, showed a 16.79% increase in three-month performance and has increased by 35.33% in a year.
NAV returns, another gauge of an ETF dynamics, showed a 16.79% increase in three-month performance and has increased by 35.33% in a year.
MSTY fund flows account for 5.99 B USD (1 year). Many traders use this metric to get insight into investors' sentiment and evaluate whether it's time to buy or sell the fund.
Since ETFs work like an individual stock, they can be bought and sold on exchanges (e.g. NASDAQ, NYSE, EURONEXT). As it happens with stocks, you need to select a brokerage to access trading. Explore our list of available brokers to find the one to help execute your strategies. Don't forget to do your research before getting to trading. Explore ETFs metrics in our ETF screener to find a reliable opportunity.
MSTY invests in bonds. See more details in our Analysis section.
MSTY expense ratio is 0.99%. It's an important metric for helping traders understand the fund's operating costs relative to assets and how expensive it would be to hold the fund.
No, MSTY isn't leveraged, meaning it doesn't use borrowings or financial derivatives to magnify the performance of the underlying assets or index it follows.
In some ways, ETFs are safe investments, but in a broader sense, they're not safer than any other asset, so it's crucial to analyze a fund before investing. But if your research gives a vague answer, you can always refer to technical analysis.
Today, MSTY technical analysis shows the strong sell rating and its 1-week rating is sell. Since market conditions are prone to changes, it's worth looking a bit further into the future — according to the 1-month rating MSTY shows the sell signal. See more of MSTY technicals for a more comprehensive analysis.
Today, MSTY technical analysis shows the strong sell rating and its 1-week rating is sell. Since market conditions are prone to changes, it's worth looking a bit further into the future — according to the 1-month rating MSTY shows the sell signal. See more of MSTY technicals for a more comprehensive analysis.
Yes, MSTY pays dividends to its holders with the dividend yield of 234.25%.
MSTY trades at a premium (0.12%).
Premium/discount to NAV expresses the difference between the ETF’s price and its NAV value. A positive percentage indicates a premium, meaning the ETF trades at a higher price than the calculated NAV. Conversely, a negative percentage indicates a discount, suggesting the ETF trades at a lower price than NAV.
Premium/discount to NAV expresses the difference between the ETF’s price and its NAV value. A positive percentage indicates a premium, meaning the ETF trades at a higher price than the calculated NAV. Conversely, a negative percentage indicates a discount, suggesting the ETF trades at a lower price than NAV.
MSTY shares are issued by Toroso Investments Topco LLC
MSTY follows the No Underlying Index. ETFs usually track some benchmark seeking to replicate its performance and guide asset selection and objectives.
The fund started trading on Feb 22, 2024.
The fund's management style is active, aiming to outperform its benchmark index by actively selecting and adjusting assets. The goal is to achieve returns that exceed those of the index the fund tracks.