Key stats
About Invesco Food & Beverage ETF
Home page
Inception date
Jun 23, 2005
Structure
Open-Ended Fund
Replication method
Physical
Dividend treatment
Distributes
Distribution tax treatment
Qualified dividends
Income tax type
Capital Gains
Max ST capital gains rate
39.60%
Max LT capital gains rate
20.00%
Primary advisor
Invesco Capital Management LLC
Distributor
Invesco Distributors, Inc.
PBJ offers a concentrated exposure to 30 US stocks in the food & beverage segment using quant screens based on five factors: price momentum, earnings momentum, quality, management action, and value. The resulting portfolio provides significant industry tilts and a far lower average market cap compared to its benchmark. PBJ defines the segment broadly to include food retailers and restaurants, while severely underweighting beverage stocks, and ignoring tobacco and pet supplies stores entirely. Historically, around half of PBJ's portfolio is in its top ten holdings. The index tier weighting reduces concentrations in mega-caps and evenly weights the group of companies across size. The fund and the index are rebalanced and reconstituted quarterly in February, May, August and November. Prior to August 28, 2023, the fund traded under the name Invesco Dynamic Food & Beverage ETF.
Classification
What's in the fund
Exposure type
Consumer Non-Durables
Process Industries
Retail Trade
Distribution Services
Stock breakdown by region
Top 10 holdings


Summarizing what the indicators are suggesting.
Oscillators
Neutral
SellBuy
Strong sellStrong buy
Strong sellSellNeutralBuyStrong buy
Oscillators
Neutral
SellBuy
Strong sellStrong buy
Strong sellSellNeutralBuyStrong buy
Summary
Neutral
SellBuy
Strong sellStrong buy
Strong sellSellNeutralBuyStrong buy
Summary
Neutral
SellBuy
Strong sellStrong buy
Strong sellSellNeutralBuyStrong buy
Summary
Neutral
SellBuy
Strong sellStrong buy
Strong sellSellNeutralBuyStrong buy
Moving Averages
Neutral
SellBuy
Strong sellStrong buy
Strong sellSellNeutralBuyStrong buy
Moving Averages
Neutral
SellBuy
Strong sellStrong buy
Strong sellSellNeutralBuyStrong buy
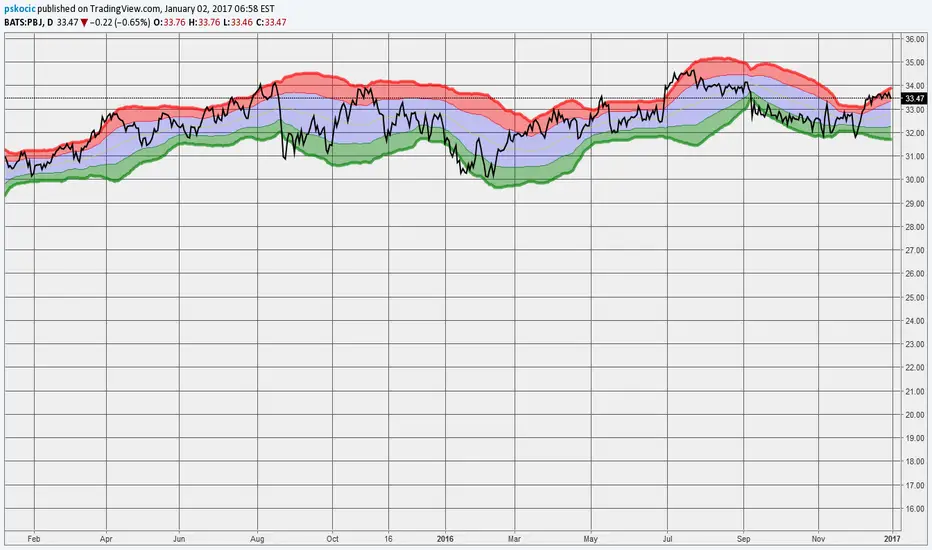
Displays a symbol's price movements over previous years to identify recurring trends.
Related funds
Frequently Asked Questions
An exchange-traded fund (ETF) is a collection of assets (stocks, bonds, commodities, etc.) that track an underlying index and can be bought on an exchange like individual stocks.
PBJ trades at 47.28 USD today, its price has fallen −0.98% in the past 24 hours. Track more dynamics on PBJ price chart.
PBJ net asset value is 47.62 today — it's risen 0.22% over the past month. NAV represents the total value of the fund's assets less liabilities and serves as a gauge of the fund's performance.
PBJ assets under management is 103.42 M USD. AUM is an important metric as it reflects the fund's size and can serve as a gauge of how successful the fund is in attracting investors, which, in its turn, can influence decision-making.
PBJ price has risen by 0.59% over the last month, and its yearly performance shows a 2.32% increase. See more dynamics on PBJ price chart.
NAV returns, another gauge of an ETF dynamics, have risen by 0.22% over the last month, showed a 5.65% increase in three-month performance and has increased by 4.04% in a year.
NAV returns, another gauge of an ETF dynamics, have risen by 0.22% over the last month, showed a 5.65% increase in three-month performance and has increased by 4.04% in a year.
PBJ fund flows account for −17.78 M USD (1 year). Many traders use this metric to get insight into investors' sentiment and evaluate whether it's time to buy or sell the fund.
Since ETFs work like an individual stock, they can be bought and sold on exchanges (e.g. NASDAQ, NYSE, EURONEXT). As it happens with stocks, you need to select a brokerage to access trading. Explore our list of available brokers to find the one to help execute your strategies. Don't forget to do your research before getting to trading. Explore ETFs metrics in our ETF screener to find a reliable opportunity.
PBJ invests in stocks. See more details in our Analysis section.
PBJ expense ratio is 0.62%. It's an important metric for helping traders understand the fund's operating costs relative to assets and how expensive it would be to hold the fund.
No, PBJ isn't leveraged, meaning it doesn't use borrowings or financial derivatives to magnify the performance of the underlying assets or index it follows.
In some ways, ETFs are safe investments, but in a broader sense, they're not safer than any other asset, so it's crucial to analyze a fund before investing. But if your research gives a vague answer, you can always refer to technical analysis.
Today, PBJ technical analysis shows the neutral rating and its 1-week rating is buy. Since market conditions are prone to changes, it's worth looking a bit further into the future — according to the 1-month rating PBJ shows the buy signal. See more of PBJ technicals for a more comprehensive analysis.
Today, PBJ technical analysis shows the neutral rating and its 1-week rating is buy. Since market conditions are prone to changes, it's worth looking a bit further into the future — according to the 1-month rating PBJ shows the buy signal. See more of PBJ technicals for a more comprehensive analysis.
Yes, PBJ pays dividends to its holders with the dividend yield of 1.40%.
PBJ trades at a premium (0.02%).
Premium/discount to NAV expresses the difference between the ETF’s price and its NAV value. A positive percentage indicates a premium, meaning the ETF trades at a higher price than the calculated NAV. Conversely, a negative percentage indicates a discount, suggesting the ETF trades at a lower price than NAV.
Premium/discount to NAV expresses the difference between the ETF’s price and its NAV value. A positive percentage indicates a premium, meaning the ETF trades at a higher price than the calculated NAV. Conversely, a negative percentage indicates a discount, suggesting the ETF trades at a lower price than NAV.
PBJ shares are issued by Invesco Ltd.
PBJ follows the Dynamic Food & Beverage Intellidex Index (AMEX). ETFs usually track some benchmark seeking to replicate its performance and guide asset selection and objectives.
The fund started trading on Jun 23, 2005.
The fund's management style is passive, meaning it's aiming to replicate the performance of the underlying index by holding assets in the same proportions as the index. The goal is to match the index's returns.