Rare Earth UpdateTo provide an update on why I went long Rare Earth. I noticed the after hours move up on MP materials, at 20% increase before market open which quickly became a 50% move when trading started. This particular ETF holds MP Material as a major holding and it hadn't moved much as it should have. I poste
Key stats
About VanEck Rare Earth and Strategic Metals ETF
Home page
Inception date
Oct 27, 2010
Structure
Open-Ended Fund
Replication method
Physical
Dividend treatment
Distributes
Distribution tax treatment
Qualified dividends
Income tax type
Capital Gains
Max ST capital gains rate
39.60%
Max LT capital gains rate
20.00%
Primary advisor
Van Eck Associates Corp.
Distributor
Van Eck Securities Corp.
REMX targets an obscure part of the mining marketrare earths metalswhich means it only covers a very thin slice of our global mining benchmark. The fund invests in the largest and most liquid companies that generate at least 50% of their revenues from the global rare earth and strategic metals segment, and has significant exposure to small- and micro-caps and emerging-market issuersthe firms you typically find producing cerium, manganese, titanium, and tungsten. REMX's narrow portfolio holds just a handful of names, selected and weighted by market cap, with a cap of 8% per issuer to ensure diversification. The index is rebalanced quarterly. Prior to May 6, 2024, the '/' in the fund name has been replaced with 'and'.
Related funds
Classification
What's in the fund
Exposure type
Non-Energy Minerals
Process Industries
Stock breakdown by region
Top 10 holdings
REMX Long - Buy and hold tradeThe price of ETF REMX is increasing fast on high volume. This is one of the best signs to buy. In this situation I prefer a buy and hold trade. Just my personal view - no financial advice!

RARE EARTH : Energy burnHello, what'sup ?
Me nothing.
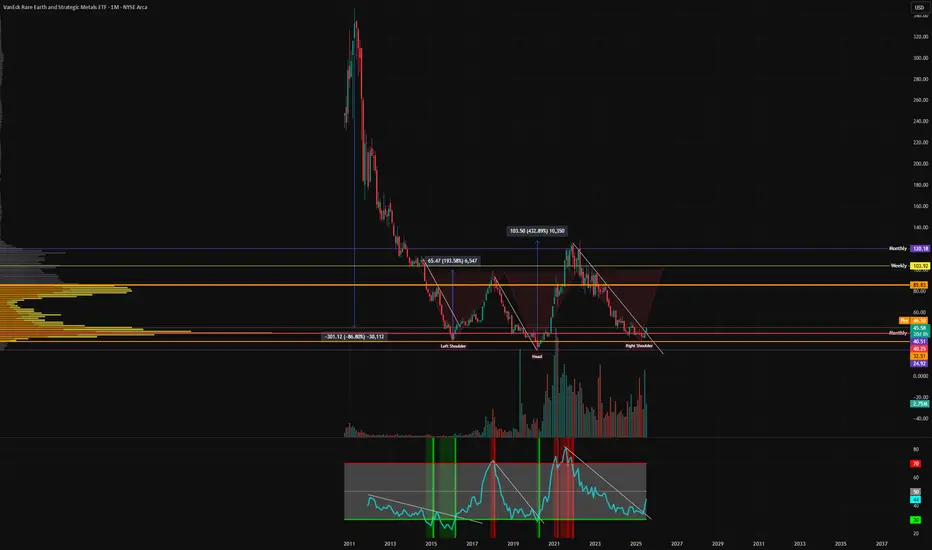
Ok so, we have a good call here, 10 years of accumulation.
MASSIVE H&S inverted. Target 142 dollars : 250% if you enter at 49 dollars.
Dollars is weak, they print it again. Don't lose your money in bank.
Good luck

Long REMX (Rare Earth/Strategic Metals ETF)hi traders,
1. The chart shows REMX has experienced a significant downtrend since late 2021/early 2022, reaching levels last seen around 2020.
2. Entry Strategy (Green Box):
The idea is to enter long positions as the price approaches or bounces from this established support area, anticipating a re
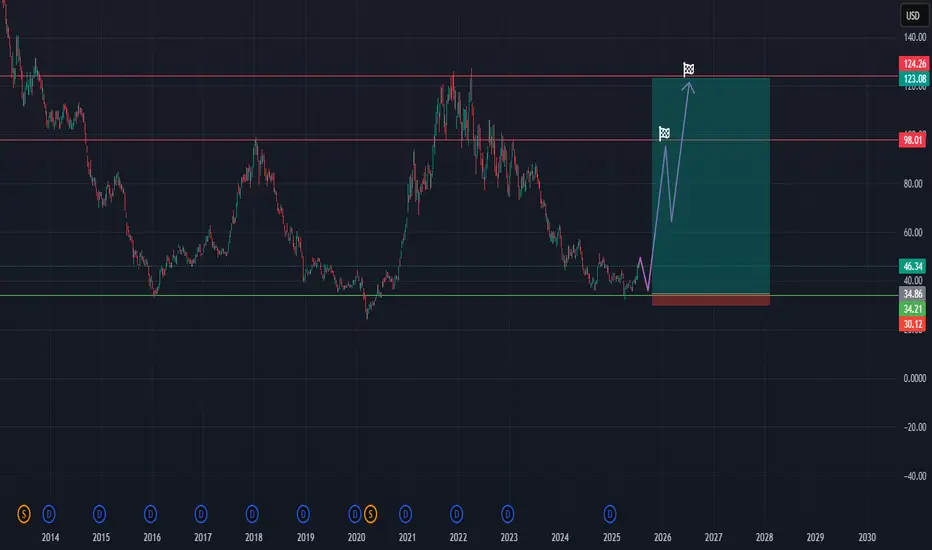
Rare Earth super cycle ?If we clear $43 and hold this level, this thing could fly. I’m not going to go too much into this but don’t be surprised if we get an aggressive move up. Not financial advice

REMX 88.7RIt seems like REMX has finally bottomed and therefore could be ready to start it’s bull market any moment now.
This is an 88.7 R trade.
Probability of success 50%
Risk to reward rating 8/10
Overall rating 7.5/10
I have only given the risk to reward rating an 8 as this trade is likely to take a

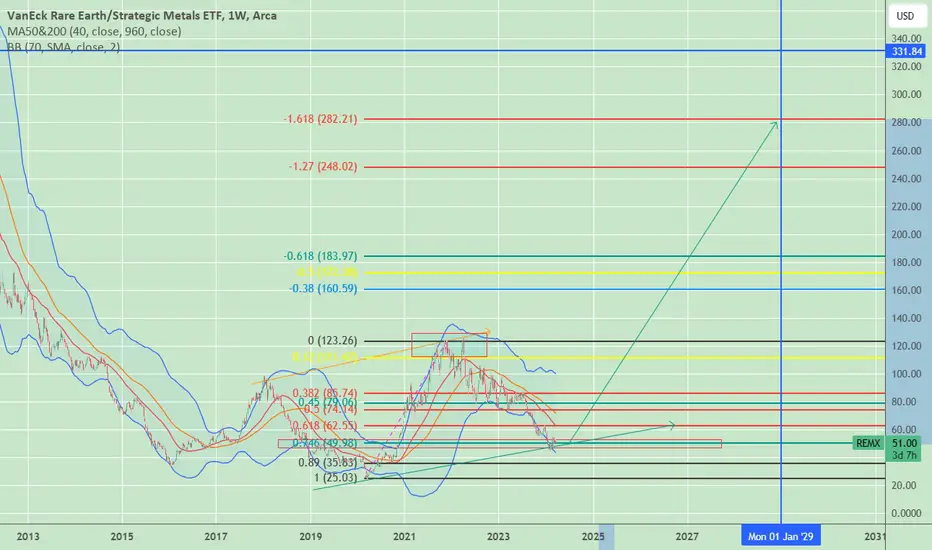
REMX bouncing from important FIB levelREMX might have found a bottom withing the Golden Window based on Fib Trend based extension. Early signs are promising.

Trading Idea: Buying the VanEck Vectors Rare Earth/Strategic MetIntroduction
The VanEck Vectors Rare Earth/Strategic Metals (REMX) ETF is a US-based fund focused on rare metals and strategic resources that play an important role in the development of high technologies. REMX repeats the performance of the MVIS Rare Earth/Strategic Metals index. The fund invests

RARE EARTHSHow strange do you feel today?
Let's talk about rare earths.
These types of elements of the periodic table are difficult to pronounce but at least easy to locate because they were in a little square outside.
We will need them for chips, electric car batteries and capacitors.
So after this great drop
REMX Rare Metals ETFOn the 4H chart the price is rising above support and the recent bottom.
On the MACD indicator, the lines have risen above the zero line and
over the positive histogram. The moving average "Williams Alligator"
combination shows divergence with the short period MA rising the
fastest. On the vo

See all ideas
Summarizing what the indicators are suggesting.
Oscillators
Neutral
SellBuy
Strong sellStrong buy
Strong sellSellNeutralBuyStrong buy
Oscillators
Neutral
SellBuy
Strong sellStrong buy
Strong sellSellNeutralBuyStrong buy
Summary
Neutral
SellBuy
Strong sellStrong buy
Strong sellSellNeutralBuyStrong buy
Summary
Neutral
SellBuy
Strong sellStrong buy
Strong sellSellNeutralBuyStrong buy
Summary
Neutral
SellBuy
Strong sellStrong buy
Strong sellSellNeutralBuyStrong buy
Moving Averages
Neutral
SellBuy
Strong sellStrong buy
Strong sellSellNeutralBuyStrong buy
Moving Averages
Neutral
SellBuy
Strong sellStrong buy
Strong sellSellNeutralBuyStrong buy
Displays a symbol's price movements over previous years to identify recurring trends.
Frequently Asked Questions
An exchange-traded fund (ETF) is a collection of assets (stocks, bonds, commodities, etc.) that track an underlying index and can be bought on an exchange like individual stocks.
REMX trades at 49.36 USD today, its price has risen 0.28% in the past 24 hours. Track more dynamics on REMX price chart.
REMX net asset value is 49.35 today — it's risen 22.15% over the past month. NAV represents the total value of the fund's assets less liabilities and serves as a gauge of the fund's performance.
REMX assets under management is 530.49 M USD. AUM is an important metric as it reflects the fund's size and can serve as a gauge of how successful the fund is in attracting investors, which, in its turn, can influence decision-making.
REMX price has risen by 21.52% over the last month, and its yearly performance shows a 17.62% increase. See more dynamics on REMX price chart.
NAV returns, another gauge of an ETF dynamics, have risen by 22.15% over the last month, showed a 29.32% increase in three-month performance and has increased by 21.04% in a year.
NAV returns, another gauge of an ETF dynamics, have risen by 22.15% over the last month, showed a 29.32% increase in three-month performance and has increased by 21.04% in a year.
REMX fund flows account for 173.57 M USD (1 year). Many traders use this metric to get insight into investors' sentiment and evaluate whether it's time to buy or sell the fund.
Since ETFs work like an individual stock, they can be bought and sold on exchanges (e.g. NASDAQ, NYSE, EURONEXT). As it happens with stocks, you need to select a brokerage to access trading. Explore our list of available brokers to find the one to help execute your strategies. Don't forget to do your research before getting to trading. Explore ETFs metrics in our ETF screener to find a reliable opportunity.
REMX invests in stocks. See more details in our Analysis section.
REMX expense ratio is 0.58%. It's an important metric for helping traders understand the fund's operating costs relative to assets and how expensive it would be to hold the fund.
No, REMX isn't leveraged, meaning it doesn't use borrowings or financial derivatives to magnify the performance of the underlying assets or index it follows.
In some ways, ETFs are safe investments, but in a broader sense, they're not safer than any other asset, so it's crucial to analyze a fund before investing. But if your research gives a vague answer, you can always refer to technical analysis.
Today, REMX technical analysis shows the buy rating and its 1-week rating is neutral. Since market conditions are prone to changes, it's worth looking a bit further into the future — according to the 1-month rating REMX shows the neutral signal. See more of REMX technicals for a more comprehensive analysis.
Today, REMX technical analysis shows the buy rating and its 1-week rating is neutral. Since market conditions are prone to changes, it's worth looking a bit further into the future — according to the 1-month rating REMX shows the neutral signal. See more of REMX technicals for a more comprehensive analysis.
Yes, REMX pays dividends to its holders with the dividend yield of 2.03%.
REMX trades at a premium (0.03%).
Premium/discount to NAV expresses the difference between the ETF’s price and its NAV value. A positive percentage indicates a premium, meaning the ETF trades at a higher price than the calculated NAV. Conversely, a negative percentage indicates a discount, suggesting the ETF trades at a lower price than NAV.
Premium/discount to NAV expresses the difference between the ETF’s price and its NAV value. A positive percentage indicates a premium, meaning the ETF trades at a higher price than the calculated NAV. Conversely, a negative percentage indicates a discount, suggesting the ETF trades at a lower price than NAV.
REMX shares are issued by Van Eck Associates Corp.
REMX follows the MVIS Global Rare Earth/Strategic Metals. ETFs usually track some benchmark seeking to replicate its performance and guide asset selection and objectives.
The fund started trading on Oct 27, 2010.
The fund's management style is passive, meaning it's aiming to replicate the performance of the underlying index by holding assets in the same proportions as the index. The goal is to match the index's returns.