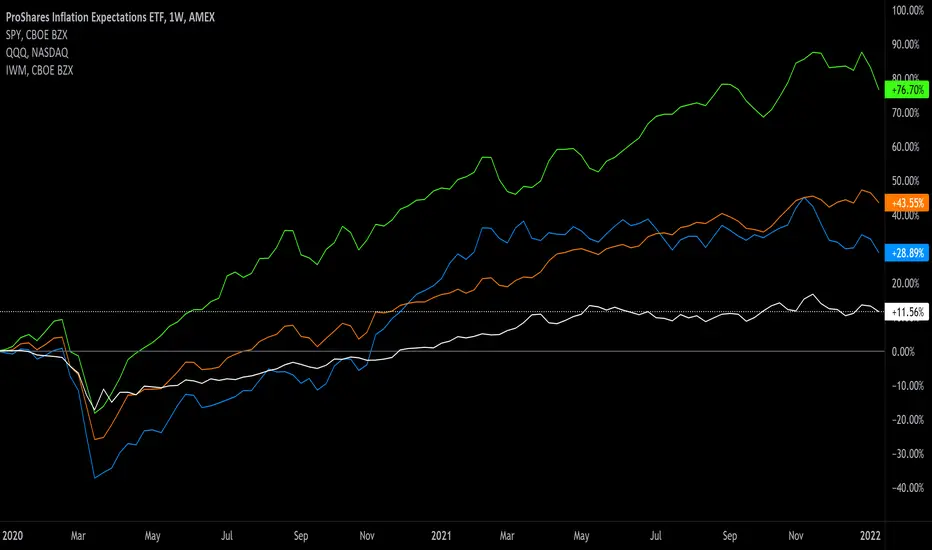
Inflation expectations (RINF) don't match US inflationI think market sentiment is overly negative. Expectations for inflation is as high as in Q4 2022 when inflation was very high in the US. I expect RINF to be lower by the end of the year than it is today. That is bullish for stocks.
If the interest rates go up further then this will finally harm em
Key stats
About ProShares Inflation Expectations ETF
Home page
Inception date
Jan 10, 2012
Structure
Open-Ended Fund
Replication method
Synthetic
Dividend treatment
Distributes
Distribution tax treatment
Ordinary income
Income tax type
Capital Gains
Max ST capital gains rate
39.60%
Max LT capital gains rate
20.00%
Primary advisor
ProShare Advisors LLC
Distributor
SEI Investments Distribution Co.
RINF provides investors with a way to gain from increases in the market`s expectation of inflation. All else equal, Treasury yields will rise relative to TIPS (Treasury inflation-protected securities) yields when market participants expect more inflation. Since yields and returns move inversely, RINF goes long TIPS and short Treasurys of similar maturity to capture this spread. One key facet of this approach is that it only gains when the spread changes when the market changes its mind. It provides no gains whatsoever if the market`s expectation of inflation stays the same, and it will lose if spreads tighten. Still, such an approach would presumably hold some appeal in an era of extremely loose monetary policy. Prior to Apr. 18, 2016 RINF tracked the Credit Suisse 30-Year Inflation Breakeven Index under the name ProShares 30 Year TIPS/TSY Spread. The index change is not expected to have a material impact on the investment objective.
Related funds
Classification
What's in the fund
Exposure type
Cash
Bonds, Cash & Other100.00%
Cash100.00%
Top 10 holdings

Inflation ExpectationsInflation Expectations.
BULLISH, but also VOLATILE chart pattern morphing into existence.
#gold #silver #uranium #crudeoil #inflation
Momentum as defined by distance from 3 year moving average
fomo target 22% above 36 month sma

The Fresh Print of Wall StreetNow, this is a story all about how
My rates got flipped-turned upside down
And I'd like to take a minute Just sit right there
I'll tell you how I became the fresh print of a town called Wall Street
In West Chicago born and raised
On the bond market was where I spent most of my days
Chillin' out, ma

The Fed does not have a credibility problem....Powell said. Well, 10Y yields are moving up explosively and the reason is rising inflation expectations.

Inflation expectationsInflation expectations comparison chart: I wanted to put this up ahead of Federal Reserve Chair Jerome Powell's appearance before the Senate Banking Committee today at 10am. The focus for the hearing is in regard to the rising prices assumed to correlate with inflation from the exaggerated quantitat

Monetary stimulus have their consequencesGood morning,
Inflation comes with a delay but don't worry it will come, and your pocket will suffer from it.
Stimulus are not free, like anything else.
Take profit of the bullish market while it still runs and the interest rates are near zero. But be aware of inflation.
Good luck!!

Inflation ExpectationsWow, what a move. March close will be soo telling. This is where it plays for silver.

RINF -- aiming to retest 2019 and 2018 highsLooks like RINF inflation expectations are seemingly unstoppable presently. Are we going to retest the late 2018 highs?

InflationInflation Expectations Monthly Linear Chart
Key notes:
thinning cloud resistance
above 1&3 year sma
bullish divergence with macd

See all ideas
Summarizing what the indicators are suggesting.
Oscillators
Neutral
SellBuy
Strong sellStrong buy
Strong sellSellNeutralBuyStrong buy
Oscillators
Neutral
SellBuy
Strong sellStrong buy
Strong sellSellNeutralBuyStrong buy
Summary
Neutral
SellBuy
Strong sellStrong buy
Strong sellSellNeutralBuyStrong buy
Summary
Neutral
SellBuy
Strong sellStrong buy
Strong sellSellNeutralBuyStrong buy
Summary
Neutral
SellBuy
Strong sellStrong buy
Strong sellSellNeutralBuyStrong buy
Moving Averages
Neutral
SellBuy
Strong sellStrong buy
Strong sellSellNeutralBuyStrong buy
Moving Averages
Neutral
SellBuy
Strong sellStrong buy
Strong sellSellNeutralBuyStrong buy
Displays a symbol's price movements over previous years to identify recurring trends.
Frequently Asked Questions
An exchange-traded fund (ETF) is a collection of assets (stocks, bonds, commodities, etc.) that track an underlying index and can be bought on an exchange like individual stocks.
RINF trades at 33.08 USD today, its price has fallen −0.45% in the past 24 hours. Track more dynamics on RINF price chart.
RINF net asset value is 33.06 today — it's risen 1.26% over the past month. NAV represents the total value of the fund's assets less liabilities and serves as a gauge of the fund's performance.
RINF assets under management is 25.09 M USD. AUM is an important metric as it reflects the fund's size and can serve as a gauge of how successful the fund is in attracting investors, which, in its turn, can influence decision-making.
RINF price has risen by 1.15% over the last month, and its yearly performance shows a 1.41% increase. See more dynamics on RINF price chart.
NAV returns, another gauge of an ETF dynamics, have risen by 1.26% over the last month, showed a 1.99% increase in three-month performance and has increased by 1.99% in a year.
NAV returns, another gauge of an ETF dynamics, have risen by 1.26% over the last month, showed a 1.99% increase in three-month performance and has increased by 1.99% in a year.
RINF fund flows account for 3.16 M USD (1 year). Many traders use this metric to get insight into investors' sentiment and evaluate whether it's time to buy or sell the fund.
Since ETFs work like an individual stock, they can be bought and sold on exchanges (e.g. NASDAQ, NYSE, EURONEXT). As it happens with stocks, you need to select a brokerage to access trading. Explore our list of available brokers to find the one to help execute your strategies. Don't forget to do your research before getting to trading. Explore ETFs metrics in our ETF screener to find a reliable opportunity.
RINF invests in cash. See more details in our Analysis section.
RINF expense ratio is 0.30%. It's an important metric for helping traders understand the fund's operating costs relative to assets and how expensive it would be to hold the fund.
No, RINF isn't leveraged, meaning it doesn't use borrowings or financial derivatives to magnify the performance of the underlying assets or index it follows.
In some ways, ETFs are safe investments, but in a broader sense, they're not safer than any other asset, so it's crucial to analyze a fund before investing. But if your research gives a vague answer, you can always refer to technical analysis.
Today, RINF technical analysis shows the buy rating and its 1-week rating is buy. Since market conditions are prone to changes, it's worth looking a bit further into the future — according to the 1-month rating RINF shows the strong buy signal. See more of RINF technicals for a more comprehensive analysis.
Today, RINF technical analysis shows the buy rating and its 1-week rating is buy. Since market conditions are prone to changes, it's worth looking a bit further into the future — according to the 1-month rating RINF shows the strong buy signal. See more of RINF technicals for a more comprehensive analysis.
Yes, RINF pays dividends to its holders with the dividend yield of 4.06%.
RINF trades at a premium (0.04%).
Premium/discount to NAV expresses the difference between the ETF’s price and its NAV value. A positive percentage indicates a premium, meaning the ETF trades at a higher price than the calculated NAV. Conversely, a negative percentage indicates a discount, suggesting the ETF trades at a lower price than NAV.
Premium/discount to NAV expresses the difference between the ETF’s price and its NAV value. A positive percentage indicates a premium, meaning the ETF trades at a higher price than the calculated NAV. Conversely, a negative percentage indicates a discount, suggesting the ETF trades at a lower price than NAV.
RINF shares are issued by ProShare Advisors LLC
RINF follows the FTSE 30-Year TIPS (Treasury Rate-Hedged) Index. ETFs usually track some benchmark seeking to replicate its performance and guide asset selection and objectives.
The fund started trading on Jan 10, 2012.
The fund's management style is passive, meaning it's aiming to replicate the performance of the underlying index by holding assets in the same proportions as the index. The goal is to match the index's returns.