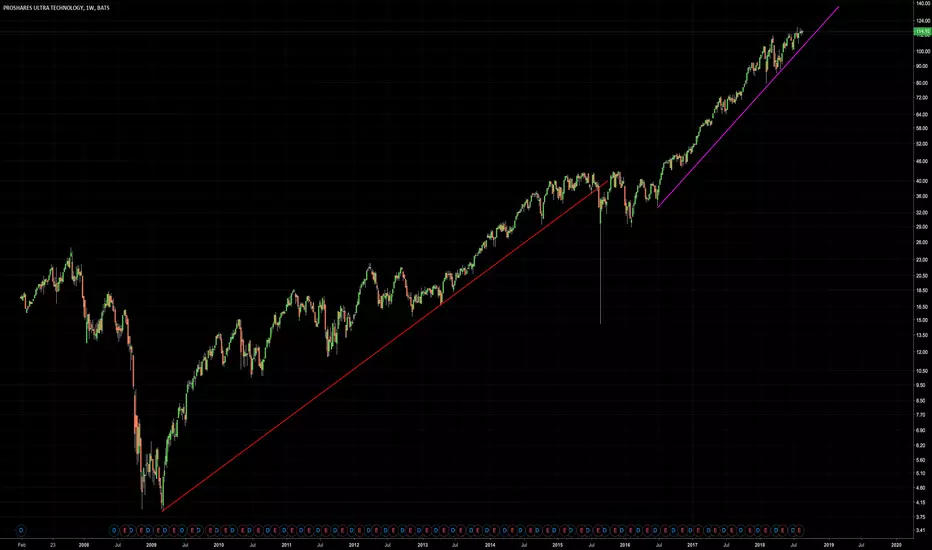
ROM - Nice healthy Uptrend. ProShares Ultra Technology (ROM)ProShares Ultra Technology (ROM)
Double
Healthy UpTrend. Red line since 2008 to 2015.
Sideways consolidation around 2015.
Pink UpTrend line from 2016-present.
ProShares Ultra Technology seeks daily investment results, before fees and expenses, that correspond to two times (2x) the daily perform
Key stats
About ProShares Ultra Technology
Home page
Inception date
Jan 30, 2007
Structure
Open-Ended Fund
Replication method
Synthetic
Dividend treatment
Distributes
Distribution tax treatment
Ordinary income
Income tax type
Capital Gains
Max ST capital gains rate
39.60%
Max LT capital gains rate
20.00%
Primary advisor
ProShare Advisors LLC
Distributor
SEI Investments Distribution Co.
ROM provides 2x levered exposure to the S&P Technology Select Sector Index, with daily leverage resets. Like all levered funds, it tends to underperform in volatile markets if held for longer than its reset period, and is more suitable for short-term trading positions. The underlying index is market-cap weighted and typically includes companies engaged in IT services, software, communications equipment, technology, hardware, storage & peripherals, electronic equipment, instruments, & components, and semiconductors & semiconductor equipment. The fund reflects the concentrated nature of a space dominated by the tech industry leaders selected and weighted by market cap. Prior to March 20, 2023, the fund provided exposure to the Dow Jones U.S. Technology Index.
Related funds
Classification
What's in the fund
Exposure type
Electronic Technology
Technology Services
Cash
Stock breakdown by region
Top 10 holdings
Summarizing what the indicators are suggesting.
Oscillators
Neutral
SellBuy
Strong sellStrong buy
Strong sellSellNeutralBuyStrong buy
Oscillators
Neutral
SellBuy
Strong sellStrong buy
Strong sellSellNeutralBuyStrong buy
Summary
Neutral
SellBuy
Strong sellStrong buy
Strong sellSellNeutralBuyStrong buy
Summary
Neutral
SellBuy
Strong sellStrong buy
Strong sellSellNeutralBuyStrong buy
Summary
Neutral
SellBuy
Strong sellStrong buy
Strong sellSellNeutralBuyStrong buy
Moving Averages
Neutral
SellBuy
Strong sellStrong buy
Strong sellSellNeutralBuyStrong buy
Moving Averages
Neutral
SellBuy
Strong sellStrong buy
Strong sellSellNeutralBuyStrong buy
Displays a symbol's price movements over previous years to identify recurring trends.
Frequently Asked Questions
An exchange-traded fund (ETF) is a collection of assets (stocks, bonds, commodities, etc.) that track an underlying index and can be bought on an exchange like individual stocks.
ROM trades at 77.95 USD today, its price has risen 0.59% in the past 24 hours. Track more dynamics on ROM price chart.
ROM net asset value is 78.75 today — it's risen 14.21% over the past month. NAV represents the total value of the fund's assets less liabilities and serves as a gauge of the fund's performance.
ROM assets under management is 743.70 M USD. AUM is an important metric as it reflects the fund's size and can serve as a gauge of how successful the fund is in attracting investors, which, in its turn, can influence decision-making.
ROM price has risen by 14.62% over the last month, and its yearly performance shows a 2.58% increase. See more dynamics on ROM price chart.
NAV returns, another gauge of an ETF dynamics, have risen by 14.21% over the last month, showed a 55.68% increase in three-month performance and has increased by 5.25% in a year.
NAV returns, another gauge of an ETF dynamics, have risen by 14.21% over the last month, showed a 55.68% increase in three-month performance and has increased by 5.25% in a year.
ROM fund flows account for −74.08 M USD (1 year). Many traders use this metric to get insight into investors' sentiment and evaluate whether it's time to buy or sell the fund.
Since ETFs work like an individual stock, they can be bought and sold on exchanges (e.g. NASDAQ, NYSE, EURONEXT). As it happens with stocks, you need to select a brokerage to access trading. Explore our list of available brokers to find the one to help execute your strategies. Don't forget to do your research before getting to trading. Explore ETFs metrics in our ETF screener to find a reliable opportunity.
ROM invests in stocks. See more details in our Analysis section.
ROM expense ratio is 0.95%. It's an important metric for helping traders understand the fund's operating costs relative to assets and how expensive it would be to hold the fund.
Yes, ROM is a leveraged ETF, meaning it uses borrowings or financial derivatives to magnify the performance of the underlying assets or index it follows.
In some ways, ETFs are safe investments, but in a broader sense, they're not safer than any other asset, so it's crucial to analyze a fund before investing. But if your research gives a vague answer, you can always refer to technical analysis.
Today, ROM technical analysis shows the buy rating and its 1-week rating is buy. Since market conditions are prone to changes, it's worth looking a bit further into the future — according to the 1-month rating ROM shows the strong buy signal. See more of ROM technicals for a more comprehensive analysis.
Today, ROM technical analysis shows the buy rating and its 1-week rating is buy. Since market conditions are prone to changes, it's worth looking a bit further into the future — according to the 1-month rating ROM shows the strong buy signal. See more of ROM technicals for a more comprehensive analysis.
Yes, ROM pays dividends to its holders with the dividend yield of 0.33%.
ROM trades at a premium (0.07%).
Premium/discount to NAV expresses the difference between the ETF’s price and its NAV value. A positive percentage indicates a premium, meaning the ETF trades at a higher price than the calculated NAV. Conversely, a negative percentage indicates a discount, suggesting the ETF trades at a lower price than NAV.
Premium/discount to NAV expresses the difference between the ETF’s price and its NAV value. A positive percentage indicates a premium, meaning the ETF trades at a higher price than the calculated NAV. Conversely, a negative percentage indicates a discount, suggesting the ETF trades at a lower price than NAV.
ROM shares are issued by ProShare Advisors LLC
ROM follows the Technology Select Sector Index. ETFs usually track some benchmark seeking to replicate its performance and guide asset selection and objectives.
The fund started trading on Jan 30, 2007.
The fund's management style is passive, meaning it's aiming to replicate the performance of the underlying index by holding assets in the same proportions as the index. The goal is to match the index's returns.