SP500 but equal weighted and in a strong CHF currencythis is the much much better index to follow as it isnt swayed by 10% moves in tesla or NVIDIA and also isnt tricked by USD dollar devaluation ;)
this is the real international index to follow
RSP trade ideas
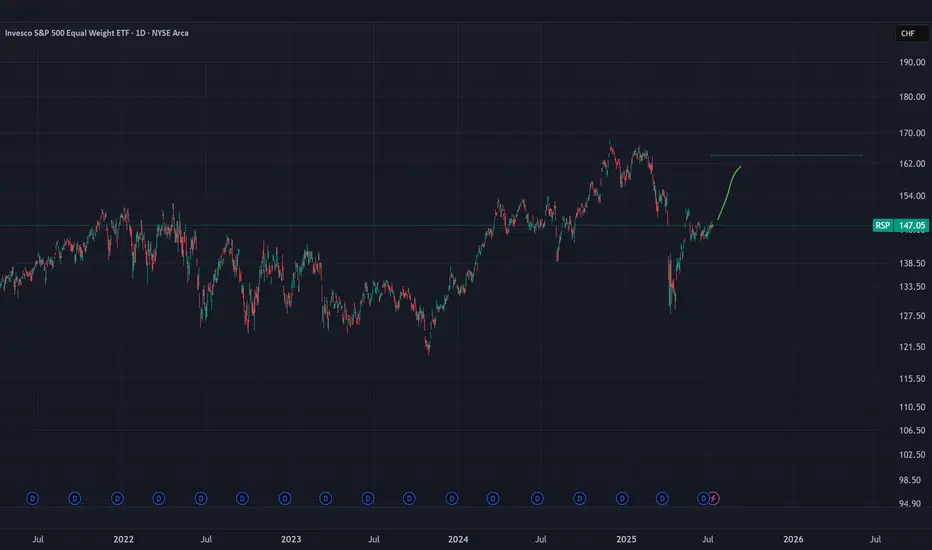
Longterm S&P 500 Equal weight.The long-term Elliott Wave pattern appears to be approaching completion, and primary Wave 5 could be an ending diagonal.
This formation suggests a significant reversal down to the start of the E.D, which would be around the COVID low. This would be only be Wave A in a larger bearish pattern.

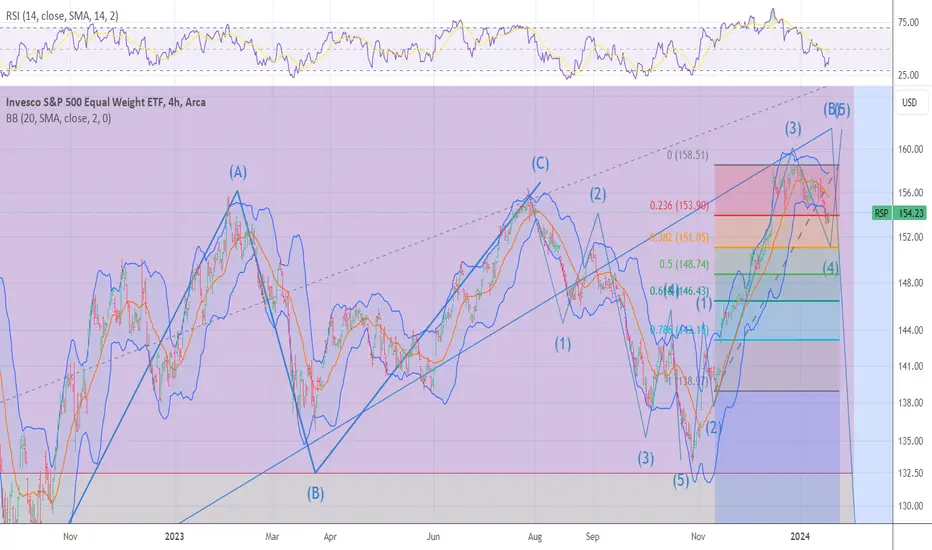
I'm betting on the rise of the S\&P 500, therefore I'm betting oWe broke through the local level and are confidently moving toward the all-time high.
We are also above all moving averages, which gives us additional confidence in our trade.

RSP Spiral cycle peak 5/16 EXIT The chart posted is the RSP SP 500 EQUAL WEIGHTED the two high based on spirals are due to peak on Friday late . We should have a short term top and the begin a pullback for wave 4 . Best of trades WAVETIMER

Market OutlookMarkets looking a little over extended and would be normal to see a pull back soon before resuming to the upside.

Selling America - Buying EUThis is a long term trend analyzing the US market from the perspective of foreign investors. Not valuing the S&P500 500 in USD. Instead, valuing the S&P500 in multiplies of the European Stoxx 600. A multi-year trend of the US outperforming the EU has been broken.

#RSP and a simple parallel channel give a hope for the next weekHi there!
What a ride! I believe it’s a good thing that the market is closed for the weekend—I need to recharge my battery.
Today's thoughts:
If we draw a parallel channel on #RSP, which is equally structured by weight, we can observe that the price has touched the lower line.
This means that, theoretically, the price could hold here and reverse in the next week (or weeks), as it did in October 2023. Alternatively, it may not hold and could move down further, similar to what happened in 2020.
My point here is that the hysterical sell-off is near its end. The question remains: how much more pain will the Bulls endure before the reversal begins?
Happy weekend!

RSP and WHY I AM BULLISH STILL197/199 target The chart posted is the sp 500 equal weighted RSP has dropped to a trend line dated back to march 23 2020 . I have three clean points and all are major . Elliot Wave calls for a final 5th wave to end this advance in the area of 198 plus or minus 1.25 Fib relationship and PUT /CALL as well as most of my spiral and cycles point to the final advance to a Bull market top is now setup . BULL MARKETS TOP ON GOOD NEWS > Best of trades WAVETIMER

Time for equal weight?Seems to be that the equal weight S&P is going to breakout against the S&P. An outperformance of rsp is essentially a value vs growth trade. We will see in the coming weeks how this plays out

Market Going UPWe have been doing a cup and handle pattern for a long time...
The RSP shows you what the general market is doing unweighted and less distorted.
We have been experiencing much downfalls in the previous weeks in the BIG STOCKS,
but the rest of the market was not impacted...
This means...
Someone painted the market red... while buying the whole market...
Volume also seems to confirm more bullish bias than bearish bias.


RSP/SPYRSP equal weighted SP500 broke above downtrend line and has been consolidating bullishly. Market breadth is expanding, which is good for long term, however, mega caps may be under performing going forward.

Gap Fill Incoming Likely on RSPIf we take out last Fridays candle this gap fill would be the next actionable trade on AMEX:RSP aka Equal Weight AMEX:SPY

US Markets Cleared For A 13% to 24% Rally - Get SomeThis video highlights why I believe the US markets are ready to make a big move higher over the next 12 to 24+ months.
Many people suggest the markets will crack or crash, or we will experience some black/grey swan event. I'm afraid I have to disagree with this belief.
Yes, there is always a chance we will see some market event. However, to disrupt the US/global economy, there would have to be some event that disrupts the world, not just one or two smaller countries.
I do believe the US is making a broad transition into the 21st century, and new leadership (Govt) is required to make that happen.
But I also believe the seeds have been planted for exponential growth over the next 10-20+ years - and many traders are too focused on the crash dummies to see the real potential.
Watch this video. Share your comments if you like.
I believe we will see pullbacks and rotations on the way up - but I don't think we'll see any big crash event until after 2031 (or later).
Get some. This is going to be BIG.
#trading #research #investing #tradingalgos #tradingsignals #cycles #fibonacci #elliotwave #modelingsystems #stocks #bitcoin #btcusd #cryptos #spy #es #nq #gold

Is it a HS? RSP SPX equal weightHS pattern on the making? Would confirm if neckline is broken to the downside.

What is RSP telling us about this market ? For the longest, analyst were not convinced of the market strength although market was making new highs. This is because in their opinion the market was being led by a handful of stocks and the broader market was not participating in this uptrend.
Today we have RSP, the equal weighted S&P 500 index breaking out of a triangle and looking set on claiming new highs. So what's the Difference between SPY and RSP ? I'm glad you asked :)
SPY is a cap weighted index meaning that the companies with the highest (smallest) market cap hold more (less) weight in the Index and while the equal weighted means each companies have the same weight (2% in the RSP). As of June 21st 2024 (that'll work for the explanation)
MSFT 7.19%
NVDA 7.01%
APPL 6.61%
AMZN 3.69%
Totaling 24.5% in the SPY. In the RSP they would each have a weight of 2% totaling 8%. Great, but what does that mean ? This means that large caps have less power and small and mid caps have more influence in the RSP than in SPY. So RSP breaking out might potentially signal that small and mid cap companies are on the move.
Fundamentally this could be due to the fact that if rates come down, the smaller companies who rely more on debt might face less financial pressure and increase their bottom line.
So its good to keep our eyes open on the smaller companies.
This is not a call to action nor a recommendation but more of an idea im throwing out there.
Cheers,

S&P 500 Equal Weight ETF P-like waveObservation:
The S&P 500 Equal Weight ETF has been consolidating since April 2024. The price will enter the apex of consolidation in July through August, coiling for a breakout at that time; if not, the market will delay until US elections in November.
Daily view:
Daily consolidating since April 2024.
P-like wave
Weekly view:
Weekly pullback to the box of 2022.
Weekly flag pole
Comment:
Patience and sitting on hands in a bull market trend...

Shorting the trend line break on RSP. You can see that RSP has lost touch with it's trend line, including its buffer zone. Furthermore, the DTL buffer zone wasn't even tested on the the Adam and Eve double top. Volume has been above average, validating distribution. Seems likely to test the double top neckline.

Cap weighted vs Equal Weight SPY at ExtremesAre the times when the cap wtd S&P500 is crushing the EW AMEX:SPY also the times when AMEX:SPY is most vulnerable? At present, you would have to go back to Q1 2009 to find a simliar ratio to today (using AMEX:RSP as the EW SPY in comparison to AMEX:SPY ). Another period when this extreme was reached was 2020.

RSP is now in wave 5 as stated it should The chart posted is the RSP index for the SP 500 equal weight index . last week I said it needed to rally still in a 5th up. I am waiting for confirmation of the End of the 5th .It is a 5 wave rally as I said at the oct low major short squeeze . I do see this as the end of wave B just above the 2022 top . This is the bearish wave count.. The Alt would then see this rally to end on april 2nd for the end of a bigger wave 3 top all wave counts show a very deep and sharp break is now just ahead NEXT DATE is MAY 2could we see a sharp drop into april 10/12 and then rally ??? will we see sell in may and go away ?? . Best of Trades WAVETIMER

RSP - Equally Weighted S&P 500 ETF Long RSP for an expansion in Market Breadth
I think one of the most interesting developments today is that the RSP is breaking higher.
Since the beginning of '24 there has been bad breadth and thin leadership. Now the RSP is above its Feb Value Area and above recent highs. I particularly like the consolidation before this push higher.
My intermediate target using the MarketWebs Indicator is $165.9, which is an extension away from this months Value Area

RSP ready to ROCK N ROLL target 161.84All models are in very very deep over sold and the NYSI is nearing the 500 area this is what I had hoped for . the markets are now ready to Squeeze the last of shorts and trap most every bull on this next move . The NYSI will setup a perfect NON -CONFIRMATION
RSP performing better than $SPX, good news for breadthThe AMEX:SPY is underperforming AMEX:RSP (equal weight SP:SPX ).
This means that underperformers could very well pick up the slack & outperform the Big 7 going forward. They have been performing well.
The Volatility Index TVC:VIX is down on the day BUT up from open.
Will the moving avg's push it lower or do we get some sort of support here? This is a MAJOR SUPPORT level!
TVC:VIX rarely gets close to oversold, let alone oversold.
AMEX:SPXS AMEX:SPXL #stocks
