SCO Stock Chart Fibonacci Analysis 051425Trading Idea
1) Find a FIBO slingshot
2) Check FIBO 61.80% level
3) Entry Point > 19.2/61.80%
Chart time frame:D
A) 15 min(1W-3M)
B) 1 hr(3M-6M)
C) 4 hr(6M-1year)
D) 1 day(1-3years)
Stock progress: C
A) Keep rising over 61.80% resistance
B) 61.80% resistance
C) 61.80% support
D) Hit the bottom
Key stats
About ProShares UltraShort Bloomberg Crude Oil
Home page
Inception date
Nov 24, 2008
Structure
Commodities Pool
Replication method
Synthetic
Dividend treatment
Distributes
Distribution tax treatment
No distributions
Income tax type
60/40
Max ST capital gains rate
27.84%
Max LT capital gains rate
27.84%
Primary advisor
ProShare Advisors LLC
Distributor
SEI Investments Distribution Co.
SCO is a solid bet for investors looking for an inverse oil fund. As an inverse ETF, SCO is intended as a short-term tactical investment to be held only for its one-day exposure period, it's not appropriate for buy-and-hold investors. Daily compounding of SCO's inverse crude oil returns can lead to the fund's returns varying significantly from the intended multiple, so longer term investors must monitor and rebalance their position. SCO's futures-based index means that its returns reflect price appreciation on its futures contracts as well as any return from rolling those futures contracts. The underlying index provides exposure to three separate contracts at equal-weighting of 1/3 each. The first portion follows monthly roll schedule, while the second and third portion holds June and December contract that are rolled annually each March and September, respectively. Prior to September 16, 2020, the fund tracked the Bloomberg WTI Crude Oil Subindex.
Related funds
Classification
What's in the fund
Exposure type
Cash
Bonds, Cash & Other100.00%
Cash100.00%
Top 10 holdings

Long SCO / Short Oil WTI (Second Attempt)Limit Order Entry Fill: 21.53
Stop: 21.45
PT: 22.30
Risk to Reward (R/R): 1:9.63
Shorting Oil via SCO shares Round 2

Short Oil via SCOLimit Order Entry Fill: 22.30
Stop: 22.20
PT: 23.15
Risk to Reward (R/R): 8.5
OilWTI currently at resistance. If it breaks through resistance, we mitigate our risk with a tight stop just below the recent lows.

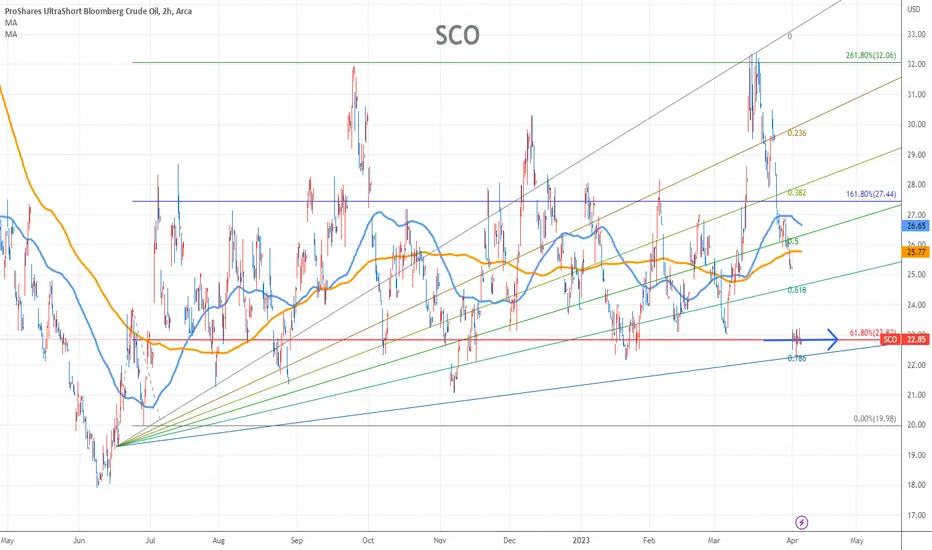
SCO Stock Chart Fibonacci Analysis 040523 Trading Idea
1) Find a FIBO slingshot
2) Check FIBO 61.80% level
3) Entry Point > 23/61.80%
Bullish on SCO - Bearish on oil & gasNow is a good time to load up on SCO. I think over the next couple of weeks it could drop 10% to 15% before really shooting up.
October and November will be a big month gas and oil.
OPAC has decidedly decreased their daily oil production by 100k barrels a day, and the U.S. has been artificially

SCO Eye spy with my little eye I see some interestCross arms buy longs pray to god, sounds good lets go.

Time to short OIL $SCO going higher$SCO has been forming a bottoming pattern for the last couple of months is about ready to break out. Upon breakout, I can see the first big target being $11.53 which would be the 50% retracement of the move.
Let's see what happens over the coming weeks.

SCO Proshares is a Buy Oil WILL decline for consolidationtest
ProShares UltraShort Bloomberg Crude Oil seeks daily investment results, before fees and expenses, that correspond to two times the inverse (-2x)
What do you think?

A Bearish Bet Against US Crude Oil PricesI will be buying some slightly ITM Calls here expiring in the middle of April in anticipation for US Oil to potentially go down by the end of the Quarter due to the Fed's monetary tightening.
The technicals look good for this Bearish ETF; Bullish Divergence visible on both the MACD and RSI and alon

My positions updatesI will explain my positions and the TA on why I bought or sold
comments welcomed

See all ideas
Summarizing what the indicators are suggesting.
Oscillators
Neutral
SellBuy
Strong sellStrong buy
Strong sellSellNeutralBuyStrong buy
Oscillators
Neutral
SellBuy
Strong sellStrong buy
Strong sellSellNeutralBuyStrong buy
Summary
Neutral
SellBuy
Strong sellStrong buy
Strong sellSellNeutralBuyStrong buy
Summary
Neutral
SellBuy
Strong sellStrong buy
Strong sellSellNeutralBuyStrong buy
Summary
Neutral
SellBuy
Strong sellStrong buy
Strong sellSellNeutralBuyStrong buy
Moving Averages
Neutral
SellBuy
Strong sellStrong buy
Strong sellSellNeutralBuyStrong buy
Moving Averages
Neutral
SellBuy
Strong sellStrong buy
Strong sellSellNeutralBuyStrong buy
Displays a symbol's price movements over previous years to identify recurring trends.
Frequently Asked Questions
An exchange-traded fund (ETF) is a collection of assets (stocks, bonds, commodities, etc.) that track an underlying index and can be bought on an exchange like individual stocks.
SCO trades at 16.42 USD today, its price has risen 5.62% in the past 24 hours. Track more dynamics on SCO price chart.
SCO net asset value is 15.44 today — it's fallen 14.34% over the past month. NAV represents the total value of the fund's assets less liabilities and serves as a gauge of the fund's performance.
SCO assets under management is 147.49 M USD. AUM is an important metric as it reflects the fund's size and can serve as a gauge of how successful the fund is in attracting investors, which, in its turn, can influence decision-making.
SCO price has fallen by −7.42% over the last month, and its yearly performance shows a 0.67% increase. See more dynamics on SCO price chart.
NAV returns, another gauge of an ETF dynamics, have risen by −14.34% over the last month, have fallen by −14.34% over the last month, showed a −29.38% decrease in three-month performance and has decreased by −13.33% in a year.
NAV returns, another gauge of an ETF dynamics, have risen by −14.34% over the last month, have fallen by −14.34% over the last month, showed a −29.38% decrease in three-month performance and has decreased by −13.33% in a year.
SCO fund flows account for −37.73 M USD (1 year). Many traders use this metric to get insight into investors' sentiment and evaluate whether it's time to buy or sell the fund.
Since ETFs work like an individual stock, they can be bought and sold on exchanges (e.g. NASDAQ, NYSE, EURONEXT). As it happens with stocks, you need to select a brokerage to access trading. Explore our list of available brokers to find the one to help execute your strategies. Don't forget to do your research before getting to trading. Explore ETFs metrics in our ETF screener to find a reliable opportunity.
SCO invests in cash. See more details in our Analysis section.
SCO expense ratio is 0.95%. It's an important metric for helping traders understand the fund's operating costs relative to assets and how expensive it would be to hold the fund.
SCO is an inverse fund, meaning it's structured to generate returns opposite to the trends of the underlying index or assets.
In some ways, ETFs are safe investments, but in a broader sense, they're not safer than any other asset, so it's crucial to analyze a fund before investing. But if your research gives a vague answer, you can always refer to technical analysis.
Today, SCO technical analysis shows the sell rating and its 1-week rating is strong sell. Since market conditions are prone to changes, it's worth looking a bit further into the future — according to the 1-month rating SCO shows the sell signal. See more of SCO technicals for a more comprehensive analysis.
Today, SCO technical analysis shows the sell rating and its 1-week rating is strong sell. Since market conditions are prone to changes, it's worth looking a bit further into the future — according to the 1-month rating SCO shows the sell signal. See more of SCO technicals for a more comprehensive analysis.
No, SCO doesn't pay dividends to its holders.
SCO trades at a premium (0.19%).
Premium/discount to NAV expresses the difference between the ETF’s price and its NAV value. A positive percentage indicates a premium, meaning the ETF trades at a higher price than the calculated NAV. Conversely, a negative percentage indicates a discount, suggesting the ETF trades at a lower price than NAV.
Premium/discount to NAV expresses the difference between the ETF’s price and its NAV value. A positive percentage indicates a premium, meaning the ETF trades at a higher price than the calculated NAV. Conversely, a negative percentage indicates a discount, suggesting the ETF trades at a lower price than NAV.
SCO shares are issued by ProShare Advisors LLC
SCO follows the Bloomberg Commodity Balanced WTI Crude Oil Index. ETFs usually track some benchmark seeking to replicate its performance and guide asset selection and objectives.
The fund started trading on Nov 24, 2008.
The fund's management style is passive, meaning it's aiming to replicate the performance of the underlying index by holding assets in the same proportions as the index. The goal is to match the index's returns.