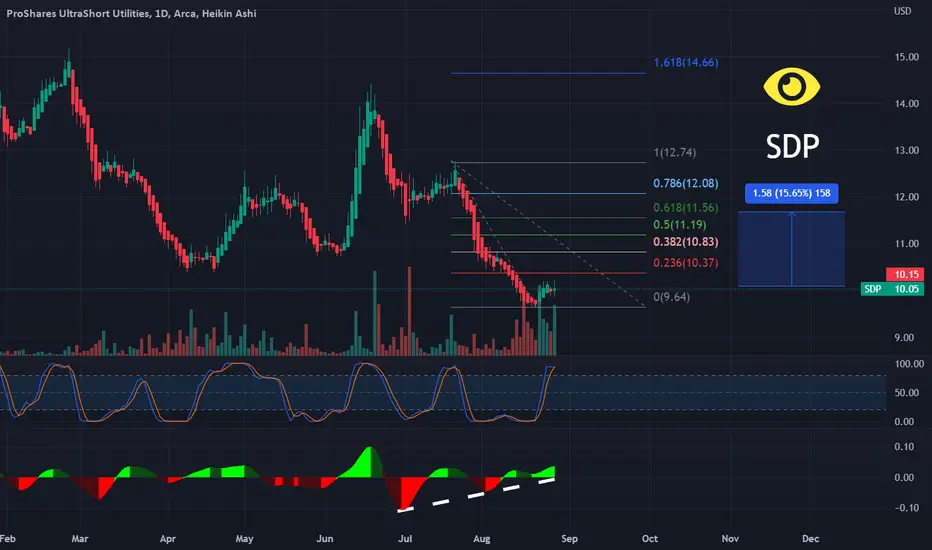
Risk-On is on the MenuInverse Head & Shoulders on UltraShort Utilities. There is a daily H&S on XLU, but look at SDP on the weekly. First time --EVER-- that you can find a bullish reversal pattern on SDP. Fewer people buying / building homes + higher energy prices. We are entering an era of being short utilities, regardl
Key stats
About ProShares UltraShort Utilities
Home page
Inception date
Jan 30, 2007
Structure
Open-Ended Fund
Replication method
Synthetic
Dividend treatment
Distributes
Distribution tax treatment
Ordinary income
Income tax type
Capital Gains
Max ST capital gains rate
39.60%
Max LT capital gains rate
20.00%
Primary advisor
ProShare Advisors LLC
Distributor
SEI Investments Distribution Co.
SDP provides -2x leveraged exposure to the S&P Utilities Select Sector Index, a market cap-weighted index of US utilities companies drawn exclusively from the S&P 500. The index includes the following GICS industries: electric, gas, water, and multi-utilities, independent power, and renewable electricity producers. SDP is designed as a short-term trading vehicle, not a long-term investment. It holds swap agreements and resets on a daily basis. As a result, compounding and path dependency make long-term returns difficult to predict when compared with the performance of its underlying index. Prior to March 20, 2023, the fund tracked the Dow Jones US Utilities Index.
Related funds
Classification
What's in the fund
Exposure type
Cash
Bonds, Cash & Other100.00%
Cash100.00%
Top 10 holdings

Time to Short Utilities - Long Inverse ETFThe fund invests in financial instruments that ProShare Advisors believes, in combination, should produce daily returns consistent with the fund's investment objective. The index is designed to measure the stock performance of U.S. companies in the utilities industry. The fund is non-diversified.
$SDP Nice bounce if you took it last week's chart.That volume bounce played out here, kudos to those that took the play.
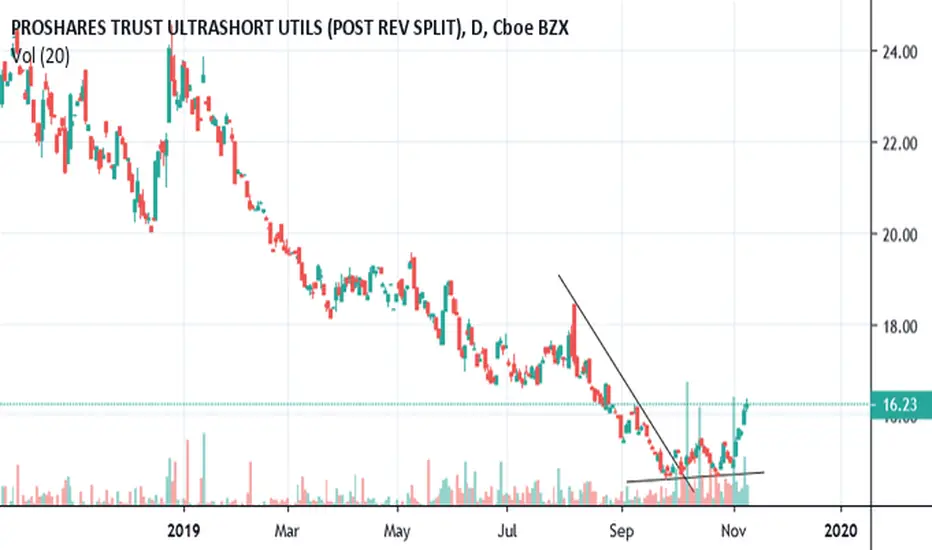
$SDP A lot of buy volume down here, will be interesting to watchThe buy volume caught my eye on this one, let's see what happens.
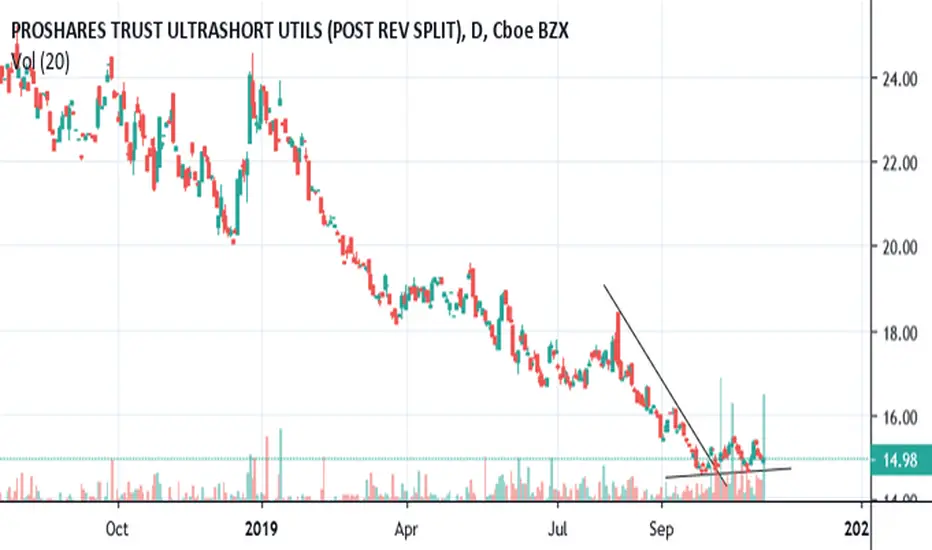
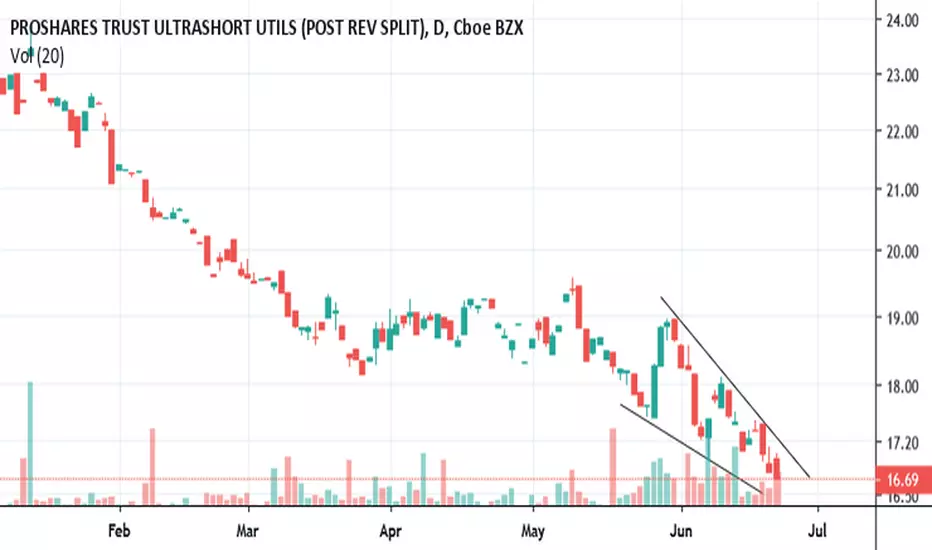
$SDP needs to bounce above that falling wedge to be bullishWill be watching for a bottoming out doji on this one
$SDP will be watching, needs to stay above bottom trend This one needs to stay above the bottom trend, otherwise lower prices coming.


See all ideas
Summarizing what the indicators are suggesting.
Oscillators
Neutral
SellBuy
Strong sellStrong buy
Strong sellSellNeutralBuyStrong buy
Oscillators
Neutral
SellBuy
Strong sellStrong buy
Strong sellSellNeutralBuyStrong buy
Summary
Neutral
SellBuy
Strong sellStrong buy
Strong sellSellNeutralBuyStrong buy
Summary
Neutral
SellBuy
Strong sellStrong buy
Strong sellSellNeutralBuyStrong buy
Summary
Neutral
SellBuy
Strong sellStrong buy
Strong sellSellNeutralBuyStrong buy
Moving Averages
Neutral
SellBuy
Strong sellStrong buy
Strong sellSellNeutralBuyStrong buy
Moving Averages
Neutral
SellBuy
Strong sellStrong buy
Strong sellSellNeutralBuyStrong buy
Displays a symbol's price movements over previous years to identify recurring trends.
Frequently Asked Questions
An exchange-traded fund (ETF) is a collection of assets (stocks, bonds, commodities, etc.) that track an underlying index and can be bought on an exchange like individual stocks.
SDP trades at 12.31 USD today, its price has fallen −0.63% in the past 24 hours. Track more dynamics on SDP price chart.
SDP net asset value is 12.71 today — it's fallen 8.17% over the past month. NAV represents the total value of the fund's assets less liabilities and serves as a gauge of the fund's performance.
SDP assets under management is 2.38 M USD. AUM is an important metric as it reflects the fund's size and can serve as a gauge of how successful the fund is in attracting investors, which, in its turn, can influence decision-making.
SDP price has fallen by −10.52% over the last month, and its yearly performance shows a −30.69% decrease. See more dynamics on SDP price chart.
NAV returns, another gauge of an ETF dynamics, have fallen by −8.17% over the last month, showed a −13.35% decrease in three-month performance and has decreased by −29.34% in a year.
NAV returns, another gauge of an ETF dynamics, have fallen by −8.17% over the last month, showed a −13.35% decrease in three-month performance and has decreased by −29.34% in a year.
SDP fund flows account for 2.13 M USD (1 year). Many traders use this metric to get insight into investors' sentiment and evaluate whether it's time to buy or sell the fund.
Since ETFs work like an individual stock, they can be bought and sold on exchanges (e.g. NASDAQ, NYSE, EURONEXT). As it happens with stocks, you need to select a brokerage to access trading. Explore our list of available brokers to find the one to help execute your strategies. Don't forget to do your research before getting to trading. Explore ETFs metrics in our ETF screener to find a reliable opportunity.
SDP invests in cash. See more details in our Analysis section.
SDP expense ratio is 0.95%. It's an important metric for helping traders understand the fund's operating costs relative to assets and how expensive it would be to hold the fund.
SDP is an inverse fund, meaning it's structured to generate returns opposite to the trends of the underlying index or assets.
In some ways, ETFs are safe investments, but in a broader sense, they're not safer than any other asset, so it's crucial to analyze a fund before investing. But if your research gives a vague answer, you can always refer to technical analysis.
Today, SDP technical analysis shows the strong sell rating and its 1-week rating is strong sell. Since market conditions are prone to changes, it's worth looking a bit further into the future — according to the 1-month rating SDP shows the strong sell signal. See more of SDP technicals for a more comprehensive analysis.
Today, SDP technical analysis shows the strong sell rating and its 1-week rating is strong sell. Since market conditions are prone to changes, it's worth looking a bit further into the future — according to the 1-month rating SDP shows the strong sell signal. See more of SDP technicals for a more comprehensive analysis.
Yes, SDP pays dividends to its holders with the dividend yield of 4.77%.
SDP trades at a premium (0.20%).
Premium/discount to NAV expresses the difference between the ETF’s price and its NAV value. A positive percentage indicates a premium, meaning the ETF trades at a higher price than the calculated NAV. Conversely, a negative percentage indicates a discount, suggesting the ETF trades at a lower price than NAV.
Premium/discount to NAV expresses the difference between the ETF’s price and its NAV value. A positive percentage indicates a premium, meaning the ETF trades at a higher price than the calculated NAV. Conversely, a negative percentage indicates a discount, suggesting the ETF trades at a lower price than NAV.
SDP shares are issued by ProShare Advisors LLC
SDP follows the Utilities Select Sector Index. ETFs usually track some benchmark seeking to replicate its performance and guide asset selection and objectives.
The fund started trading on Jan 30, 2007.
The fund's management style is passive, meaning it's aiming to replicate the performance of the underlying index by holding assets in the same proportions as the index. The goal is to match the index's returns.