Key stats
About US Global Sea to Sky Cargo ETF
Home page
Inception date
Jan 20, 2022
Structure
Open-Ended Fund
Replication method
Physical
Dividend treatment
Distributes
Distribution tax treatment
Qualified dividends
Income tax type
Capital Gains
Max ST capital gains rate
39.60%
Max LT capital gains rate
20.00%
Primary advisor
US Global Investors, Inc. (Asset Management)
Distributor
Quasar Distributors LLC
SEA is passively managed to track an index of sea and sky cargo companies from around the world, including emerging markets. The fund utilizes a tiered weighting scheme that combines fundamental factors that tilts more towards sea cargo (marine shipping and port/harbor companies) over sky (freight/courier companies). Sea cargo stocks comprise 70% of the portfolio, while sky cargo stocks make up 30%. Stocks selected are assigned composite scores that are based on rankings derived from fundamental factors. Sea cargo companies are weighted in three tiers based on composite scores and market size. The top sea cargo stocks are allocated percentages: 5% for the top six, 4% for the next seven, and 2% for the next six. Each of the 10 top-ranked sky cargo stocks get 2% of weighting allocation. The index is reconstituted and rebalanced quarterly.
Classification
What's in the fund
Exposure type
Transportation
Stock breakdown by region
Top 10 holdings
No news here
Looks like there's nothing to report right now


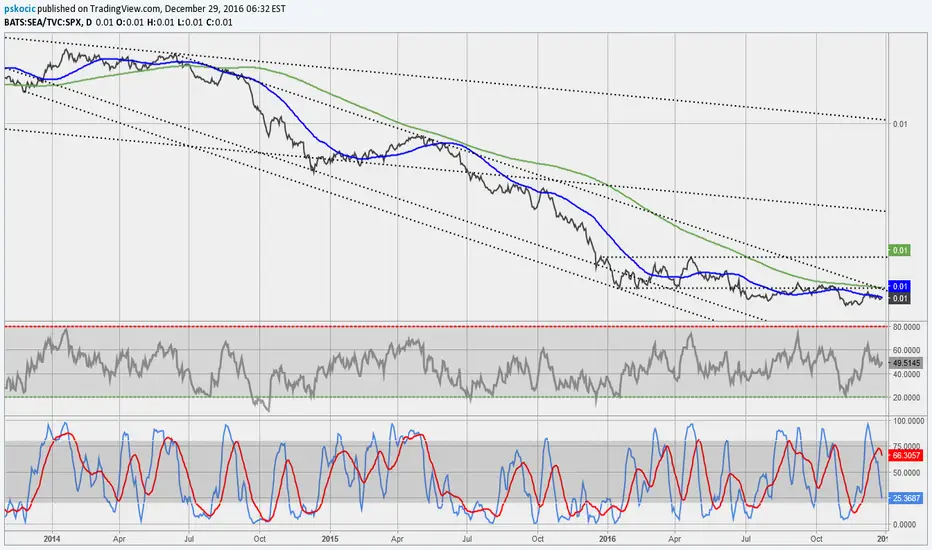
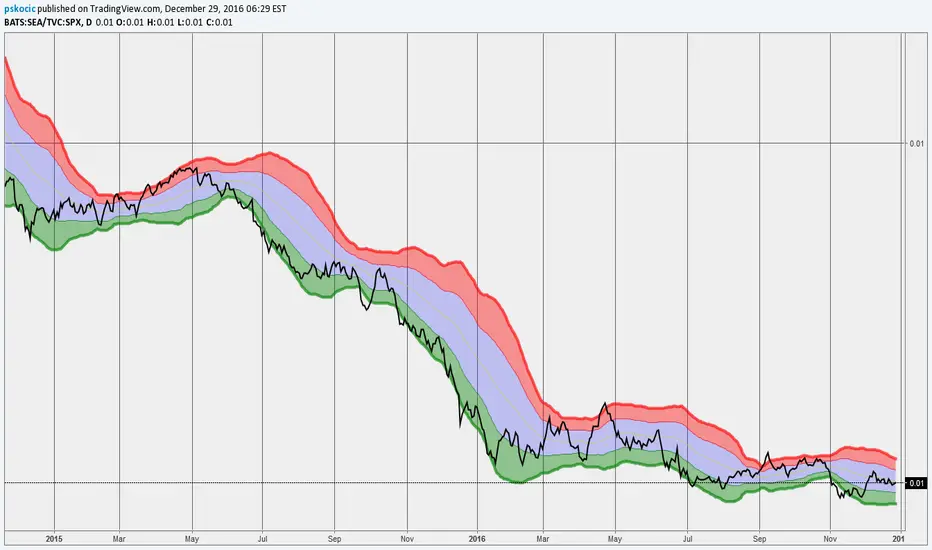
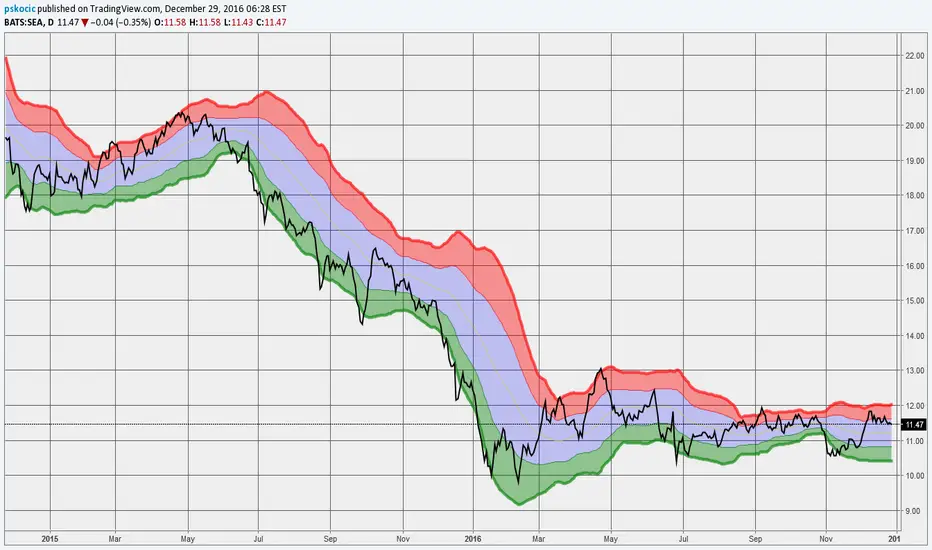
SEA, can these tankers lead crude oil back to profitability?I don't think i need to explain in detail why Shipping is such a risky business compare to other form.
Let us start by looking at SEA - Guggenheim Shipping ETFs. This ETFs tracks the performance of the major holdings such as TNK, FRO, TNP, NAT & etc.
As usual, i will start my analysis by using JUS


See all ideas
Summarizing what the indicators are suggesting.
Oscillators
Neutral
SellBuy
Strong sellStrong buy
Strong sellSellNeutralBuyStrong buy
Oscillators
Neutral
SellBuy
Strong sellStrong buy
Strong sellSellNeutralBuyStrong buy
Summary
Neutral
SellBuy
Strong sellStrong buy
Strong sellSellNeutralBuyStrong buy
Summary
Neutral
SellBuy
Strong sellStrong buy
Strong sellSellNeutralBuyStrong buy
Summary
Neutral
SellBuy
Strong sellStrong buy
Strong sellSellNeutralBuyStrong buy
Moving Averages
Neutral
SellBuy
Strong sellStrong buy
Strong sellSellNeutralBuyStrong buy
Moving Averages
Neutral
SellBuy
Strong sellStrong buy
Strong sellSellNeutralBuyStrong buy
Displays a symbol's price movements over previous years to identify recurring trends.
Frequently Asked Questions
An exchange-traded fund (ETF) is a collection of assets (stocks, bonds, commodities, etc.) that track an underlying index and can be bought on an exchange like individual stocks.
SEA trades at 14.84 USD today, its price has risen 1.91% in the past 24 hours. Track more dynamics on SEA price chart.
SEA net asset value is 14.54 today — it's risen 1.61% over the past month. NAV represents the total value of the fund's assets less liabilities and serves as a gauge of the fund's performance.
SEA assets under management is 8.77 M USD. AUM is an important metric as it reflects the fund's size and can serve as a gauge of how successful the fund is in attracting investors, which, in its turn, can influence decision-making.
SEA price has risen by 3.13% over the last month, and its yearly performance shows a −10.20% decrease. See more dynamics on SEA price chart.
NAV returns, another gauge of an ETF dynamics, showed a 10.24% increase in three-month performance and has increased by 4.90% in a year.
NAV returns, another gauge of an ETF dynamics, showed a 10.24% increase in three-month performance and has increased by 4.90% in a year.
SEA fund flows account for 2.37 M USD (1 year). Many traders use this metric to get insight into investors' sentiment and evaluate whether it's time to buy or sell the fund.
Since ETFs work like an individual stock, they can be bought and sold on exchanges (e.g. NASDAQ, NYSE, EURONEXT). As it happens with stocks, you need to select a brokerage to access trading. Explore our list of available brokers to find the one to help execute your strategies. Don't forget to do your research before getting to trading. Explore ETFs metrics in our ETF screener to find a reliable opportunity.
SEA invests in stocks. See more details in our Analysis section.
SEA expense ratio is 0.60%. It's an important metric for helping traders understand the fund's operating costs relative to assets and how expensive it would be to hold the fund.
No, SEA isn't leveraged, meaning it doesn't use borrowings or financial derivatives to magnify the performance of the underlying assets or index it follows.
In some ways, ETFs are safe investments, but in a broader sense, they're not safer than any other asset, so it's crucial to analyze a fund before investing. But if your research gives a vague answer, you can always refer to technical analysis.
Today, SEA technical analysis shows the strong buy rating and its 1-week rating is buy. Since market conditions are prone to changes, it's worth looking a bit further into the future — according to the 1-month rating SEA shows the neutral signal. See more of SEA technicals for a more comprehensive analysis.
Today, SEA technical analysis shows the strong buy rating and its 1-week rating is buy. Since market conditions are prone to changes, it's worth looking a bit further into the future — according to the 1-month rating SEA shows the neutral signal. See more of SEA technicals for a more comprehensive analysis.
Yes, SEA pays dividends to its holders with the dividend yield of 16.51%.
SEA trades at a premium (0.15%).
Premium/discount to NAV expresses the difference between the ETF’s price and its NAV value. A positive percentage indicates a premium, meaning the ETF trades at a higher price than the calculated NAV. Conversely, a negative percentage indicates a discount, suggesting the ETF trades at a lower price than NAV.
Premium/discount to NAV expresses the difference between the ETF’s price and its NAV value. A positive percentage indicates a premium, meaning the ETF trades at a higher price than the calculated NAV. Conversely, a negative percentage indicates a discount, suggesting the ETF trades at a lower price than NAV.
SEA shares are issued by U.S. Global Investors, Inc.
SEA follows the U.S. Global Sea to Sky Cargo Index - Benchmark TR Gross. ETFs usually track some benchmark seeking to replicate its performance and guide asset selection and objectives.
The fund started trading on Jan 20, 2022.
The fund's management style is passive, meaning it's aiming to replicate the performance of the underlying index by holding assets in the same proportions as the index. The goal is to match the index's returns.