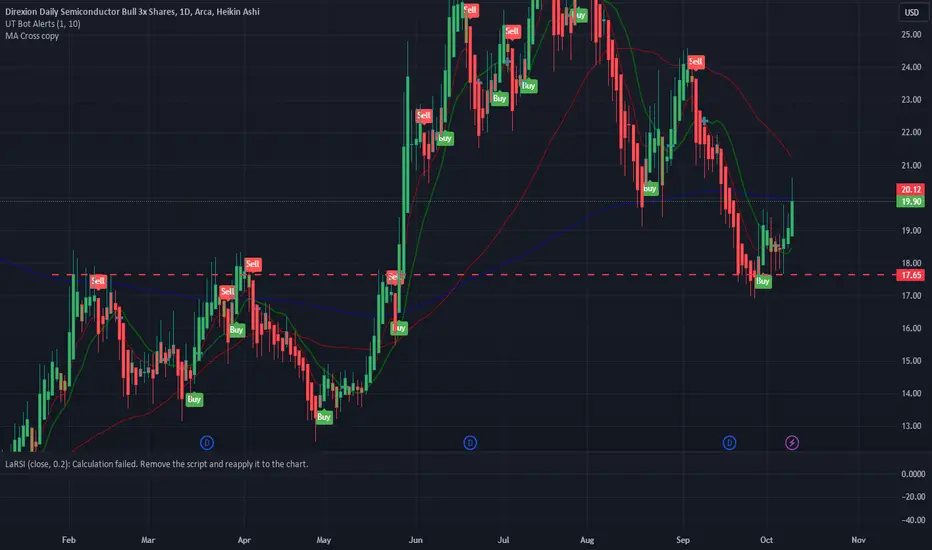
Porabulas, Hyperbole and Cup and HandleThis pattern looks like a good cup handle set up. Also, risk aversion, overblown rate cut bets retracement, Yen BOJ holds rates but likely not hike in spite of inflation out of fear of disrupting the markets after so long without actual non-monetary engineered inflation from actual productivity after nearly 30 years after exploding countries debt in the 90s where the Nikkei lost 75% of its value AKA "the lost decade" more like lost decades finally coming full circle but not complete as with the retirement of BOJ Governor Kokoda Kato windowmaker monetary policy announcements and his legacy of "Yield Curve Control" "YTC" should end that last country with , still, negative yields, but wont do so until geopolitical risks subside out of fear affecting the us treasury markets causing correspond 10 year treasury yields, to in turn, put up rates at a time when 60% of the US treasury debt roll-over locking in higher interest rates at a time when US debt is at a critical unsustainable projecting and with the Democrats pulling all stops to try and keep trump including but not limited using a congress and administrative majority (won on questionable term without a proper investigation in spite of concrete evidence. And, with a Democrat controlled congress killing the China deal, canceling two biggest oil pipelines that would have allowed China to substitute oil for coal reducing global carbon emit by 30% reportedly (Bloomberg), with the market already pricing in 6 rate cuts 2024 is overbought and is especially vulnerable so they may hold rates for a while, thus yen weakness and dollar strength make YEN doubly LONG but reaching range limits ("ATR") based on BOJ but also technical indicator "Average true Range" or ATR chart technical signal indicator.
Note : Since we don't drive a car by looking in the rear view mirror, past performance does not guarantee future results. Educational and Informative is the post's objective (Not "Advice"). For "advice" consult an Advisor of an Adviser or someone qualified.
SOXL trade ideas

SOXL/SOXS Week of Jan 8This has been my go to for day trades.
Sharing the levels for next week.
Safe trades!

$SOXLLooks to be setting up for a monster move on the weekly. Holds all top Semi conductors such as AMD and NVDIA! 3X LEVERED BULL

SOXL - Semi leveraged ETF setting up
A lot of big semi names have reported great earnings and have had positive reactions.
Took out VMA and 200 EMEA yesterday on a good volume. Follow through to 22 is likely.
I would look consolidation below for new pivot.
PA favors EOD run up to 28 and new weekly zone for next ER.
No position yet, but keeping close eye for entry.

SOXL - Falling Trend Channel [MID-TERM]💡 Pattern: Falling Wedge
💡 RSI: 57 Neutral
💡 Risk: Extreme
✅ Resistance: 28.4
✅ Support: 22
PERFORMANCE
🔴 ST: NEGATIVE
🟢 MT: POSITIVE
🟢 LT: POSITIVE
*ST: Short-term | MT: Mid-term | LT: Long-term
Verify it first and believe later.
WavePoint ❤️

SOXL Bear call at 27 strikeSymbol SOXL
Open Date 11/14/2023
Put or Call Call
Expiry Date 12/29/2023
Short Strike 27
Long Strike 29
Price to Open 0.25
Min Width Multiple 3
Risk Ratio 7.00
Return on Risk 14.3%
Opening DTE 45
1 Day ROI% 0.32%
Max Annual ROI % 115.9%
SOXL hitting +1 sig on the declining model.
The thought is that the previous seller at +1 sig returns with some capital and stalls enough time.
The +2 sig is up in front of 25, so I'm back at 27 on the short strike Yellow box.
Went a little wider on this one so there's more dance floor to move around if things go offsides.
The QQQ and SPY are big gap up today and screaming higher toward my Bear Calls.
Nothing says rally like the promise of massive money printing.
As soon as I sold 0.25 on limit after having 0.26 for 15 mins unfilled, the very next trade was .27. Yay!! for Shit fills.

SOXL- A good buy entryI see a chance to buy the dip at SOXL with many supports:
- Key level.
- Demand Zone.
- Fibo at golden zone 0.618.
- Candles support.

SOXL ready to runLooks like SOXL is ready to run. Notice the previous highs are now support. SOXL made a turn higher at that horizontal line. Also have a MA cross over.
SOXL Stock Chart Fibonacci Analysis 092523 Trading Idea
1) Find a FIBO slingshot
2) Check FIBO 61.80% level
3) Entry Point > 17.4/61.80%
Chart time frame : B
A) 15 min(1W-3M)
B) 1 hr(3M-6M)
C) 4 hr(6M-1year)
D) 1 day(1-3years)
Stock progress : c
A) Keep rising over 61.80% resistance
B) 61.80% resistance
C) Hit the bottom
D) Hit the top
Stocks rise as they rise from support and fall from resistance. Our goal is to find a low support point and enter. It can be referred to as buying at the pullback point. The pullback point can be found with a Fibonacci extension of 61.80%. This is a step to find entry level. 1) Find a triangle (Fibonacci Speed Fan Line) that connects the high (resistance) and low (support) points of the stock in progress, where it is continuously expressed as a Slingshot, 2) and create a Fibonacci extension level for the first rising wave from the start point of slingshot pattern.
When the current price goes over 61.80% level , that can be a good entry point, especially if the SMA 100 and 200 curves are gathered together at 61.80%, it is a very good entry point.
As a great help, tradingview provide these Fibonacci speed fan lines and extension levels with ease. So if you use the Fibonacci fan line, the extension level, and the SMA 100/200 curve well, you can find an entry point for the stock market. At least you have to enter at this low point to avoid trading failure, and if you are skilled at entering this low point, with fibonacci6180 technique, your reading skill to chart will be greatly improved.
If you want to do day trading, please set the time frame to 5 minutes or 15 minutes, and you will see many of the low point of rising stocks.
If want to prefer long term range trading, you can set the time frame to 1 hr or 1 day.

SOXL Long Week of 9/11/23SOXL rejected off the strong purple dashed weekly hold level last week. That has opened up 3 good target's for trades this week.

Week of 9/10/23 - SOXL LongSOXL is set up for an easy 7% gain. If price is not rejected at the 4hr hold level then i could see price going up and retesting the daily break level a solid red line where the 14% marker ends.

SOXL LongSOXL has formed a double bottom and these are the two targets for a breakout of this trading range.


SOXL Stock Chart Fibonacci Analysis 080323 Trading idea - EntryTrading Idea
1) Find a FIBO slingshot
2) Check FIBO 61.80% level
3) Entry Point > 25.1/61.80%
Chart time frame : B
A) 15 min(1W-3M)
B) 1 hr(3M-6M)
C) 4 hr(6M-1year)
D) 1 day(1-3years)
Stock progress : A
A) Keep rising over 61.80% resistance
B) 61.80% resistance
C) Hit the bottom
D) Hit the top
Stocks rise as they rise from support and fall from resistance. Our goal is to find a low support point and enter. It can be referred to as buying at the pullback point. The pullback point can be found with a Fibonacci extension of 61.80%. This is a step to find entry level. 1) Find a triangle (Fibonacci Speed Fan Line) that connects the high (resistance) and low (support) points of the stock in progress, where it is continuously expressed as a Slingshot, 2) and create a Fibonacci extension level for the first rising wave from the start point of slingshot pattern.
When the current price goes over 61.80% level , that can be a good entry point, especially if the SMA 100 and 200 curves are gathered together at 61.80%, it is a very good entry point.
As a great help, tradingview provide these Fibonacci speed fan lines and extension levels with ease. So if you use the Fibonacci fan line, the extension level, and the SMA 100/200 curve well, you can find an entry point for the stock market. At least you have to enter at this low point to avoid trading failure, and if you are skilled at entering this low point, with fibonacci6180 technique, your reading skill to chart will be greatly improved.
If you want to do day trading, please set the time frame to 5 minutes or 15 minutes, and you will see many of the low point of rising stocks.
If want to prefer long term range trading, you can set the time frame to 1 hr or 1 day.

Soxl channel trading, stillSo far soxl continues to channel trade as anticipated. Currently resistance around 28.50. Without a breakout we'll continue to channel trade.

SOXL Stock Chart Fibonacci Analysis 070823 Trading Idea
1) Find a FIBO slingshot
2) Check FIBO 61.80% level
3) Entry Point > 23.3/61.80%
Chart time frame : B
A) 15 min(1W-3M)
B) 1 hr(3M-6M)
C) 4 hr(6M-1year)
D) 1 day(1-3years)
Stock progress : B
A) Keep rising over 61.80% resistance
B) 61.80% resistance
C) Hit the bottom
D) Hit the top
Stocks rise as they rise from support and fall from resistance. Our goal is to find a low support point and enter. It can be referred to as buying at the pullback point. The pullback point can be found with a Fibonacci extension of 61.80%. This is a step to find entry level. 1) Find a triangle (Fibonacci Speed Fan Line) that connects the high (resistance) and low (support) points of the stock in progress, where it is continuously expressed as a Slingshot, 2) and create a Fibonacci extension level for the first rising wave from the start point of slingshot pattern.
When the current price goes over 61.80% level , that can be a good entry point, especially if the SMA 100 and 200 curves are gathered together at 61.80%, it is a very good entry point.
As a great help, tradingview provide these Fibonacci speed fan lines and extension levels with ease. So if you use the Fibonacci fan line, the extension level, and the SMA 100/200 curve well, you can find an entry point for the stock market. At least you have to enter at this low point to avoid trading failure, and if you are skilled at entering this low point, with fibonacci6180 technique, your reading skill to chart will be greatly improved.
If you want to do day trading, please set the time frame to 5 minutes or 15 minutes, and you will see many of the low point of rising stocks.
If want to prefer long term range trading, you can set the time frame to 1 hr or 1 day.

Semiconductors set to cool offWeakness spotted in the Semiconductor Sector.. Bulls been buying near top of the wedge on the weekly chart. The Chart also shows prev. support, now acting as resistances. Looking to set up a swing trade short

SOXL pullback is ready to buy longSOXL the 3X leveraged ETF of semiconductor stocks has gained 145% for the first half of the
year. As shown on a 2H chart, the price has pulled back but the overall trend of HH and HL
is intact within an ascending parallel channel. Price previously touched the lower
trendline on May 24th while it touched the upper trendline May 30th and then again
June 15th. Between May 31st and June 7th it did a Fibonacci retracement. Price is presently
reversing at the lower trendline and is above the Ichimoku cloud a sign of bullish predominance.
Price is above the mean VWAP anchored to the low of May 24th another bullish sign.
The RSI indicator showing Ichimoku features has an RSI above 50 and above the cloud
affirming a bullish bias. I believe that this is setup for a long trade with about 12-15% upside in
two weeks or less for a much smaller risk. A call option trade could also be entertained
if a setup with a good delta low spread and high volume / liquidity can be found.


SOXL - Rising Trend Channel [MID TERM]🔹Breakout the rising trend up in the medium long term.
🔹Achieves target at 25.20 after breaking rectangle formation.
🔹Support at 22 and resistance at 46.
🔹Technically positive for medium-term long-term.
Chart Pattern;
🔹DT - Double Top | BEARISH | 🔴
🔹DB - Double Bottom | BULLISH | 🟢
🔹HNS - Head & Shoulder | BEARISH | 🔴
🔹REC - Rectangle | 🔵
🔹iHNS - inverse head & Shoulder | BULLISH | 🟢
Verify it first and believe later.
WavePoint ❤️

19/06/2023 Weekly Idea SOXL/WOODWeekly idea of this week is to long SOXL, short WOOD.
With Apple's announcement of vision pro in early June, I expect a rise in demand of semiconductors in the supply chain (and also in upstream industries such as metal mining/battery making). WOOD is least correlated to the upstream industries while also reported being shrinking in the latest ISM report.
Price spread is currently 0.34. We would stop loss at 10% (ie 0.31) and looking for soft 30% profit target at 0.447 (which was in Mar 2022).

Short Semiconductors by Trading SOXS LongThis chart shows the long-term ratio between SOXL/SOXS. The intent is to detect reversals
between semi-conductors long and short. At the pivot high, the price of SOXL compared with
SOXS is at its highest. With a retreat from the pivot high, the price of SOXL is retreating while
SOXS is rising. Historically in 2022 as shown on the chart, pivots were with a ratio of 1,25 to
2,35 while the low pivots were with a ratio of 0.2 to 0.6.
At present SOXL has run up and over-extended as part of the AI breakout phenomenon. The
ratio of 1.8 is in the reversal zone where SOXL price is dropping while SOXS price begins
a significant rise. At present, the mass index is above 27 and awaiting a drop below 26.5.
The second indicator rate of change (ROC) detects spikes in the SOXL /SOXS ratio presumptive
for a pivot. The last time SOXS ran up over a long term ( with SOXL turning down)
was August to October when price increased from $33 to $88 representing a 266% rise.
I see this as a prior supertrend that could now be repeated again.
In conclusion, this idea leads me to take a swing long position is SOXS which I expect to
trend up over a period of a couple of months or more.

SOXLI hope you caught my idea earlier this month, in which I explain how April chop beneath mid of the 6-23 range likely deviation before sned.
Now that we're here:
If above 19 it's sending 23, which is first quarter of the whole move.
Has plenty of gap incentive for higher between first quarter and 50% retracement (40) as well.
If we do get the pullback to 17s you know what to do, but I believe it's going to be an exciting month of June.
If above 23 it's sending 40, so long as stays above 23.
