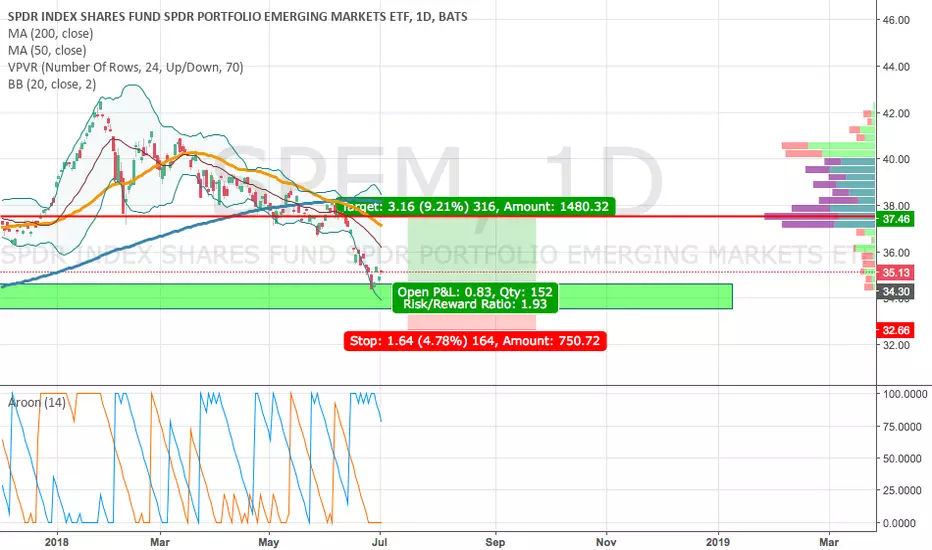
Emerging MarketsThis chart says a lot about the last 12 months and will hopefully help guide into the next 12!
Key stats
About SPDR Index Shares Fund SPDR Portfolio Emerging Markets ETF
Home page
Inception date
Mar 20, 2007
Structure
Open-Ended Fund
Replication method
Physical
Dividend treatment
Distributes
Distribution tax treatment
Qualified dividends
Income tax type
Capital Gains
Max ST capital gains rate
39.60%
Max LT capital gains rate
20.00%
Primary advisor
SSgA Funds Management, Inc.
Distributor
State Street Corp. (Fund Distributor)
SPEM invests in securities and ADRs/GDRs of companies domiciled in emerging markets, excluding South Korea, as it considers this to be a developed market (a different perspective taken up by many funds in this space). SSgA fund management uses a sampling method to provide exposure. This means the fund may not hold all the stocks of the index but a representative collection of securities resulting in a similar investment profile. Stocks selected are weighted proportionally to their float-adjusted market capitalization. The Index is reconstituted annually in September and rebalances quarterly to allow for the inclusion of eligible initial public offerings. Prior to October 16, 2017 the fund traded under the name SPDR S&P Emerging Market and ticker (GMM).
Related funds
Classification
What's in the fund
Exposure type
Finance
Electronic Technology
Stock breakdown by region
Top 10 holdings


Summarizing what the indicators are suggesting.
Oscillators
Neutral
SellBuy
Strong sellStrong buy
Strong sellSellNeutralBuyStrong buy
Oscillators
Neutral
SellBuy
Strong sellStrong buy
Strong sellSellNeutralBuyStrong buy
Summary
Neutral
SellBuy
Strong sellStrong buy
Strong sellSellNeutralBuyStrong buy
Summary
Neutral
SellBuy
Strong sellStrong buy
Strong sellSellNeutralBuyStrong buy
Summary
Neutral
SellBuy
Strong sellStrong buy
Strong sellSellNeutralBuyStrong buy
Moving Averages
Neutral
SellBuy
Strong sellStrong buy
Strong sellSellNeutralBuyStrong buy
Moving Averages
Neutral
SellBuy
Strong sellStrong buy
Strong sellSellNeutralBuyStrong buy
Displays a symbol's price movements over previous years to identify recurring trends.
Frequently Asked Questions
An exchange-traded fund (ETF) is a collection of assets (stocks, bonds, commodities, etc.) that track an underlying index and can be bought on an exchange like individual stocks.
SPEM trades at 43.87 USD today, its price has fallen −0.18% in the past 24 hours. Track more dynamics on SPEM price chart.
SPEM net asset value is 43.77 today — it's risen 2.90% over the past month. NAV represents the total value of the fund's assets less liabilities and serves as a gauge of the fund's performance.
SPEM assets under management is 12.83 B USD. AUM is an important metric as it reflects the fund's size and can serve as a gauge of how successful the fund is in attracting investors, which, in its turn, can influence decision-making.
SPEM price has risen by 3.61% over the last month, and its yearly performance shows a 18.06% increase. See more dynamics on SPEM price chart.
NAV returns, another gauge of an ETF dynamics, have risen by 2.90% over the last month, showed a 14.04% increase in three-month performance and has increased by 19.10% in a year.
NAV returns, another gauge of an ETF dynamics, have risen by 2.90% over the last month, showed a 14.04% increase in three-month performance and has increased by 19.10% in a year.
SPEM fund flows account for 2.04 B USD (1 year). Many traders use this metric to get insight into investors' sentiment and evaluate whether it's time to buy or sell the fund.
Since ETFs work like an individual stock, they can be bought and sold on exchanges (e.g. NASDAQ, NYSE, EURONEXT). As it happens with stocks, you need to select a brokerage to access trading. Explore our list of available brokers to find the one to help execute your strategies. Don't forget to do your research before getting to trading. Explore ETFs metrics in our ETF screener to find a reliable opportunity.
SPEM invests in stocks. See more details in our Analysis section.
SPEM expense ratio is 0.07%. It's an important metric for helping traders understand the fund's operating costs relative to assets and how expensive it would be to hold the fund.
No, SPEM isn't leveraged, meaning it doesn't use borrowings or financial derivatives to magnify the performance of the underlying assets or index it follows.
In some ways, ETFs are safe investments, but in a broader sense, they're not safer than any other asset, so it's crucial to analyze a fund before investing. But if your research gives a vague answer, you can always refer to technical analysis.
Today, SPEM technical analysis shows the buy rating and its 1-week rating is buy. Since market conditions are prone to changes, it's worth looking a bit further into the future — according to the 1-month rating SPEM shows the buy signal. See more of SPEM technicals for a more comprehensive analysis.
Today, SPEM technical analysis shows the buy rating and its 1-week rating is buy. Since market conditions are prone to changes, it's worth looking a bit further into the future — according to the 1-month rating SPEM shows the buy signal. See more of SPEM technicals for a more comprehensive analysis.
Yes, SPEM pays dividends to its holders with the dividend yield of 2.61%.
SPEM trades at a premium (0.23%).
Premium/discount to NAV expresses the difference between the ETF’s price and its NAV value. A positive percentage indicates a premium, meaning the ETF trades at a higher price than the calculated NAV. Conversely, a negative percentage indicates a discount, suggesting the ETF trades at a lower price than NAV.
Premium/discount to NAV expresses the difference between the ETF’s price and its NAV value. A positive percentage indicates a premium, meaning the ETF trades at a higher price than the calculated NAV. Conversely, a negative percentage indicates a discount, suggesting the ETF trades at a lower price than NAV.
SPEM shares are issued by State Street Corp.
SPEM follows the S&P Emerging Markets BMI. ETFs usually track some benchmark seeking to replicate its performance and guide asset selection and objectives.
The fund started trading on Mar 20, 2007.
The fund's management style is passive, meaning it's aiming to replicate the performance of the underlying index by holding assets in the same proportions as the index. The goal is to match the index's returns.