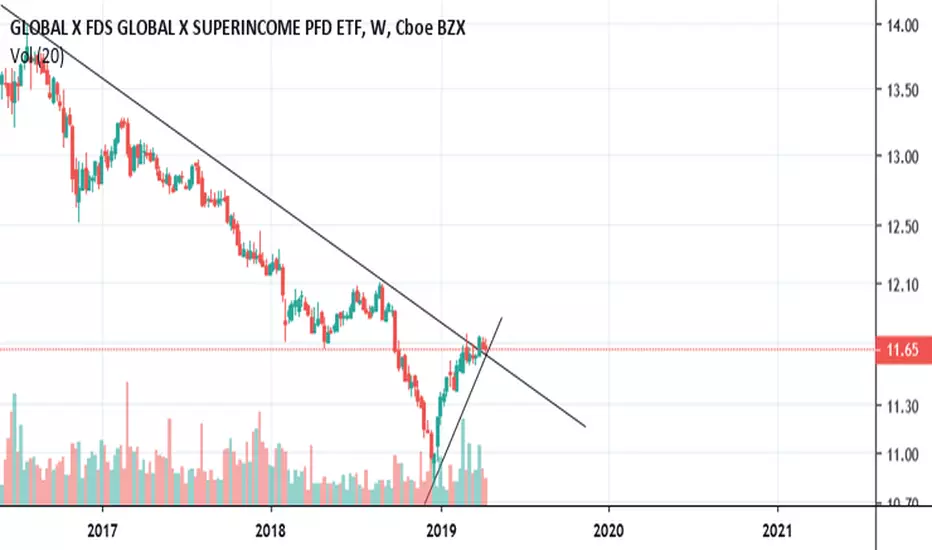
$SPFF big dividend stock, i'll probably jump on this.Needs to stay above bottom trend to be bullish.
Key stats
About Global X SuperIncome Preferred ETF
Home page
Inception date
Jul 16, 2012
Structure
Open-Ended Fund
Replication method
Physical
Dividend treatment
Distributes
Distribution tax treatment
Ordinary income
Income tax type
Capital Gains
Max ST capital gains rate
39.60%
Max LT capital gains rate
20.00%
Primary advisor
Global X Management Co. LLC
Distributor
SEI Investments Distribution Co.
SPFF targets the 50 highest-yielding preferred stocks issued in the United States. Preferred stocks usually offer higher fixed-income payments than bonds with lower investment per share. It also has a priority claim over common stocks in the event of a company's liquidation. Holdings must meet minimum liquidity and size. The highest-yielding securities are ranked until the target count is reached. The fund uses a sampling method in tracking the index, which means it will invest in a sample of securities that collectively have an investment profile similar to that of the underlying index. The index is rebalanced semi-annually. Prior to Apr. 3, 2023, the fund tracked the S&P Enhanced Yield North American Preferred Stock Index.
Related funds
Classification
What's in the fund
Exposure type
Corporate
Stock breakdown by region
Top 10 holdings

Summarizing what the indicators are suggesting.
Oscillators
Neutral
SellBuy
Strong sellStrong buy
Strong sellSellNeutralBuyStrong buy
Oscillators
Neutral
SellBuy
Strong sellStrong buy
Strong sellSellNeutralBuyStrong buy
Summary
Neutral
SellBuy
Strong sellStrong buy
Strong sellSellNeutralBuyStrong buy
Summary
Neutral
SellBuy
Strong sellStrong buy
Strong sellSellNeutralBuyStrong buy
Summary
Neutral
SellBuy
Strong sellStrong buy
Strong sellSellNeutralBuyStrong buy
Moving Averages
Neutral
SellBuy
Strong sellStrong buy
Strong sellSellNeutralBuyStrong buy
Moving Averages
Neutral
SellBuy
Strong sellStrong buy
Strong sellSellNeutralBuyStrong buy
Displays a symbol's price movements over previous years to identify recurring trends.
Frequently Asked Questions
An exchange-traded fund (ETF) is a collection of assets (stocks, bonds, commodities, etc.) that track an underlying index and can be bought on an exchange like individual stocks.
SPFF trades at 8.90 USD today, its price has risen 0.11% in the past 24 hours. Track more dynamics on SPFF price chart.
SPFF net asset value is 8.93 today — it's risen 2.84% over the past month. NAV represents the total value of the fund's assets less liabilities and serves as a gauge of the fund's performance.
SPFF assets under management is 131.73 M USD. AUM is an important metric as it reflects the fund's size and can serve as a gauge of how successful the fund is in attracting investors, which, in its turn, can influence decision-making.
SPFF price has risen by 0.91% over the last month, and its yearly performance shows a −3.78% decrease. See more dynamics on SPFF price chart.
NAV returns, another gauge of an ETF dynamics, showed a 0.71% increase in three-month performance and has increased by 2.88% in a year.
NAV returns, another gauge of an ETF dynamics, showed a 0.71% increase in three-month performance and has increased by 2.88% in a year.
SPFF fund flows account for −12.35 M USD (1 year). Many traders use this metric to get insight into investors' sentiment and evaluate whether it's time to buy or sell the fund.
Since ETFs work like an individual stock, they can be bought and sold on exchanges (e.g. NASDAQ, NYSE, EURONEXT). As it happens with stocks, you need to select a brokerage to access trading. Explore our list of available brokers to find the one to help execute your strategies. Don't forget to do your research before getting to trading. Explore ETFs metrics in our ETF screener to find a reliable opportunity.
SPFF invests in bonds. See more details in our Analysis section.
SPFF expense ratio is 0.48%. It's an important metric for helping traders understand the fund's operating costs relative to assets and how expensive it would be to hold the fund.
No, SPFF isn't leveraged, meaning it doesn't use borrowings or financial derivatives to magnify the performance of the underlying assets or index it follows.
In some ways, ETFs are safe investments, but in a broader sense, they're not safer than any other asset, so it's crucial to analyze a fund before investing. But if your research gives a vague answer, you can always refer to technical analysis.
Today, SPFF technical analysis shows the buy rating and its 1-week rating is neutral. Since market conditions are prone to changes, it's worth looking a bit further into the future — according to the 1-month rating SPFF shows the strong sell signal. See more of SPFF technicals for a more comprehensive analysis.
Today, SPFF technical analysis shows the buy rating and its 1-week rating is neutral. Since market conditions are prone to changes, it's worth looking a bit further into the future — according to the 1-month rating SPFF shows the strong sell signal. See more of SPFF technicals for a more comprehensive analysis.
Yes, SPFF pays dividends to its holders with the dividend yield of 6.74%.
SPFF trades at a premium (0.45%).
Premium/discount to NAV expresses the difference between the ETF’s price and its NAV value. A positive percentage indicates a premium, meaning the ETF trades at a higher price than the calculated NAV. Conversely, a negative percentage indicates a discount, suggesting the ETF trades at a lower price than NAV.
Premium/discount to NAV expresses the difference between the ETF’s price and its NAV value. A positive percentage indicates a premium, meaning the ETF trades at a higher price than the calculated NAV. Conversely, a negative percentage indicates a discount, suggesting the ETF trades at a lower price than NAV.
SPFF shares are issued by Mirae Asset Global Investments Co., Ltd.
SPFF follows the Global X US High Yield Preferred Index - Benchmark TR Gross. ETFs usually track some benchmark seeking to replicate its performance and guide asset selection and objectives.
The fund started trading on Jul 16, 2012.
The fund's management style is passive, meaning it's aiming to replicate the performance of the underlying index by holding assets in the same proportions as the index. The goal is to match the index's returns.