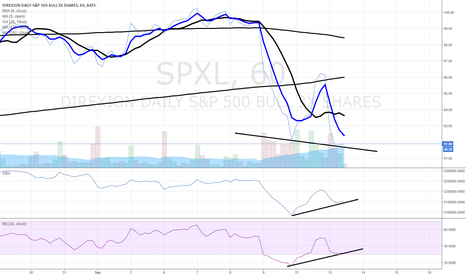
SPXL trade ideas
long double bottom playSPXL is a 3X leverage ETF of the S&P 500. Due to the recent sell off, we are revisiting the recent bottom. Price has broken the EMA(100) and has a short fall to the EMA(200). Dropping to the (200), we should hopefully form a double bottom and have a good footing to move up for the rest of the year especially if people can regain confidence in the economy. People are selling due to the rate hikes, and like all things (such as the bond yield that cause a sell off in February) people will forget and move on. Buying in at the (200) and selling at the upper bollinger band or at an RSI of 56 or 70 depending on your choice can offer some good rewards of 25-35% profit.
Off oversold but can bulls carry it?Bulls appear to be very weak as demonstrated with lower daily volume than past trading sessions. Money Flow (CFM) is negative although OBV is positive. Mixed signals here. Fierce battle between the bulls and bears shown in this consolidation trading. Watching without a position for now until the trend is confirmed.
HOW TO REALLY PLAY THE REBOUND IN THE STOCK MARKETBold move, over exposure. You ready?
Short VXX which tracks the VIX.
Buy XIV which is inverse to the VIX.
Buy SPXL which is a 3x levered SP500 ETF
Short SPXS which is a 3x levered short SP500 ETF
If this isnt just a correction were screwed, if not, then congrats.
SPXL - Feb 11th Tech Analysis on 1hr trend lines - bulltrap?SPXL - S&B Bull Triple Bull Trading Instrument - Feb 11th Tech Analysis
The SPXL is the S&P triple bull. It could be argued that it provides a magnified view of the S&P as it is leveraged on the bull side with SPXS providing the counterbalanced bear trading instrument. The December and January trend lines provides a clear view of the magnificent bull run which was broken on January 30th 2018. The higher highs, higher lows trend was broken without a doubt.
The pullback was to be expected. Support levels at $51.40 were tested during a few trading periods and broken on Feb 2nd 2018 down to $50.84 which gave the bears control.
The bearish trends lines are now established with lower high, lower lows. At times, we are seeing a surge in bull activity although unless the bulls can break the pattern this week, we can expect the bears to continue the savage, but well needed, pullback.
It important to note the volume on bearish days is significant and the volume on bullish days indicates that bulls are more timid and undetermined than bears. Unless the bulls on the S&P can return on Monday and Tuesday with conviction, this 1 hour trends charts on the SPXL seems to indicate SPXS might be the trade to consider for February 12th 2018
Long todayLook for entry on way up on 1 hour time frame. On the Daily, i want this to retrace back up to At Least the 8 ema or around $44. Keep an eye out on this market volatility. During times like this, If you go into profit, manage your trade with a tight stop, preferably on a smaller time frame. Be careful.
---Ideas are not investment advice
$SPXL - Bulls Still In Charge; Eye 106.93 near 01 AUG 2016 SYNOPSIS :
1 - Per Predictive/Forecasting Model, underlying force continue to favor bulls
2 - Support near the 77.61 handle offers a probable rebound level
3 - Forecasting Model eyes 01 AUG 2016 vicinity as probable timing in rally
4 - Invalidation: Break of 68.99
Best,
David Alcindor, CMT Affiliate #227974
- Alias: 4xForecaster (Twitter)


