SpySo.... I'm looking for a rebound this week early on from Smallcaps, banks, and cyclical. All last week everything non tech sold off.. it all started with TVC:NYA hitting this monthly trendline
As you can see, this has been resistance for about 5yrs and every time it has tagged , a correction has followed. To make matters worse , July monthly candle finished with a gravestone doji reversal. Monthly grave stone reversal means that the trend has likely flipped and for the next few months at least until Oct things will flip bearish for all things non tech.
but right now for this week, I think all things non tech gets a big bounce at least early on
Why do I say a bounce is coming? Well the hourly technicals for things non tech went way oversold. On top of that look at the daily BBand on NYA and AMEX:IWM
With standing World war 3 or Powell firing you will get smoked if you short this. This is why my favorite longs early this week are Smallcaps and banks.
Focusing on big tech..
If you didn't know that this market runs on a tech bubble then last weeks divergence was your wake up call.
Neither, Dow,IWM or NYA made a new high but the QQQ and spy did.
With that being said you will only know if the spy has topped by keeping track of the NASDAQ..
Qqq
Over the next 2weeks I think Qqq will retest that breakout of 538-540 which is around the 50ma
This drop will bring spy down to 610 retest.
But first I think there is extremely high chance Qqq retest it's 20sma to the upside at 560 to the upside before heading down
I prefer the short up there at 560 but be aware that price could trade between 550-560 to form a H&S
In a move of extreme fawkery we could get a double top instead
But that will only come off Qqq breaks back over 565
Overall, I don't really like big tech long this week. You may have some making moves but it will be a spotty picture with some green and most red or choppy.
The break below the 20sma on Qqq and all tech indexes
AMEX:XLK
NASDAQ:SMH
AMEX:XLC
Means the trend has changed to bearish.. as a trader one of the rules that has helped me is
Swing the trend and scalp the counter trend..
If the market is bullish then you swing calls and scalp puts.
If the market is bearish , you swing puts and scalps calls.
As far as swinging puts this week, just keep your eye on the 20ma of your favorite index/Stock. Once price retest the 20ma , that is the best entry for the short IMO.
The weekly bearish engulfing means that's by WED-Thurs you should stop trading calls and look for market to roll over for more downside.
Spy
Hourly
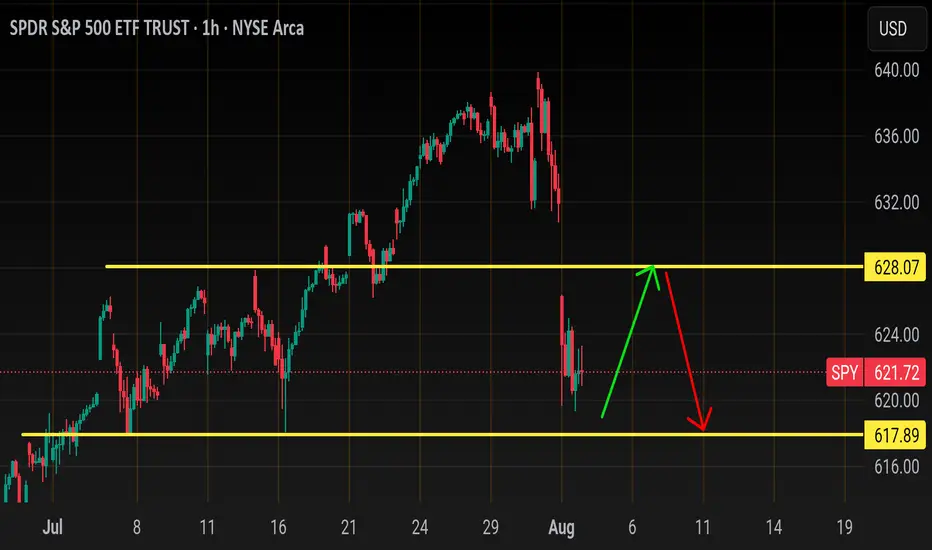
As long as the market opens above 617, you want to scalp the long early in the week with your target of 626-628.
I don't know if they will close this gap or not, it will most likely depend on Qqq breaking above 560.
Below 617 and 610 comes.
If price pushes above 629 , I wouldn't chase calls here. That double bearish engulfing on daily Time frame is no joke, and price will likely no break above 640.
Trade idea of the week is
AMEX:IWM
200sma is at 216.50
Over 217.00 and I like calls to close gap at 219.40.
Price could push up to 20sma at 222 but from there I like the short back down targeting 210
SPY trade ideas
SPY/QQQ Plan Your Trade Update For 8-5This short video is to provide my followers with an update.
I'm still here. I'm still working on projects and new TV code. I have developed a couple of new strategies that I like and that seem to continue to perform.
Overall, I'm still doing my best to deliver superior analysis/results for my followers.
This video covers the SPY/QQQ, Gold/Silver, and BTCUSD (plus extras).
Hope you are all getting some great profits from these moves.
GET SOME.
#trading #research #investing #tradingalgos #tradingsignals #cycles #fibonacci #elliotwave #modelingsystems #stocks #bitcoin #btcusd #cryptos #spy #gold #nq #investing #trading #spytrading #spymarket #tradingmarket #stockmarket #silver

Still undecidedEdged the top and bottom 4hr fibs. In a 4hr fvg. Idk. Anyone have any thoughts on this or nah

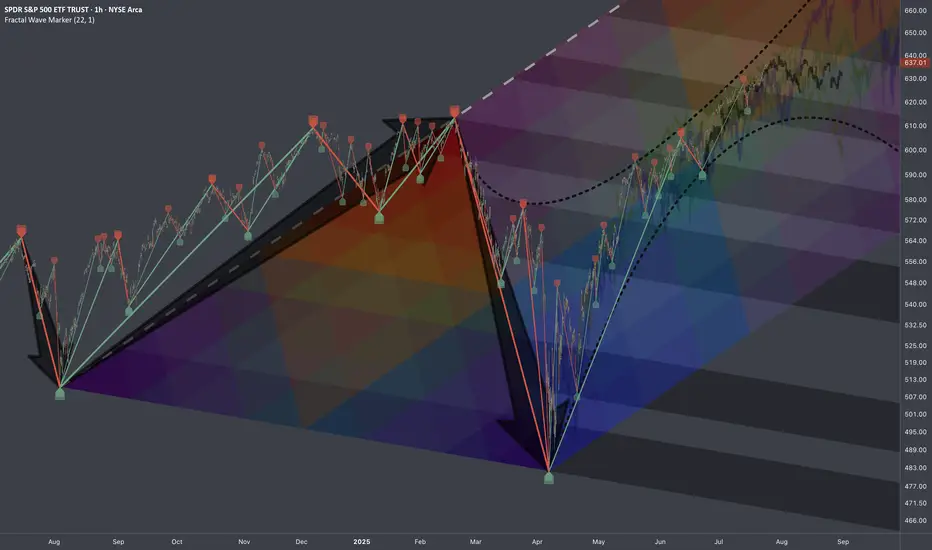
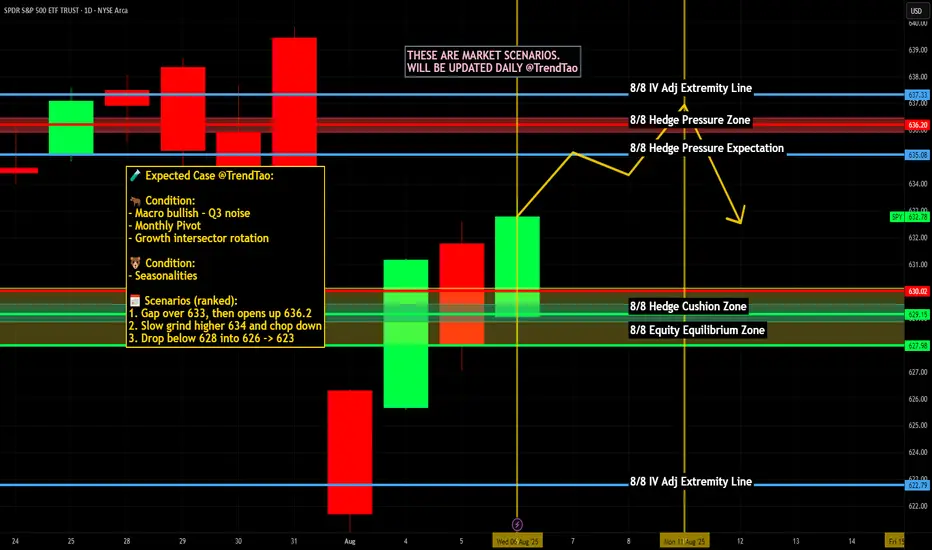
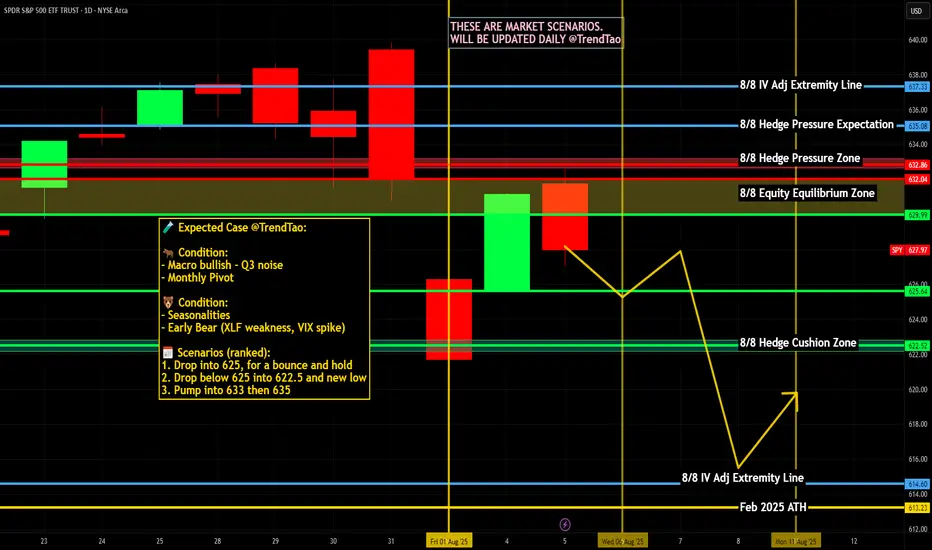
$SPY: Mapping Scenarios🏛️ Research Notes
Fractal Corridors
Shows recursive formations which indicates a full fractal cycle.
The angles of decline are parallel which is important for potential buildup.
To map a cycle we'd need to apply fib channel to the opposite direction In a way this should be sufficient to cover the scenarios of nearest future if we were to use bar patterns to validate a structure.
These are examples of historic progressions with similar growth patterns (composite sub-cycles):
This explains most elements present in interactive chart.
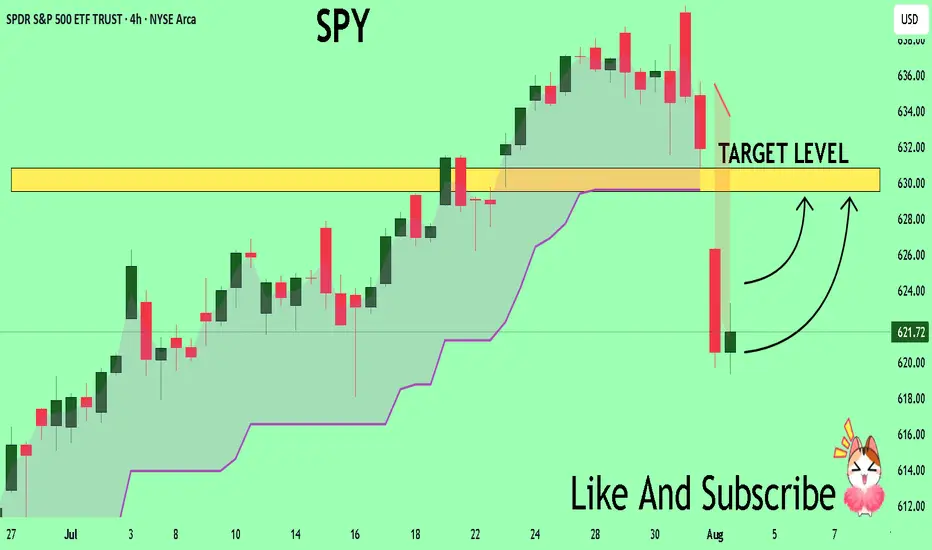
SPY Massive Long! BUY!
My dear subscribers,
My technical analysis for SPY is below:
The price is coiling around a solid key level - 621.72
Bias - Bullish
Technical Indicators: Pivot Points Low anticipates a potential price reversal.
Super trend shows a clear buy, giving a perfect indicators' convergence.
Goal - 629.55
About Used Indicators:
By the very nature of the supertrend indicator, it offers firm support and resistance levels for traders to enter and exit trades. Additionally, it also provides signals for setting stop losses
Disclosure: I am part of Trade Nation's Influencer program and receive a monthly fee for using their TradingView charts in my analysis.
———————————
WISH YOU ALL LUCK
SPY – Bullish Recovery Faces Key Resistance. Aug. 5SPY – Bullish Recovery Faces Key Resistance 🚀
1H Technical Analysis & GEX Overview
SPY has staged a notable recovery from the recent pullback, breaking out of the descending channel and now pressing toward a key resistance cluster near 631–633. This zone aligns with the Highest Positive NETGEX and a 2nd Call Wall, making it a pivotal area to watch for continuation or rejection.
* Support Levels:
* 621–622 → Key structure support and HVL zone (08/04). Losing this could reopen downside toward 615 and 610.
* 615 / 610 → Next downside targets aligned with 2nd & 3rd Put Walls.
* Resistance Levels:
* 631–633 → GEX resistance & 2nd Call Wall; breakout here could fuel a run toward 640+.
GEX Insights
* Positive GEX builds above 628, signaling potential dealer hedging that could limit extreme upside but support gradual climbs.
* Negative GEX dominates under 621, suggesting increased downside momentum risk if price breaks support.
* Put positioning remains elevated at 81.3%, hinting at cautious sentiment but also squeeze potential if shorts get trapped.
Trade Scenarios
* Bullish Case:
* Break and close above 633 opens path to 640+.
* Options: Consider short-term Call spreads targeting 640 if breakout confirmed with strong volume.
* Bearish Case:
* Rejection from 631–633 and break below 621 could send SPY toward 615/610.
* Options: Put spreads targeting 615 with tight risk management.
15-Minute View (Intraday)
* Momentum is holding strong above VWAP, but intraday resistance at 631 is visible.
* A clear BOS above 631 with volume could trigger fast upside continuation intraday.
* Best scalp entries: pullbacks to 628–629 if defended as support.
Outlook
Bias leans cautiously bullish into the 631–633 test. Watch for confirmation on volume before chasing upside. If rejection occurs, expect choppy pullback toward 625–622 for a potential bounce.
Disclaimer: This analysis is for educational purposes only and not financial advice. Always do your own research and manage your risk before trading.
Options Trading for SPY - Bear Spread Oct 17I'm setting up a Bear Put Spread on AMEX:SPY with the following legs:
Buy 630 Put
Sell 620 Put
Expiration: October 18, 2025
Thesis: I'm expecting a bearish move or neutral-to-bearish consolidation over the coming weeks, likely driven by macroeconomic pressure and technical weakness around the 630 level.
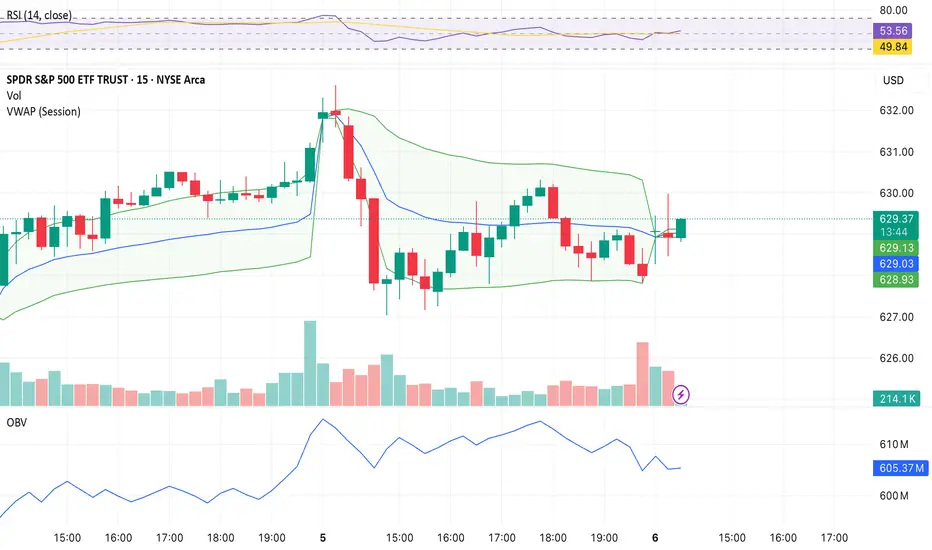
Current Price: ~$629.50
Risk/Reward: Defined risk strategy with a maximum loss equal to the net debit paid.
Breakeven Point: $630 – net debit
Max Profit: If SPY closes below $620 at expiration
Max Loss: If SPY closes above $630 at expiration
Technical indicators include:
Price rejection around VWAP
Decreasing OBV during consolidation
RSI divergence suggesting weakening momentum
Watching for further confirmation on breakdown from current levels. Will monitor volume and macro news.
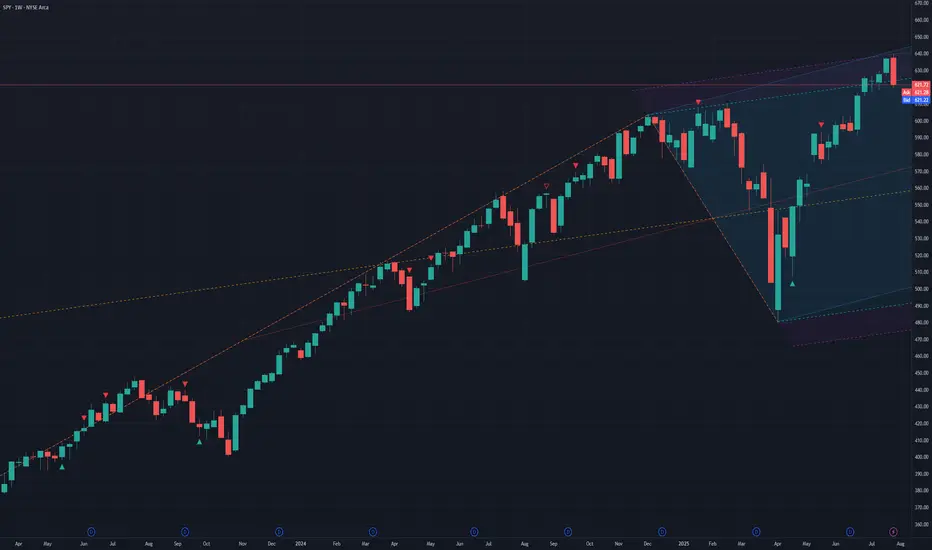
Spy holding this channel at 20 SMASpy bulls are holding above the 20 SMA. Let’s see if this trend holds!

SPYThe red lines are major swing points & levels in price action going down for puts vs the green line which are the same vs their going up for calls
SPY to continue fallingSPY reached a top (resistance) fork line and started to fall. Based on this I entered long on VIX on July 28, when VIX was at its lowest point. I expect this fall of the market to continue.
SPY: Weekly and Monthly outlook for August Hey everyone,
As promised, here is my analysis on SPY for the week next week and the month of August.
As always, safe trades and take care!

THE STOCK MARKET IS BULLISH BUT NEEDS A SMALL CORRECTIONIn this video, we look at the weekly chart of the S&P 500 to determine if a correction is near and spoiler alert. Yes, it is. Here's what happens.

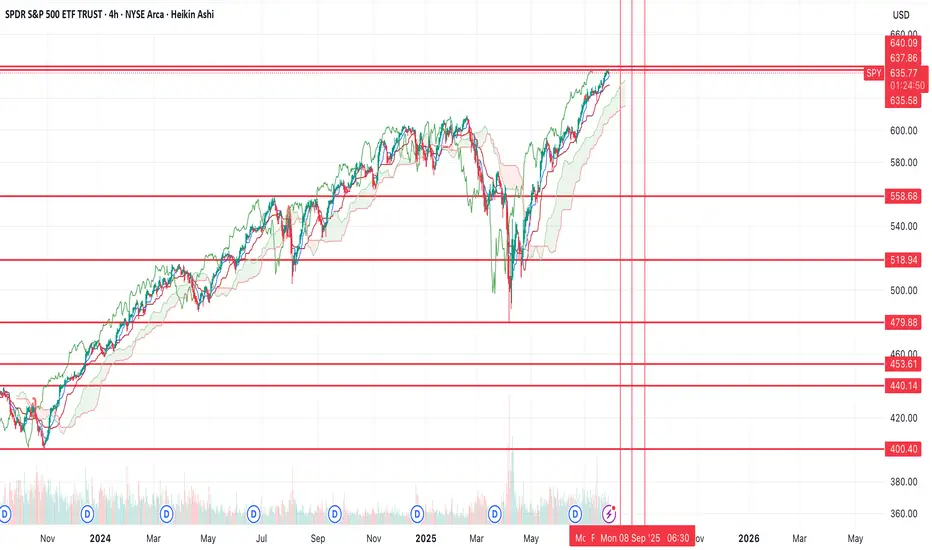
$SPY rolling over, potentially to new lows?While I was early to the idea (like usual), still don't think the thesis will be wrong. I still believe we're going to see a large move down from here.
Yesterday's price action made me pretty confident a top was in (TBD). We had positive news and the market couldn't rally on that positive news and we ended up closing at the lows -- indicating to me there's no more buyers.
Today we have treasuries, the dollar and volatility all rallying while equities selloff, a classic risk off signal. You also have crypto selling off too.
I think we see a large risk off move from here on out, the target is the $440 area (extreme down to $400), but if we find support at one of the other levels above that, there's potential for us to rally from there.
Will have to see how price action plays out over the coming weeks.
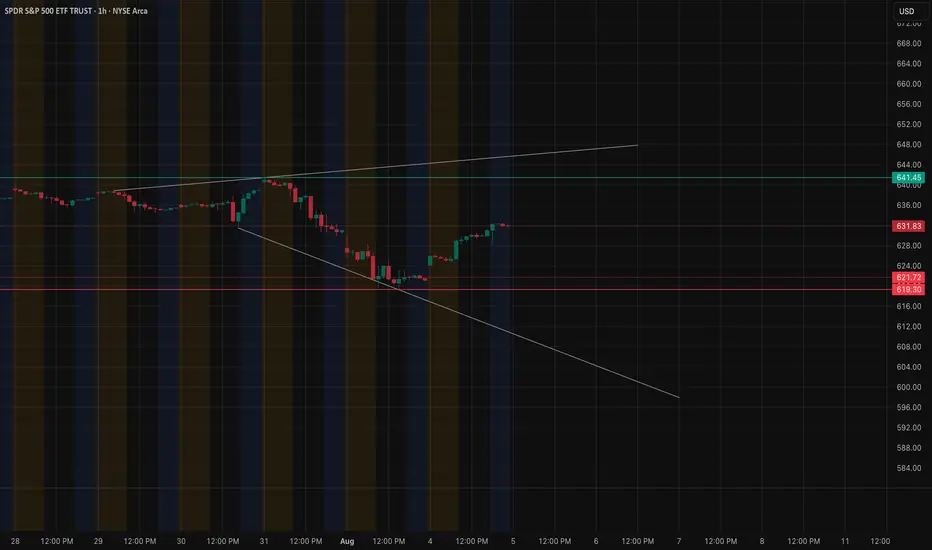
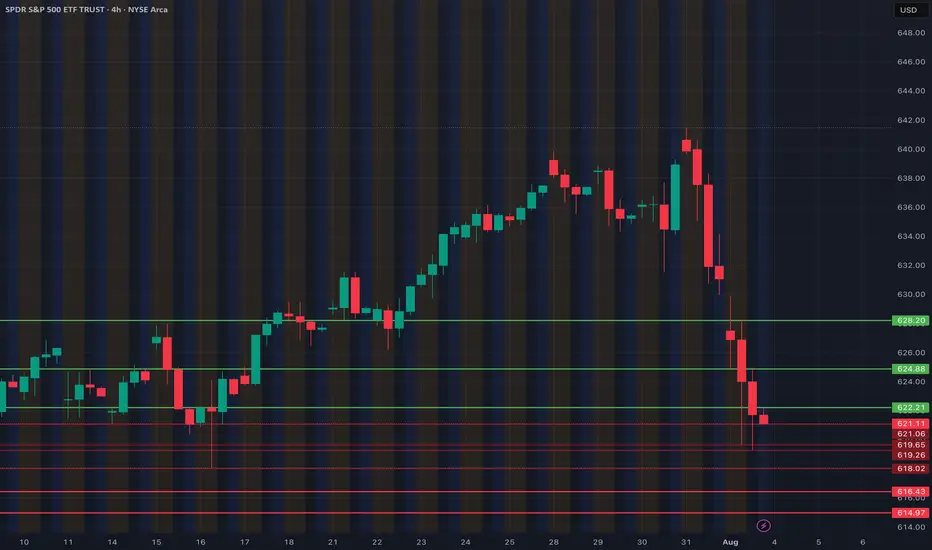
SPY Stuck Below Downtrend Resistance. TA for Aug. 6SPY Stuck Below Downtrend Resistance – Sellers Still Pressing
Market Structure (1H View)
* SPY continues to trade inside a descending channel, with repeated failures near the upper trendline around $641–$644.
* Recent price action shows a lower high rejection followed by consolidation under resistance, signaling a cautious market tone.
* The macro downtrend remains intact unless bulls can break and hold above the descending trendline.
Key Price Levels
* Immediate Resistance: $631 (local reaction high)
* Major Resistance: $641–$644 (trendline + prior supply zone)
* Support Zone: $619–$620 (key demand zone)
* Deeper Support: $603–$605 (previous low and psychological support)
Indicators
* MACD: Recently flipped bearish with red momentum bars increasing — suggests momentum is shifting back toward sellers.
* Stoch RSI: Oversold bounce attempt possible, but currently still near the lower range.
* Trendlines: Price remains capped under the descending resistance line.
Current Bias
SPY is struggling to sustain bullish momentum after the recent push into resistance. Sellers are defending the upper channel, keeping pressure on the downside toward $620.
Scenarios to Watch
🟢 Bullish Case:
* Break & close above $631 with follow-through volume → retest $641–$644.
* Needs strong buying interest to flip the macro trend bias.
🔴 Bearish Case:
* Failure to reclaim $631 + sustained weakness could send price back toward $620 support.
* If $620 breaks, risk increases for a sharper drop toward $603–$605.
Trade Ideas (Not Financial Advice)
* Short Bias: Look for rejection near $631 or the trendline; target $620, then $605 if breakdown accelerates.
* Long Setup: Only if price reclaims $631 convincingly and breaks the $641–$644 resistance zone.
📌 Final Thoughts
SPY remains bearish-biased inside a descending channel. Bulls need a decisive breakout above $641 to change sentiment; otherwise, sellers will continue targeting $620 and potentially lower.

A potential Swing Trade soon on SPY!?OptionsMastery:
🔉Sound on!🔉
📣Make sure to watch fullscreen!📣
Thank you as always for watching my videos. I hope that you learned something very educational! Please feel free to like, share, and comment on this post. Remember only risk what you are willing to lose. Trading is very risky but it can change your life!

SPY: This might be probable today. Watching the price action at spy. It landed at a mod-fib and it is trying to look for a direction. Let's see if we can find a trade here.

Nightly $SPY / $SPX Scenarios for August 7, 2025🔮 Nightly AMEX:SPY / SP:SPX Scenarios for August 7, 2025 🔮
🌍 Market‑Moving News 🌍
📦 Major Tariffs Implemented Today
Sweeping tariffs ranging from 10% to over 40% officially took effect today on imports from numerous countries, significantly escalating global trade tensions. Markets are closely tracking initial reactions across affected sectors, especially pharmaceuticals and semiconductors.
💻 Semiconductor Tariff Shakes Tech Sector
President Trump introduced a substantial 100% tariff on semiconductor imports, with notable exemptions for U.S. investors such as Apple, Nvidia, and AMD. Apple shares surged 5.1% amid investor optimism, while broader tech stocks saw mixed reactions.
🚀 Firefly Aerospace IPO Debut
Firefly Aerospace launched its IPO today, pricing shares at $45. The stock began trading on Nasdaq under ticker "FLY," attracting significant attention due to its positioning in the space and defense technology sector.
📊 Key Data Releases & Events 📊
📅 Thursday, August 7, 2025:
8:30 AM ET – Initial Jobless Claims (week ending Aug 2)
Forecast: 221,000
Previous: 218,000
8:30 AM ET – U.S. Productivity (Q2)
Forecast: 1.9%
Previous: –1.5%
8:30 AM ET – U.S. Unit Labor Costs (Q2)
Forecast: 1.3%
Previous: 6.6%
10:00 AM ET – Wholesale Inventories (June)
Forecast: N/A
Previous: –0.3%
10:00 AM ET – Speech by Atlanta Fed President Raphael Bostic
Topic: Monetary policy outlook; market-sensitive for potential Fed signals.
3:00 PM ET – Consumer Credit (June)
Forecast: N/A
Previous: $5.1B
⚠️ Disclaimer:
This content is for educational and informational use only and is not financial advice. Always consult a licensed financial advisor before making investment decisions.
📌 #trading #stockmarket #economy #tech #earnings #IPO #Fed #tariffs #semiconductors
Stock Market Forecast | TSLA NVDA AAPL AMZN META MSFTStock Market Forecast | CME_MINI:NQ1! CME_MINI:ES1! SPY QQQ
Mag 7 Forecast | NASDAQ:TSLA NASDAQ:NVDA AAPL AMZN META MSFT GOOG

Nightly $SPY / $SPX Scenarios for August 6, 2025🔮 Nightly AMEX:SPY / SP:SPX Scenarios for August 6, 2025 🔮
🌍 Market‑Moving News 🌍
🪙 Citi Lifts Gold Price Forecast Amid Global Uncertainty
Citi raised its short-term gold outlook to $3,500/oz, citing surging safe-haven demand driven by trade instability, softening labor metrics, and heightened geopolitical risk. Risk premiums and volatility remain elevated.
📉 Equities Tumble as Risk Aversion Returns
U.S. stocks slipped on renewed caution—investors rotated into bonds and precious metals following weaker job indicators and escalating trade friction. The dollar and gold strengthened, while equity futures pulled back.
📊 Key Data Releases & Events 📊
📅 Wednesday, August 6:
No major U.S. economic data releases scheduled for today. Markets are closely monitoring corporate earnings reports and commentary from Fed officials, including San Francisco Fed President Mary Daly later in the day.
⚠️ Disclaimer:
This content is for educational and informational purposes only—it is not financial advice. Always consult a licensed financial advisor before making investment decisions.
📌 #trading #stockmarket #economy #trade #currency #gold #earnings
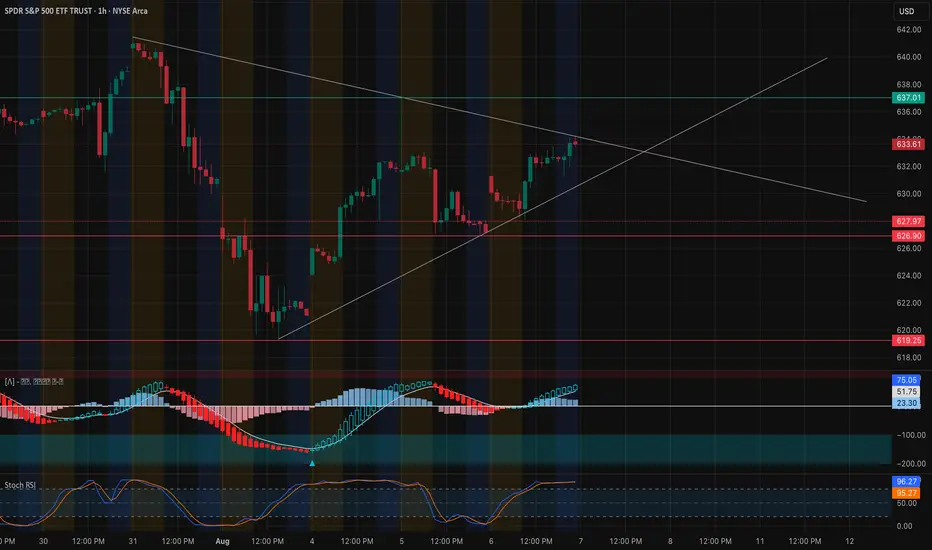
SPY Approaching Apex — Breakout or Trap Ahead? Aug 7SPY Approaching Apex — Breakout or Trap Ahead? 🔥
📊 Technical Analysis (1H Chart)
SPY has reclaimed the rising wedge support trendline and is now grinding just beneath a confluence of resistance near 633.61. This is the third test of this breakout zone, forming a squeeze triangle with lower highs and higher lows.
Key Structure Notes:
* Bullish momentum continues to build on the MACD histogram with rising blue bars and a bullish cross already established.
* Stoch RSI is extremely overbought (96+), which suggests caution — SPY is vulnerable to rejection if buyers lose steam.
* Price action remains orderly and within trendline compression. A breakout above 634 could unleash aggressive buying, while losing 631 opens the door to retest 627–628 demand.
Intraday Levels to Watch:
* 📈 Resistance: 633.61 → 634.20 → 637.00 (key horizontal resistance and fib extension)
* 📉 Support: 631.00 → 628.20 → 626.90 → 619.25
🔍 Options GEX & Dealer Positioning
The GEX board favors bullish continuation — but also hints at gamma traps near the top:
* 🟢 634.00–634.20: 91.11% GEX concentration at 2nd CALL Wall — this is the biggest dealer hedge wall; could act as resistance or gamma squeeze fuel if broken.
* 🟢 637.00: Highest positive net GEX → if SPY pushes above 634 and holds, momentum could carry toward 637.
* 🔴 626.00–625.00: Layered PUT walls and HVL zone provide strong downside cushion.
* 🧭 Net GEX is moderately positive, suggesting dealer flows will slow upside moves unless a sharp squeeze kicks in. Watch IVR (15.3) — low enough to allow scalps but not favorable for selling premium.
🧠 Game Plan & Thoughts
* 🔓 Bullish Scenario: Break and hold above 634 confirms the triangle breakout → target 637–638 next.
* 🛑 Bearish Rejection: Failure at 633.61 or loss of 631 reopens path back to 628.20–626.90 zone.
* 🎯 Suggested Setup: Long scalp above 634 → TP: 637 | SL: 631.
Short setup below 631 → TP: 627 | SL: 634.
Momentum is on the bulls' side for now, but you're buying into a potentially crowded breakout zone. Watch volume and reaction around 634 — breakout or fade will decide next leg.
This analysis is for educational purposes only and does not constitute financial advice. Always manage your risk.
SPY 0DTE Bearish Setup – Max Pain in Play (Aug 7)## ⚠️ SPY 0DTE Bearish Setup – Max Pain in Play (Aug 7)
**Low-Conviction Market = Short-Term Put Opportunity?**
### 🧠 Summary of Consensus:
All major models (Grok, Gemini, Claude, Llama, DeepSeek) flag the **lack of bullish momentum**.
💡 **Key Bearish Signals**:
* 📉 Price below VWAP
* 📊 Weak volume
* 📉 RSI & flow: neutral to bearish
* 🎯 Max pain hovering near current price
---
### 🤖 AI Model Breakdown:
| Model | Bias | Action |
| -------------- | ------------------- | ---------------------------- |
| Grok / Gemini | 🔻 Weak Bearish | No trade (wait for clarity) |
| Claude / Llama | 🔻 Moderate Bearish | Buy PUT at \$630 |
| DeepSeek | ⚖️ Mixed Bearish | Monitor – no high-conviction |
🧭 **Consensus Direction**: **Weak Bearish**
---
### 🔧 Trade Setup (0DTE)
| Metric | Value |
| ---------------- | ------------- |
| 🎯 Instrument | SPY |
| 🔀 Direction | PUT (SHORT) |
| 💵 Entry Price | 0.78 |
| 💣 Strike Price | 630.00 |
| 🛑 Stop Loss | 0.39 |
| 🎯 Profit Target | 1.56 |
| 📅 Expiry | Aug 07 (0DTE) |
| ⏰ Entry Timing | Market Open |
| 📈 Confidence | 60% |
📊 **Risk/Reward**: 1:2
📉 **Time Decay Alert**: Tight stop-loss due to fast 0DTE decay.
---
### ⚠️ Key Watchouts:
* 📈 Reclaiming VWAP = **exit immediately**
* 🔊 Sudden volume spike = momentum shift risk
* 🧯 Keep position size small – this is a **scalp**, not a swing
---
### 🧠 Final Take:
> If SPY stays pinned below VWAP & max pain remains, this **0DTE put could print**. But discipline is everything — tight stop, tight leash. ⚔️
---
🧠 **Follow for daily AI-backed earnings & SPY plays**
📉 **Not financial advice – manage risk like a pro**

Nightly $SPY / $SPX Scenarios for August 5, 2025🔮 Nightly AMEX:SPY / SP:SPX Scenarios for August 5, 2025 🔮
🌍 Market‑Moving News 🌍
🔹 PBOC Moves Prompt FX Backlash
On August 5, 2019, China’s central bank allowed the yuan to depreciate over 2% to its lowest level since 2008. That same day, the U.S. Treasury officially designated China as a currency manipulator, citing the PBOC’s moves as retaliation for recent U.S. tariff actions. In response, China ordered state-owned enterprises to suspend purchases of U.S. agricultural goods—a significant blow to U.S. exporters.
🔹 EU Suspends Counter-Tariffs for Six Months
Following a negotiated framework with the U.S., the European Union suspended retaliatory tariffs on U.S. goods for six months. The move aims to de-escalate trade tensions while joint discussions continue.
🔹 Citi Raises Gold Price Outlook to $3,500/oz
Citi revised its short-term trading range for gold to $3,300–$3,600 per ounce, based on weakening U.S. labor data, rising inflation pressure from tariffs, and growing demand for safe-haven assets. Spot gold traded around $3,356 oz on Monday.
📊 Key Data Releases & Events 📊
📅 Tuesday, August 5:
8:30 AM ET – U.S. Trade Balance (June)
Expected to improve modestly to –$67.6 billion (from –$71.5B), reflecting tariff-influenced shifts in import/export volumes.
9:45 AM ET – S&P Global U.S. Final Services PMI & ISM Non-Manufacturing Index (July)
Key indicators of service-sector strength. Readings above 50 suggest expansion; below 50, contraction. Flash estimates forecast moderated growth in activity.
⚠️ Disclaimer:
This content is for educational and informational use only—not financial advice. Consult a licensed financial advisor before making investment decisions.
📌 #trading #stockmarket #economy #trade #data #inflation #currency

SPY | Bullish | Day Trading AMEX:SPY
SPY has confirmed a bullish structural shift on the 1H chart following the August 1st liquidity sweep.
Key Developments:
A Higher Low (HL) was formed after a significant breakdown and volume climax.
Price has since reclaimed the descending trendline and is now trading above all major EMAs.
Momentum continues to build, supported by:
A clean break of the 38.2% Fibonacci retracement (631.37)
Bullish RSI posture with values trending above 50
Volume profile showing absorption on red candles and confirmation on green
Target Levels:
635.26: Prior resistance and key structural target
637.51: Upper liquidity zone and TP2 based on extension geometry
Support & Risk Management:
Primary structural support: 631.00–630.70
Invalidation level: 629.50
As long as price holds above 631, I remain bullish and expect continuation toward the 635–637 range in the next 1–2 sessions. Pullbacks into the 631 zone would present a potential re-entry or add-on opportunity.
