SPY/QQQ Plan Your Trade For 6-13 : Harami-Inside PatternToday's pattern suggests the markets may stall into a sideways price range.
After the news of Israel targeting Iran in a preemptive strike late yesterday afternoon, the markets moved dramatically lower while Gold & Silver moved higher on the news.
I, personally, see this market trend as a shift in thinking ahead of a long Father's Day weekend.
I see traders trying to position their accounts/trades for uncertainty.
I believe we could see a bit of a shift today - particularly in Metals and the QQQ/NASDAQ/BTCUSD.
Overall, I strongly suggest traders prepare for extreme volatility this weekend as any further news of a counter-strike or further military action in the Middle East could roil the markets.
Happy Friday the 13th - everyone.
Going to be an interesting day to say the least.
Get some.
#trading #research #investing #tradingalgos #tradingsignals #cycles #fibonacci #elliotwave #modelingsystems #stocks #bitcoin #btcusd #cryptos #spy #gold #nq #investing #trading #spytrading #spymarket #tradingmarket #stockmarket #silver
SPY trade ideas

Jeremy Chew SPY Notes 6/12/2025🧠 SPY (SPDR S&P 500 ETF) — Technical Summary
Chart Timeframe: Daily (1D)
Latest Close: ~$603.75
After-Hours Price: ~$595 (notable drop of ~1.45%)
🟩 Recent Price Action:
Strong rally off March/April lows (~458) has pushed SPY through major Fibonacci levels.
Sharp uptrend support (green line) has held since bottom, but is now being tested.
Today’s after-hours drop to $595 places price back below the 78.6% Fib retracement level (~587) — a potential warning sign of a reversal or short-term weakness.
🔍 Fibonacci Levels (from ~644 to ~458 swing):
Level Price Status
23.6% ~518.2 Support (cleared)
38.2% ~536.4 Support
50.0% ~551.4 Support
61.8% ~566.1 Support
78.6% ~587.2 Currently being tested
100% ~644 Major resistance
🔺 Support Levels (Key Areas to Watch):
~587.2: 78.6% Fib + Bollinger Band middle (critical support now at risk).
~566–568: Fib 61.8% + horizontal consolidation support.
~551: Fib 50%, secondary support if breakdown continues.
Green uptrend line: Dynamic support — near convergence zone with ~587.
🔻 Resistance Levels:
~603–606: Immediate resistance (price rejected here intraday).
~615–620: Horizontal price shelf from Feb highs.
~644: Major swing high from earlier in 2025.
📈 Bollinger Bands (20, 2):
Price was hugging the upper band earlier today — sign of bullish momentum.
After-hours dip to $595 pushes price toward the 20-day SMA (~593) — possible mean reversion or early correction forming.
📉 Volume & Momentum:
Volume during the rally has been moderate to low, suggesting limited conviction.
No major volume spike despite the recent breakout attempt.
If selling volume increases tomorrow, it may confirm a short-term bearish reversal.
⚠️ Interpretation:
The after-hours dip to $595 is a yellow flag. It:
Falls below the breakout level of ~603.
Threatens the 78.6% Fib (which is a typical exhaustion zone in retracements).
May break below the sharp uptrend support line, triggering profit-taking.
Short-term bias: Shifting from bullish to neutral/bearish unless it reclaims 603 quickly on volume.
🧭 Next Key Watchpoints:
Bulls want to see:
A bounce from ~593–587 zone.
A reclaim of 603 with strong volume.
Bears want to see:
Breakdown below 587 with follow-through.
Confirmation below trendline and push toward 566.

Nightly $SPY / $SPX Scenarios for June 13, 2025 🔮 Nightly AMEX:SPY / SP:SPX Scenarios for June 13, 2025 🔮
🌍 Market-Moving News 🌍
🚨 Israel Strikes Iran — U.S. Markets Sell Off
Israel launched airstrikes on Iran’s nuclear and military facilities, triggering a sharp risk-off move in global markets. U.S. stock futures slid over 1%, driven by a drop in equities and a surge in safe-haven assets
🛢️ Oil Prices Surge 7–8% on Supply Fears
Brent crude jumped over 7%, reaching ~$74.65/barrel, while WTI rose nearly 8%—the strongest move since early May. The sudden energy-price spike reflects heightened fears of supply disruptions in the Middle East
💱 Dollar & Safe Havens Climb
True to form, the U.S. dollar, Japanese yen, Swiss franc, gold, and Treasuries rallied as investors moved to the safety of low-risk assets amid escalating geopolitical uncertainty
📊 Key Data Releases 📊
📅 Friday, June 13
(No scheduled U.S. economic data)
Data flow will take a backseat as markets digest geopolitical developments and await the weekend.
⚠️ Disclaimer:
This information is for educational and informational purposes only and should not be construed as financial advice. Always consult a licensed financial advisor before making investment decisions.
📌 #trading #stockmarket #geopolitics #oil #safety #charting #technicalanalysis

SP500: Recursive Historic PatternAs a part of my research on fractal phenomena, I'm collecting recursive patterns directly to better understand the emerging structural landscape.
Documenting systemic behavior
Sharp drop
Distinctive growth cycle
Putting this out as current price is near all time high.

SPY 12:16 600.29 reversalMathematically it makes sense; I did some calculations and it seems like this is included in the most likely path for the market. Lost 7k on my LEAP account today so don't bank on it

SPY - 1 Hour ShortSPY – 1H Technical Breakdown (Short Bias)
Price action on SPY has recently traded into a clearly defined higher-timeframe supply zone, where prior bearish order flow originated. The current structure shows signs of exhaustion after a liquidity sweep above recent swing highs, which likely triggered breakout entries and stop-loss clusters — a common precursor to reversal.
We’ve observed a loss of momentum as price consolidates beneath this supply zone, signaling inefficient buying and a potential shift in control from buyers to sellers. The rejection from this zone aligns precisely with the projected schematic path, reinforcing the short bias and supporting the hypothesis of a distribution phase.
The anticipated move targets the mid-550s, a region marked by prior accumulation and unmitigated demand, making it a logical zone for price to seek out resting liquidity.
🔹 Key Technical Confluences:
Entry from a confirmed supply zone
Sweep of prior high followed by internal weakness
Structure showing early lower highs and compression beneath resistance
Market currently following the projected schematic path outlined in advance
🛡️ Risk Parameters:
Stop-loss is placed conservatively above the supply zone highs to account for further probing
Take-profit aligned with prior demand and structural inefficiencies
Risk-to-Reward Ratio (R:R): Estimated 3:1+, offering a highly asymmetric return profile
This is a tactically planned short with strong technical backing. As long as price respects current structure, we maintain bearish conviction until the 555–560 zone is tested or invalidation occurs above the supply.

SPY/QQQ Plan Your Trade For 6-12: BaseRally In Trend ModeToday's pattern suggests the markets may attempt to identify a base and move higher (rally) off that base level.
Given the overnight price activity, I suggest the process of identifying the base level could prompt a deeper early decline in price - possibly attempting to retest 595-597 lows before finding support and attempting to rally.
As I've been warning over the past few weeks/months, I'm still seeing the Excess Phase Peak pattern playing out as a Flag Termination - rolling into a downtrend and attempting to move back towards the $480 lows as a real possibility. I've been warning and watching for the breakdown in trend - but we've not seen it yet.
Thus, we are still BULLISH until we get a confirmation of a solid breakdown. That would be a move below the 580-585 level at this point. We need to see some type of solid breakdown in price, breaking away from the FLAG setup and moving downward, before I could confidently suggest the Flag Breakdown has happened.
Gold and Silver are making a big move higher. Gold is finally starting to move back above $3400 and I believe watching Silver, Gold, & Platinum rally suggests FEAR is elevating as we move into the end of June.
I still believe Gold has a chance to rally above $4k before the end of June. We'll see if it happens.
BTCUSD is moving into a DUAL-EPP pattern. This is very interesting. Watch the video as I highlight why this could prompt a dual-stage EPP breakdown in Bitcoin over the next 20 to 50+ days.
Get some.
#trading #research #investing #tradingalgos #tradingsignals #cycles #fibonacci #elliotwave #modelingsystems #stocks #bitcoin #btcusd #cryptos #spy #gold #nq #investing #trading #spytrading #spymarket #tradingmarket #stockmarket #silver

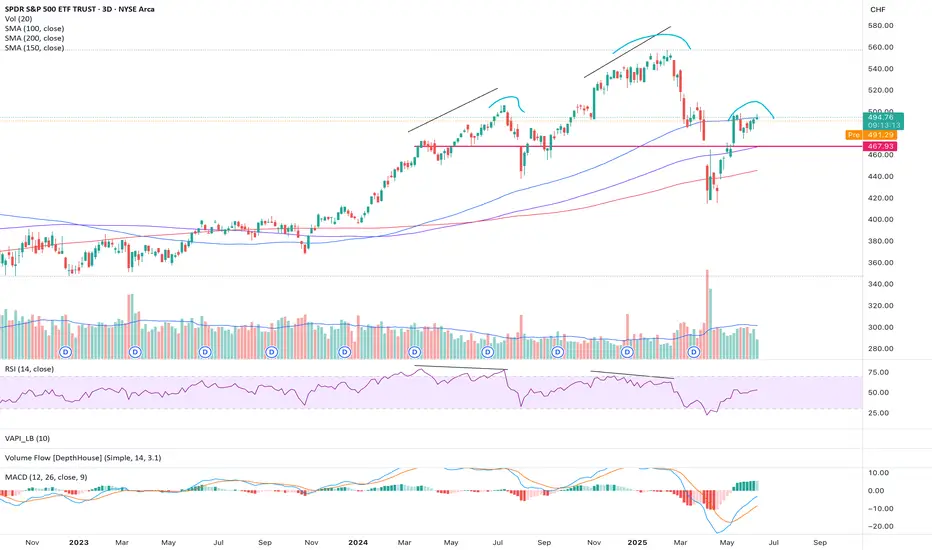
SP500 in CHF terms, bearish outlook- checking the SP500 in USD seems misleading these days
- therefore I checked it with CHF and earlier movements made more sense
- RSI bearish divergences were followed in earlier periods
- now we have a potential head and shoulders formation
- seems more likely to head south
Nightly $SPY / $SPX Scenarios for June 12, 2025🔮 Nightly AMEX:SPY / SP:SPX Scenarios for June 12, 2025 🔮
🌍 Market-Moving News 🌍
💱 Dollar Slides on Trade Truce Hopes & Fed Outlook
The U.S. dollar dropped 0.4%—its lowest level since April 22—after President Trump signaled flexibility on a July 8 trade deadline and U.S.–China talks showed renewed progress, boosting expectations for Fed rate cuts
📊 S&P Shiller CAPE Hints at Overvaluation Risk
Stocks and bonds rallied following rebound, but valuation metrics flash caution: the S&P 500 now sits in the 94th percentile of Shiller CAPE, and equity risk premium has dropped to zero. Analysts warn these levels often precede corrections
🛢️ Oil Holds at Seven-Week Highs
Oil prices remain near seven-week highs (~$66–67/barrel), supported by gradual OPEC+ output increases and hopes that easing trade tensions will aid demand
📈 CPI Cools Again, Bonds Climb
U.S. consumer inflation rose just 0.1% in May (2.4% YoY), easing expectations for tighter Fed policy. Consequently, Treasury yields softened and bond markets outperformed equities
📊 Key Data Releases 📊
📅 Thursday, June 12:
8:30 AM ET – Producer Price Index (May)
An early gauge of inflation at the wholesale level—may reinforce the cooling trend seen in CPI.
8:30 AM ET – Initial & Continuing Jobless Claims
Weekly updates on unemployment filings. Key to monitor for labor-market tightening or softening.
⚠️ Disclaimer:
This report is for educational and informational purposes only—it does not constitute financial advice. Always consult a licensed financial advisor before making investment decisions.
📌 #trading #stockmarket #economy #news #trendtao #charting #technicalanalysis

SPY SHORT FROM RESISTANCE|
✅SPY went up to retest
A horizontal resistance of 610$
Which is also an All-Time-High
So its a very strong level
Which makes me locally bearish biased
And I think that we will see a pullback
And a move down from the level
Towards the target below at 596.43$
SHORT🔥
✅Like and subscribe to never miss a new idea!✅
Disclosure: I am part of Trade Nation's Influencer program and receive a monthly fee for using their TradingView charts in my analysis.

Afternoon UpdateOn spy and sp500 we have a potential breakdown, but nothing is confirmed as of now. Gold may rally above it's resistance. OIl looks like it will fill it's gap at 71 dollars. BTC is coming down but it's still hard to read it. Natural Gas is at support but I believe it goes lower.


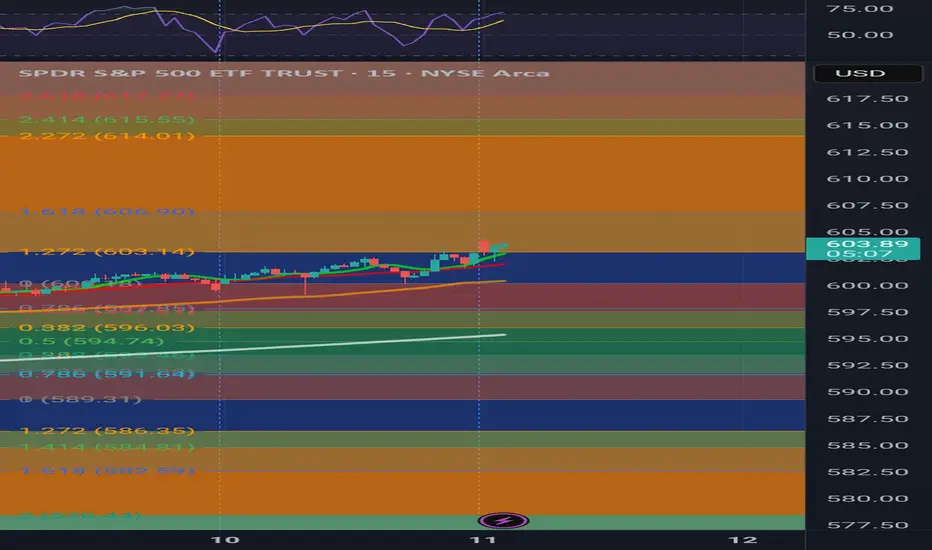
607 EOD Non uclidean Mathematics Dual Band Fibbonaci📍 SPY is now accelerating through the 1.272–1.618 active band.
📍 607 is the next harmonic projection level on the mirrored Non-Euclidean spectrum.
📍 No rejection at Passive ⇒ continuation through Active ⇒ magnet to 607.
SPY/QQQ Plan Your Trade For 6-11: Bottom-Base Rally Counter TrndToday's counter-trend Bottom-Base Rally pattern suggests the markets may attempt to find a peak and roll over into a downtrend.
The normal Bottom-Base Rally pattern is similar to the start of a moderate price base/bottom, then moving into a moderate rally phase.
In counter-trend mode this pattern would be inverted - forming a Top and then moving into a downward price trend.
I've been warning of the potential of a rollover top type of pattern in the SPY over the past few weeks - but it never really setup/confirmed.
I'll be curious to see if this counter-trend pattern, today, sets up some type of big top formation in the SPY/QQQ. It might be related to news as well.
Gold and Silver have a Gap-Stall-Revert-FLUSH pattern. This is always an interesting pattern because is suggests price is going to attempt to either gap and trend or stall and revert. My guess is we are looking at more trending in metals today.
Platinum is RIPPING higher (PL1!). Because of this, I believe Silver and Gold will attempt to follow Platinum and move to the upside today.
BTCUSD is stalling a bit. We'll see if we get any big price move in Bitcoin today. After the big rally over the past few days, it will be interesting to see if BTCUSD reverts downward or continues higher.
Overall, today's patterns suggest the markets are seeking direction. Get ready for an exciting day in the markets.
Get some.
#trading #research #investing #tradingalgos #tradingsignals #cycles #fibonacci #elliotwave #modelingsystems #stocks #bitcoin #btcusd #cryptos #spy #gold #nq #investing #trading #spytrading #spymarket #tradingmarket #stockmarket #silver

Nightly $SPY / $SPX Scenarios for June 11, 2025🔮 Nightly AMEX:SPY / SP:SPX Scenarios for June 11, 2025 🔮
🌍 Market-Moving News 🌍
🤝 Cautious Optimism on U.S.–China Trade Progress
Markets responded positively to fresh developments in ongoing U.S.–China trade talks, with S&P 500 and Nasdaq closing ~0.6% higher — the third straight day of gains — on hopes of easing trade barriers
📉 Treasury Yields Climb as Auction Approaches
Bond investors grew cautious ahead of a key Treasury debt auction and incoming U.S. inflation data. The 10-year yield stayed elevated, weighing modestly on equities .
💹 Global Markets Showing Resilience
Asian and European markets tracked U.S. gains midweek, driven by trade-talk optimism, despite lingering concerns over slower global growth and debt levels .
📊 Key Data Releases 📊
📅 Wednesday, June 11:
(No major U.S. releases — focus remains on market reactions to trade talks and Treasury auctions.)
⚠️ Disclaimer:
This information is for educational and informational purposes only and should not be construed as financial advice. Always consult a licensed financial advisor before making investment decisions.
📌 #trading #stockmarket #economy #news #trendtao #charting #technicalanalysis


$SPY // June 10 2025 // Analysis & Targets for Day TradersWow!!! What a day!! This is the chart from premarket, and you can see that 35EMA catching us all day. The setup was there. Good Game!!

Late afternoon updateSPX is about as stretched as an ending diagonal should get. On Spy the pattern looks clear. If we are going to drop, it should be from this level. We'll see if that is correct soon enough.
USOIL found resistance at 66. Gold found resistance at 3350. Both need to get over their resistance to continue the uptrend. BTC pulled back and I think it goes lower. NG should go lower as well.

Nightly $SPY / $SPX Scenarios for June 10, 2025🔮 Nightly AMEX:SPY / SP:SPX Scenarios for June 10, 2025 🔮
🌍 Market-Moving News 🌍
📱 Apple Disappoints at WWDC Keynote
Apple ( NASDAQ:AAPL ) faced criticism after a lackluster WWDC keynote. Major AI and Siri upgrades were delayed, prompting a 1–1.5% drop in Apple shares—the weakest move during today's presentation
🎮 GameStop to Report Q1, Crypto Pivot in Focus
GameStop ( NYSE:GME ) is scheduled to announce Q1 earnings after market close. Investors will be watching for updates on its $500M Bitcoin allocation and potential crypto-related strategies
📈 Small-Business Optimism Rises
The NFIB Small Business Optimism Index for May came in at 95.9—above the 94.9 consensus—showing modest improvement in sentiment among small firms
📊 Key Data Releases & Events 📊
📅 Tuesday, June 10:
6:00 AM ET – NFIB Small Business Optimism (May):
A reading above expectations could boost risk market sentiment by showing stronger Main Street confidence.
⚠️ Disclaimer:
This is for educational/informational purposes only and does not constitute financial advice. Please consult a licensed professional before making investment decisions.
📌 #trading #stockmarket #economy #news #trendtao #charting #technicalanalysis

Are The Markets Running Out Of Steam? SPY just cant seemed to hold above the 600 psychological level.
Are big players unloading into this positive market strength?
Are we due for a larger pullback?
There's a lot of mixed price action and we just cant seem to make a true breakout.
Some names are underperforming and other names are outperforming.
We remain tactically bullish while trimming keys positions into strength.
Being nimble in this market us key as were seeing large intra day swings.
Short term there is some risk of lower price so we have hedged in some individual names while still remaining bullish.

Not much of an idea and probably gonna be wrong put predictionAt this point im just waffling but this is what im looking for (unlikely but my system sees a possibility)

SPY/QQQ Plan Your Trade For 6-9: Inside BreakawayToday's pattern suggests the SPY/QQQ will attempt to make a breakaway type of price move - away from Friday's open-close range.
Given the fairly tight opening price level this morning, I would stay cautious in early trading today and try to let the first 60 minutes play out - looking for that breakaway trend/momentum.
Overall, the markets are still in a Bullish price phase - trying to push higher.
But, as I continue to warn, I believe the markets could rollover and break downward at any time.
BTCUSD moved substantially higher overnight. This could be the beginning of a bigger advance higher. But, it could also be an exhaustion move higher.
Gold and Silver are still melting upward. This move in metals recently certainly shows the markets are still fearful of any potential downside price activity.
Again, I urge traders to stay cautious as we continue to struggle within the sideways price range.
Price will show us what it wants to do and I believe this move higher in BTCUSD could be a false type of breakout move to the upside.
Get some.
#trading #research #investing #tradingalgos #tradingsignals #cycles #fibonacci #elliotwave #modelingsystems #stocks #bitcoin #btcusd #cryptos #spy #gold #nq #investing #trading #spytrading #spymarket #tradingmarket #stockmarket #silver
