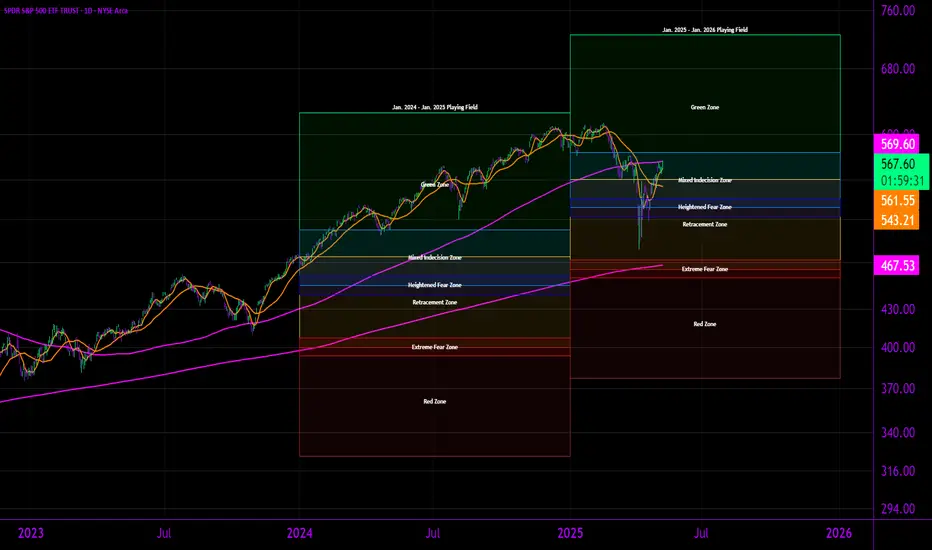
$SPY Yearly Update. Let us just observe.
I hope we reach targets between 725/1000 by 2028.
Meanwhile you can really gauge your buying/selling targets with this little tool I made.
It just gives my perspective (original) on sentiment at price levels. Valuation is different a little bit.
Still. We can observe and potentially participate.
I will do a yearly update on AMEX:SPY once per year from now on.
Enjoy,
Mr. Storm
SPY trade ideas
$SPY / $QQQ – Bull Flag Breakout in Progress?📈 Both AMEX:SPY and NASDAQ:QQQ just broke out of bull flag patterns after a strong recovery from the April lows.
🔍 Technical setup:
Flags formed after a vertical rally ✅
Breakout candles with follow-through ✅
Still riding key EMAs (20/50) with decent volume ✅
📌 Targets based on flagpole projection:
AMEX:SPY → ~582–590
NASDAQ:QQQ → ~505–510
However… mind the context:
We’re heading into macro risk events, and positioning is getting crowded.
These breakouts need confirmation via volume + higher high closes.

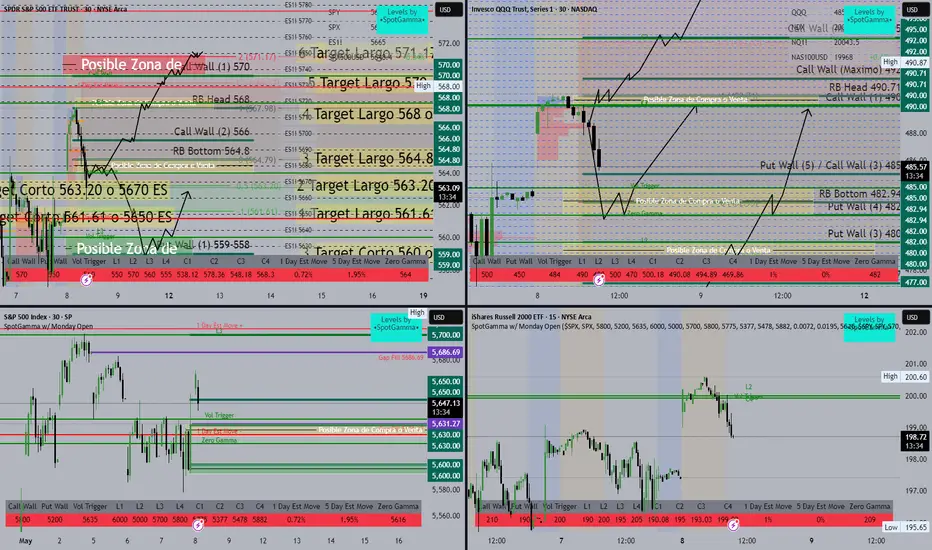
SPY/QQQ 8 de Mayo 2025SPY/ES Liquidity & Target Zones - Market Plan Overview
This visual map integrates liquidity levels, volume walls, and SpotGamma data to forecast key trading zones. Let's break it down in a structured format for better clarity and decision-making:
🔴 Possible Sell Zone / Final Target
Zone: Around 571.17 SPY or 5750 ES
Label: "Possible Sell or Final Target Zone"
Confluence: Call Wall (+1) at 579, significant resistance
🧠 This is a key exhaustion point for long positions. Ideal area to take profit or consider shorts.
✅ Upside Targets (Long Bias)
Target # SPY Level ES Equivalent Notes
6 571.17 5750 ES Extreme resistance zone
5 570 5740 ES Above Call Wall
4 568 5720 ES Matches liquidity cluster
3 564.8 5685 ES Near RB Bottom
2 563.20 5670 ES Mid-range pullback
1 561.61 5650 ES Close to mid gamma
🧠 These levels can be used for trailing targets or re-entries on pullbacks.
🔻 Downside Targets (Short Bias)
Target # SPY Level ES Equivalent Notes
1 563.20 5670 ES First major support
2 561.61 5650 ES Mid gamma support
3 560 5635 ES Near Zero Gamma and Put Wall
🧠 Breaks below these can trigger accelerated downside moves.
📈 Key Zones
Green Zone (Buy Zone):
559–558 SPY — Strong Put Wall and bounce probability area.
Yellow Zone (Flip Zone):
Around 564.79 SPY — Possible area of reversal, watch for reactions here.
Red Zone (Sell Zone):
Above 570 SPY — Watch for overextension and reversal signs.
🔍 Technical Tools Used
Call/Put Walls: Indicate dealer hedging areas and potential price magnets.
Volume Profile: Highlights high-activity price zones.
SpotGamma Levels: Used to identify gamma flip zones, walls, and trigger areas.
🔁 Possible Scenarios
Bullish Path:
Bounce from 561–563 range → Reclaim 564.8 → Push towards 568, possibly 570+.
Bearish Path:
Rejection at 564.8 or 568 → Breakdown below 561 → Test Put Wall at 559.
SPY/QQQ Plan Your Trade For 5-8 : Carryover PatternToday's Pattern is a Carryover pattern in Carryover mode.
After yesterday's FOMC news (unchanged), the markets are seeking a bit of direction. Bitcoin rallied and INVALIDATED a EPP Flagging pattern. In my opinion this suggests the SPY/QQQ may attempt to move a bit higher after the Fed decision.
Although, I still believe the global markets are reacting to uncertainty and tariff news within a very broad consolidation range. So, I'm cautious of trying to go ALL-IN on any long trades at the moment.
Until we break clear of the consolidation range, price could break strongly to the downside on news or geopolitical content. In reality, any type of big news could prompt a downward price move within an uptrend or a consolidation range.
It just seems as though the current global market environment is fraught with uncertainty - so I continue to stay cautious.
Gold and Silver pulled downward overnight. But I still believe metals will continue to rally - attempting to hedge against global risks.
With Bitcoin rallying a bit higher (still in consolidation) - let's see how the next few days play out.
I would be surprised if BTCUSD and the SPY rallied to new highs before the end of May. VERY SURPRISED given the status of the global markets.
But, the markets can stay completely irrational much longer than I can try to fight them. So we have to move WITH the markets - not against them.
Get some.
#trading #research #investing #tradingalgos #tradingsignals #cycles #fibonacci #elliotwave #modelingsystems #stocks #bitcoin #btcusd #cryptos #spy #gold #nq #investing #trading #spytrading #spymarket #tradingmarket #stockmarket #silver

SPY RESISTANCE AREASPY is currently approaching the resistance zone between 560–580.
The gap zone at ~560 is acting as a key support.
If the price holds above this gap, the next target is set at 610.
Failure to hold may push the price down toward the strong support zone between 530–540.
#SPY #Trading #StockMarket #VolumeProfile #TechnicalAnalysis #Earnings #Investing #WallStreet
#globaltrade #investment #investing #stockmarket #wealth #realestate #markets #economy #finance #money #forex #trading #price #business #currency #blockchain #crypto #cryptocurrency #airdrop #btc #ethereum #ico #altcoin #cryptonews #Bitcoin #ipo

What Does Lump Sum Investing Mean for Investors and Traders?What Does Lump Sum Investing Mean for Investors and Traders?
Lump sum investing is when an investor or trader commits a significant amount of capital to the market in one go rather than spreading it over time. This approach is believed to provide strong long-term returns but also comes with risks, particularly in volatile markets. This article explores how lump sum investing works, why investors and traders use it, potential risks, and strategies to manage exposure in different market conditions.
What Is Lump Sum Investing?
Lump sum investing is when an investor puts a significant amount of capital into the market at once, rather than spreading it over time. This approach is common when someone receives a windfall—such as an inheritance, bonus, or proceeds from closing an effective position—and decides to invest the full amount immediately.
Unlike dollar-cost averaging (DCA), which involves dividing an investment into smaller, regular parts, lump sum investing seeks to maximise market exposure from day one. The key argument of investors is that markets tend to rise over time. By investing upfront, capital has more time to grow, rather than sitting on the sidelines waiting to be deployed.
Lump sum investing isn’t limited to equities. It applies across asset classes, including forex, commodities, and fixed income. A trader taking a large position in a currency pair based on a strong technical setup is, in effect, making a lump sum investment—allocating its capital at once rather than scaling in gradually.
Institutional investors also use lump sum strategies, particularly when allocating large amounts into funds or rebalancing portfolios. However, while this method is believed to have strong long-term potential, it exposes investors and traders to market volatility, making risk management a key consideration.
Why Some Investors and Traders Use Lump Sum Investing
Lump sum investing is often used because it puts capital to work immediately, giving it more time to grow. Historical market data supports this approach—studies, including research from Vanguard, have claimed that potential returns are higher in lump sum vs dollar-cost averaging in most market conditions. This is because markets tend to rise over the long term, and waiting to invest can mean missing out on early gains.
Long-term investors typically deploy lump sums when they have high conviction in an asset or when a large amount of capital becomes available. For example, a fund manager rebalancing a portfolio or an individual investing an inheritance may decide to allocate the full amount upfront rather than spreading it out.
In Trading
Traders use lump sum investing differently. While some may use an approach similar to dollar-cost averaging and scale into a position, most traders will deploy capital when they see a high-probability setup. For instance, instead of spreading 1% risk across several trades, they will typically open a position with the entire 1% all at once.
Institutional investors also use lump sum strategies when making block trades or adjusting asset allocations. For example, a pension fund investing in equities after a market downturn may deploy capital in one move to take advantage of lower prices.
However, investing a lump sum of money isn’t just about maximising potential returns—it also involves risk, particularly in volatile markets. The next section explores the potential downsides of this approach.
Potential Risks of Lump Sum Investing
Lump sum investing comes with risks—particularly in volatile markets. The decision to invest everything at once means full exposure from day one, which can work against investors if the market moves against them after deployment. Some key risks to consider include:
Market Timing Risk
Investing a lump sum relies on deploying capital at a single point in time, making it sensitive to short-term market fluctuations. If an investor enters at a peak—such as before the 2008 financial crisis or the early 2022 market downturn—they could face an immediate drawdown. While long-term investors may recover, traders working on shorter timeframes have less room to absorb losses.
Volatility and Psychological Impact
Markets rarely move in a straight line. Lump sum investments can see rapid swings in value, which can be difficult for some investors to handle. Seeing a portfolio drop sharply after investing can lead to emotional decisions, such as panic selling or deviating from an original strategy. Traders face a similar issue when entering a full position—sudden volatility can trigger stop losses or force them to exit prematurely.
Liquidity Risk
For traders, placing a large order in a low-liquidity market can result in slippage, where the trade executes at a worse price than expected. This is especially relevant in forex, small-cap stocks, and commodities with lower trading volume.
How Lump Sum Investing Performs in Different Market Conditions
Market conditions play a major role in how lump sum investing performs. While historical data suggests it often outperforms spreading investments over time, short-term results can vary significantly depending on the broader trend.
Bull Markets
Lump sum investing tends to perform well in sustained uptrends. Since markets generally rise over time, deploying capital early allows one to take advantage of long-term growth. Research from Vanguard found that in about 68% of historical periods, lump sum investing outperformed dollar-cost averaging because assets had more time in the market. A strong bull market—like the one from 2009 to 2021—allowed lump sum investors to see considerable gains over time.
Bear Markets
Investing a lump sum just before a downturn exposes capital to immediate losses. For instance, an investor who entered the market in late 2007 would have faced steep drawdowns during the 2008 crash. Recovery took years, depending on the assets involved.
Although CFD traders can trade in rising and falling markets, the main challenge is to determine a trend reversal and avoid taking a full position just before it happens.
Sideways Markets
When prices move within a range without a clear trend, lump sum investing can be less effective. Investors may see stagnant returns if an asset moves sideways for extended periods, such as during the early 2000s. Traders in choppy markets often break positions into multiple entries to manage risk, rather than committing full capital at once.
Strategies to Potentially Reduce Risk with Lump Sum Investing
Lump sum investing involves full market exposure from the start, which means risk management plays a key role in avoiding unnecessary drawdowns. Understanding how to invest a lump sum of money wisely can help investors and traders potentially manage downside risks.
Assess Market Conditions
Deploying capital blindly can lead to poor outcomes. Investors often analyse valuations, interest rate trends, and macroeconomic factors before making large allocations. For traders, technical indicators such as support and resistance levels, moving averages, and momentum indicators help assess whether market conditions favour a full-position entry.
Diversification Across Assets and Sectors
One key concept in understanding how to invest a lump sum is diversification. Since allocating a lump sum to a single asset increases exposure to its price movements, some investors spread capital across multiple stocks, asset classes, or geographies to reduce concentration risk. A lump sum investment split between equities, bonds, and commodities can smooth out volatility, particularly in uncertain markets.
Hedging Strategies
Once they’ve decided what to do with a lump sum of money, some investors and traders hedge their positions. Opening opposite positions in correlated assets, trading stock pairs, or diversifying exposure across sectors in index trading can act as protection against downside moves, particularly in uncertain or high-volatility environments.
Position Sizing Adjustments
Traders concerned about volatility sometimes split a lump sum trade into staggered entries, adjusting size based on price action. This approach provides flexibility if market conditions shift unexpectedly.
The Bottom Line
Lump sum investing is a popular strategy among investors and traders, offering full market exposure from the start. While it has its advantages, managing risk is crucial, especially in volatile conditions.
FAQ
What Is Lump Sum Investment?
Lump sum investment is when an investor places a large amount of capital into an asset or market all at once instead of spreading purchases over time. This approach is common after receiving an inheritance, bonus, or proceeds from an asset sale. It provides immediate market exposure, which can be advantageous in rising markets but also increases the risk of short-term volatility.
What Is a Lump Sum Trading Strategy?
A lump sum trading strategy entails entering a trade with the entire position size in a single transaction, rather than gradually scaling in. Traders often use this approach when they have strong convictions in a setup. While it maximises potential returns if the market moves favourably, it also increases exposure to short-term price swings.
Is It Better to Invest Lump Sum or DCA?
Lump sum investing has historically outperformed dollar-cost averaging (DCA) in most market conditions because capital is exposed to growth sooner. However, DCA helps manage timing risk by spreading capital over time, making it a common choice for investors concerned about short-term market fluctuations.
What Are the Disadvantages of Lump Sum Investing?
The main risk is market timing—investing at a peak can lead to immediate losses. Lump sum investors also face higher short-term volatility, which can be psychologically challenging. In low-liquidity markets, executing large trades at once may lead to slippage, affecting execution prices.
This article represents the opinion of the Companies operating under the FXOpen brand only. It is not to be construed as an offer, solicitation, or recommendation with respect to products and services provided by the Companies operating under the FXOpen brand, nor is it to be considered financial advice.

Market Review: SPYSitting neutral and waiting for the Market to show it's hand to us. We are pinched between VWAP and the moving averages for now. Looking for a short 2-3 day swing trade play. Cheers.

Nightly $SPY / $SPX Scenarios for May 8, 2025🔮 Nightly AMEX:SPY / SP:SPX Scenarios for May 8, 2025 🔮
🌍 Market-Moving News 🌍
🇺🇸 Fed Holds Rates Steady Amid Economic Uncertainty
The Federal Reserve maintained its benchmark interest rate at 4.25%-4.5%, citing concerns over rising inflation and economic risks. Fed Chair Jerome Powell emphasized a cautious approach, indicating no immediate plans for policy changes.
🤝 U.S.-China Trade Talks Scheduled
Treasury Secretary Scott Bessent and chief negotiator Jamieson Greer are set to meet China's economic head He Lifeng in Switzerland, marking a potential step toward resolving trade tensions. The announcement has positively influenced global markets.
📈 Record $500 Billion Share Buyback Plans
U.S. companies have announced a record-breaking $500 billion in share buybacks, reflecting growing hesitation to make capital investments amid economic uncertainty driven by President Trump's trade policies. Major contributors include Apple ( NASDAQ:AAPL ), Alphabet ( NASDAQ:GOOGL ), and Visa ( NYSE:V ).
⚠️ Recession Warnings from Economists
Former IMF chief economist Ken Rogoff warns that a U.S. recession is likely this summer, primarily driven by President Donald Trump's aggressive tariff policies. He suggests that markets are overly optimistic and not adequately accounting for the risks.
📊 Key Data Releases 📊
📅 Thursday, May 8:
8:30 AM ET: Initial Jobless Claims
8:30 AM ET: Continuing Jobless Claims
8:30 AM ET: Nonfarm Productivity (Q1 Preliminary)
8:30 AM ET: Unit Labor Costs (Q1 Preliminary)
10:00 AM ET: Wholesale Inventories (March Final)
10:30 AM ET: Natural Gas Storage
⚠️ Disclaimer:
This information is for educational and informational purposes only and should not be construed as financial advice. Always consult a licensed financial advisor before making investment decisions.
📌 #trading #stockmarket #economy #news #trendtao #charting #technicalanalysis

SPY Chart Analysis Symmetrical Triangle Signals Potential BreakThe SPDR S&P 500 ETF Trust (SPY) is exhibiting a classic technical setup that may lead to a significant price move. As of early May 2025, SPY is consolidating within a symmetrical triangle, a pattern commonly associated with periods of indecision and coiled momentum.
The Technical Setup
A symmetrical triangle forms when the price creates lower highs and higher lows, resulting in converging trendlines. Unlike directional patterns such as rising or falling wedges, symmetrical triangles are neutral by nature and can break either upward or downward. The tightening price action reflects a temporary equilibrium between buyers and sellers, typically followed by a breakout once either side gains control.
In SPY's case, the upper trendline is sloping downward while the lower trendline slopes upward. Price is currently moving within this narrowing range, with volatility compressing. This structure is a hallmark of market consolidation and is often seen ahead of larger directional moves.
Key Price Levels
While the triangle pattern itself does not predict direction, it does define key technical levels:
A breakout above the upper trendline would suggest renewed bullish momentum.
A breakdown below the lower trendline could indicate the start of a new downward move.
Traders and investors should watch for a strong daily close beyond the triangle boundaries, ideally supported by increased volume, which would signal conviction behind the move.
Volume and Market Context
The volume profile has been declining during the formation of this pattern, which is typical and further validates the setup. Volume contraction during consolidation is often followed by a surge when price breaks out, making volume a crucial secondary indicator for confirmation.
It’s also worth considering the broader market context. SPY has been recovering from its recent pullback, but resistance remains overhead. A confirmed breakout from this symmetrical triangle could act as a catalyst for continuation. On the other hand, a breakdown may open the door to further downside as support levels are tested.
Conclusion
SPY is at a technical crossroads. The symmetrical triangle pattern suggests that the current sideways movement will soon resolve into a more directional trend. Rather than predicting the outcome, traders should stay alert for a confirmed breakout or breakdown, supported by strong volume. This will provide the clearest signal on SPY’s next move and help define risk and reward going forward.

SPY/QQQ Plan Your Trade For 5-7 : Post FOMC UpdateThis video highlights a number of factors why I believe the markets are stalling and are likely to REVERT back to the 515-525 area on the SPY.
Without any real economic driving component, while tariffs and other concerns continue to play out, I believe the SPY will continue to search for Ultimate Support over the next 5-7+ months, then move into an upward reversion phase.
Part of what I'm trying to teach my followers is to try to understand how price operates in structures and phases.
Price only does two things: TRENDS or FLAGS
Within those phases, price structures (EPP, Cradle, and others) take over to determine how and why price may or may not attempt to make certain price moves.
Additionally, without any bias, or economic impetus (driver), price tends to REVERT.
In this video, I show you how to use the STDDEV channels to identify possible target areas for the different phases of market trend.
Ultimately, IMO, trading is about being able to see the price structure, phases, and path of least resistance (in terms of bias/expectations). This helps us position for the highest probability outcome (and hopefully for successful trades).
Remember, all of these techniques can be applied to intra-day charts the same way I'm applying them to Daily and Weekly charts.
Remember, price only does two things: TREND or FLAG.
Once you understand that, applying price structures/phases to price while it TRENDS or FLAGS helps you to gain a keen understanding of where price may target/move in the immediate future.
Hope this helps.
Get Some.
#trading #research #investing #tradingalgos #tradingsignals #cycles #fibonacci #elliotwave #modelingsystems #stocks #bitcoin #btcusd #cryptos #spy #gold #nq #investing #trading #spytrading #spymarket #tradingmarket #stockmarket #silver

SPY in Focus: Tactical Day Trading Amid a Bullish RecoveryAs of early May, SPY consolidates around $560–$570, testing former support-turned-resistance.
On the daily chart, the market is pausing after a rapid rally, with $610 as major resistance and $540–$485 as key support. The 1-hour chart reflects a solid uptrend with recent consolidation between $555–$568, while the 15-minute chart shows intraday weakness with critical support at $560.
Three trading strategies emerge: (1) Bullish breakout, buying above $564–$568 with targets up to $580;
(2) Bearish breakdown, shorting below $560 with downside to $545; and
(3) Range trading, buying/selling within $558–$568 using tight stops. Confirmation via volume and candlestick patterns (e.g., engulfing or hammer) is essential.
Short-term bias is bullish, but with caution—if SPY holds $560, it could retest $570 or break higher. A drop below $556 invalidates the bullish outlook.


Inflation Adjusted Market Valuation since 2007 max liquidityHere's a loose estimation (using basic compound interest over time delta) of what the market would be worth with adjusted inflation if liquidity remained constant since 2007. Inflation adjusted value estimated through the yearly growth % of the market adjusted for inflation and averaged with general inflation trends from 2000-2025 at a ~85% inflation, year by year avg 85/25 = ~3.4%.
(hard to get exact numbers so include a +-10% error at a 90% confidence interval)
What does this tell us? We are above peak value of 520, in consideration of the stimulus being applied over time in buy backs and inflating the market over the last 15+ years, we have a high probability chance that we are at peak investment liquidity and upward movement can be delayed for the next 5-10 years in the form of a major correction to market valuation.
1 minute ago
Trade active
Inf Est since 2007 using adjusted 6.7% year by year inflation
Peak Yr 2007 2015 2020 2022 2025
M.Val 162 213 340 475 613
Inf Est 0 272 376 428 520
Why does the M. Val eventually exceed the Inflation Estimated Value?
Consider the buy backs from stimulus that entered the market after GFC.
1) In no way will they max out on buy backs immediately
2) Buy backs over time guarantee consistent upward market price movement
3) That stimulation is not included in the Inf Est
a. The Inflation Est is simply the max value in 2007 and its inflated relation today
b. The Inflation Est is a control value that only shows existing liquidity in market
At the time of 2007 excluding buy back stimulus event

Spy Game Plan for today If the market continues its bullish momentum, we could see a retest of the 200-day moving average around $570. This level will act as key resistance, and a breakout above could open the door for new highs. However, if Powell’s tone leans hawkish or the minutes reflect a more cautious stance on rate cuts, we could see AMEX:SPY crack below its current trendline. In that scenario, look for potential support and a bounce around the low $550s—specifically in the $552–$550 zone.

SPY Levels Heating Up! Is This Just a Cool-Off or a Pullback?🧊So here’s what I’m seeing on SPY after reviewing the daily, 1H, and options GEX flow. I like to keep it real — not overhyped, just what I think might actually matter if you're trading this week.
📉 Technical Setup (Daily & 1H View)
* We’ve been in this steady grind higher, breaking out of the downward channel.
* Price is stalling a bit near 558–563 zone — that’s a tough area, and it makes sense since it lines up with prior resistance.
* MACD on the daily is still bullish but starting to flatten, and the Stoch RSI looks like it wants to cool off from overbought.
* On the hourly, momentum is clearly slowing down — we’re seeing lower highs and weakening MACD. If 558 breaks, I’d expect some quick downside.
🧠 GEX (Gamma Exposure) Breakdown
* The Highest Negative GEX is parked at 560, which is huge. That’s where market makers flip from hedging to hunting.
* There’s a fat PUT wall at 560, and we’ve been dancing around it. So if bulls can’t hold this line, things could unwind fast.
* On the upside, CALL resistance is stacked at 562–563, and we just tapped into it.
* IV is sitting at 30.6 with IVx avg 25 → market’s a bit juiced, probably pricing in some chop or catalyst ahead.
🎯 Trade Scenarios I’m Watching
🐻 Bearish Setup (if price rejects 563 again):
* Entry: 561–562 rejection
* Target: 555–556 zone
* Stop: Close above 563.50
* This plays off the GEX flip and rejection at CALL resistance.
🐂 Bullish Setup (only if we reclaim 563 with volume):
* Entry: Break and hold above 563
* Target: 567, maybe even 572 if gamma squeezes kick in
* Stop: Drop back below 561
🧨 Options Play Ideas
* Looking short-dated? Consider a PUT debit spread like 562/557 for this week if momentum confirms.
* For bounce lovers: CALL debit 563/567 spread, but only if we break 563 and hold above.
* With IV a bit hot, spreads are safer than naked options to control risk.
Final Thoughts:
SPY’s sitting at a pivot. It’s either digesting gains before another push… or we’re about to see some hedging volatility flood in. I’m personally watching how it handles 560–563 range — everything hinges on that for me. No need to rush in. Let the chart tell you.
This is not financial advice. Just me sharing how I see the market and how I’d trade it based on what the data and charts are saying.

Nightly $SPY / $SPX Scenarios for May 7, 2025🔮 Nightly AMEX:SPY / SP:SPX Scenarios for May 7, 2025 🔮
🌍 Market-Moving News 🌍
🏛️ Fed Decision Day Amid Tariff Pressures
The Federal Reserve concludes its two-day meeting today, with expectations to maintain the benchmark interest rate at 4.25%-4.5%. Despite President Trump's calls for rate cuts, the Fed remains cautious due to inflationary risks from new tariffs and migration policies.
📈 U.S.-China Trade Talks Resume
U.S. stock futures rose overnight on news of upcoming high-level trade talks between the U.S. and China, marking the first discussions since the imposition of 145% tariffs on Chinese goods. Treasury Secretary Scott Bessent and U.S. Trade Representative Jamieson Greer are set to meet with senior Chinese officials later this week.
🛢️ Oil Prices Rebound on Demand Hopes
Oil prices climbed as U.S. production declined and demand in Europe and China showed signs of recovery. Brent crude rose 0.6% to $62.52 per barrel, while U.S. West Texas Intermediate increased 0.74% to $59.53 per barrel.
💼 Key Earnings Reports Ahead
Several major companies, including Uber ( NYSE:UBER ), Disney ( NYSE:DIS ), and Novo Nordisk ( NYSE:NVO ), are scheduled to report earnings today. Investors will be watching these reports for insights into corporate performance amid ongoing economic uncertainties.
📊 Key Data Releases 📊
📅 Wednesday, May 7:
2:00 PM ET: Federal Open Market Committee (FOMC) Meeting Announcement
2:30 PM ET: Fed Chair Jerome Powell Press Conference
3:00 PM ET: Consumer Credit Report (March)
⚠️ Disclaimer:
This information is for educational and informational purposes only and should not be construed as financial advice. Always consult a licensed financial advisor before making investment decisions.
📌 #trading #stockmarket #economy #news #trendtao #charting #technicalanalysis

SPY Buy OpportunitySPY bounced from 500 support with high volume, uptrend since May. Buy if it breaks 540 with confirmation, target 560-570, stop loss below 500. Watch for FOMC speech tomorrow, may impact volatility.

SPY (worst is over?)Excellent buy side volume this week following by one down gap fill. We are at resistance currently so I would expect a lot of chop before resumption up trend. Make sure you check which security is showing strength during the down days of the chop. They might become the future market leaders.

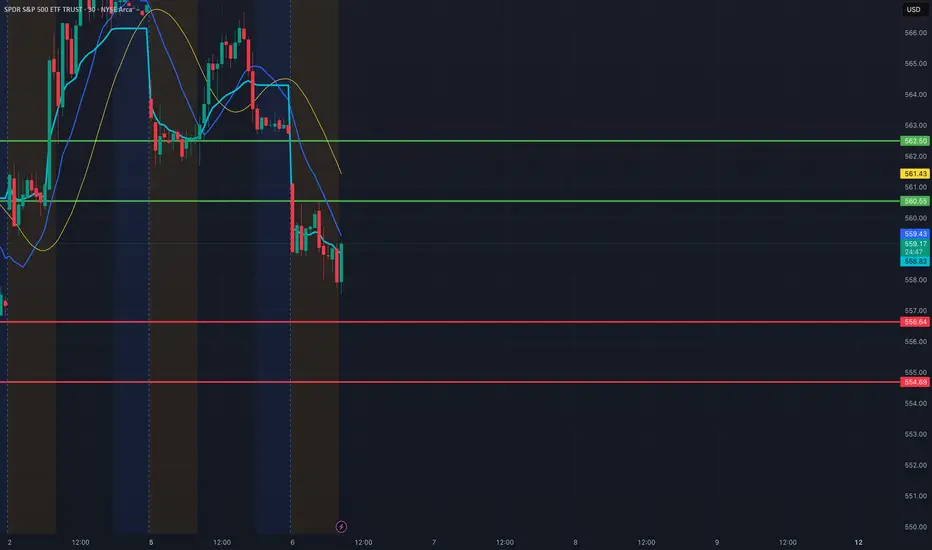
SPY Day Trade Plan for 05/06/2025SPY Day Trade Plan for 05/06/2025
📈 560.55 562.50
📉 556.64 554.69
Thanks to all my followers! Truly appreciate the support!
Please like and share for more ES/NQ levels Tues & Thurs 🤓📈📉🎯💰
*These levels are derived from comprehensive backtesting and research and a quantitative system demonstrating high accuracy. This statistical foundation suggests that price movements are likely to exceed initial estimates.*
SPY Time to come down.SPY time to take a break but don't expect much from the 4hrs and 1hr pov. probable 555.00 and in the worse case scenario 523.00. We'll see once it gets there and most important "how it gets there".
It has strong res at 575.00

SP500 Correction neededSP500 Correction needed
Technical picture of correction:
- Wedge - internal and external
- Finish of W3
- Long period of gains
- Oscillator 4H+ overbought

Where do we go from here ? Hint have a hedge on.We hit target 565 was looking a little higher
Lets see we get follow thru tomorrow down
Be prepared this market gonna sink

Nightly $SPY / $SPX Scenarios for May 6, 2025 🔮🔮
🌍 Market-Moving News 🌍
📉 Market Retreats Amid Tariff Concerns
U.S. stock markets declined on May 5, 2025, as investors reacted to potential tariffs and key earnings reports. The S&P 500 dropped 0.6%, and the Nasdaq decreased 0.7%. Notably, Palantir Technologies ( NASDAQ:PLTR ) fell nearly 8% in extended trading despite raising its full-year revenue forecast and exceeding Q1 revenue estimates.
🏛️ Fed Meeting Commences Amid Political Pressure
The Federal Reserve's two-day meeting begins today, with the central bank expected to maintain its benchmark interest rate at 4.25%-4.5%. Despite President Trump's calls for rate cuts, the Fed remains cautious due to inflationary risks from new tariffs and migration policies.
🎬 Entertainment Stocks Under Pressure
Streaming giants Netflix ( NASDAQ:NFLX ) and Disney ( NYSE:DIS ) experienced premarket losses of over 5% and 3%, respectively, following President Trump's proposal of a 100% tariff on foreign-made movies.
🏠 Housing Market Faces Challenges
The U.S. housing market is weakening due to persistent high mortgage rates and economic uncertainty driven by tariff policies. Mortgage rates, currently averaging 6.76%, have deterred both prospective buyers and sellers.
📊 Key Data Releases 📊
📅 Tuesday, May 6:
8:30 AM ET: U.S. International Trade in Goods and Services (March)
⚠️ Disclaimer:
This information is for educational and informational purposes only and should not be construed as financial advice. Always consult a licensed financial advisor before making investment decisions.
📌 #trading #stockmarket #economy #news #trendtao #charting #technicalanalysis
