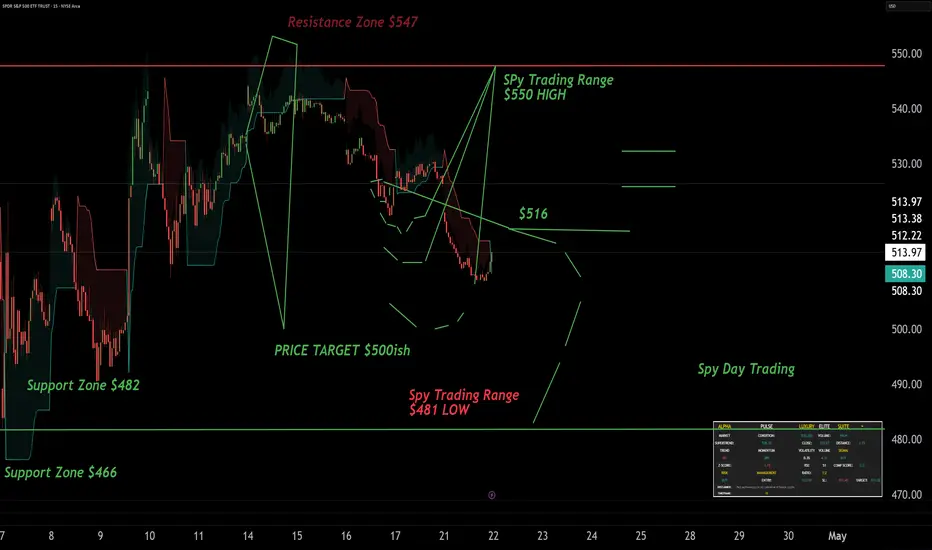
Spy Road To $500 or $481📉 The Road Below $500? Here's the Case.
While bulls are still buying dips, several key signals suggest a deeper correction may be brewing — possibly below the critical $500 psychological support zone in the coming weeks.
Technical Breakdown
Rising Wedge Breakdown on the 4H and Daily charts has triggered.
Diverging RSI — lower highs on RSI while price pushed higher = bearish divergence.
MACD Bearish Crossover confirmed on both 1D and 4H = momentum shift.
Volume Analysis shows increased selling on red candles = institutional distribution.
SMA50 Breach likely — and SMA200 sits just under $500, a magnet if fear accelerates.
🧠 Market Sentiment
Put/Call Ratio has spiked to 1.20+, suggesting rising hedging activity.
CNN Fear & Greed Index is shifting toward Fear.
Social media chatter (Twitter/X & Reddit) has turned skeptical — fewer breakout calls, more risk-off talk.
📰 Macro Headlines Fuel the Case
Powell’s latest "higher for longer" interest rate remarks = bearish for growth names.
Earnings misses from key megacaps (GOOGL, AAPL) = cracks in the leaders.
Geopolitical tension in the Middle East and China trade fears = added volatility.
Key Levels to Watch:
$507–$510 = current distribution zone (supply).
$500 = major psychological & technical level.
$491 = unfilled liquidity gap (volume imbalance) — very likely magnet.
Final Thought:
This isn't fear — it's data-backed caution. Until we reclaim $510 with volume and conviction, a retest of $500 and possibly a sweep below is the more probable path.
Stay smart. Stay hedged. As Always Safe Trades I will guide the way.
SPY trade ideas
Nightly $SPY / $SPX Scenarios for April 25, 2025🔮 🔮
🌍 Market-Moving News 🌍
📉 Procter & Gamble Cuts Outlook Amid Consumer Pullback: P&G shares declined after the company lowered its full-year earnings guidance, citing reduced consumer spending due to economic uncertainty and higher tariffs. CFO Andre Schulten noted significant consumer hesitation, linking it to volatility in mortgage rates and declining stock markets affecting retirement savings.
📊 Durable Goods Orders Surge, Core Spending Stagnant: March durable goods orders jumped 9.2%, driven by a spike in aircraft demand. However, core capital goods orders, excluding aircraft, rose only 0.1%, indicating cautious business investment amid ongoing tariff uncertainties.
🏠 Existing Home Sales Decline Sharply: Existing home sales fell 5.9% in March to an annual rate of 4.02 million units, reflecting affordability challenges associated with high mortgage rates and economic uncertainty.
📊 Key Data Releases 📊
📅 Friday, April 25:
🗣️ Fed Governor Neel Kashkari Speaks (5:00 PM ET):
Remarks may provide insights into the Federal Reserve's perspective on current economic conditions and monetary policy direction.
⚠️ Disclaimer: This information is for educational and informational purposes only and should not be construed as financial advice. Always consult a licensed financial advisor before making investment decisions.
📌 #trading #stockmarket #economy #news #trendtao #charting #technicalanalysis

Pull back SPYBought some puts for 04/29 strike 439. Too much resistance above, looks like is going to be a rejection. Tight SL at 550.

Short - SPYPut option 4/30/25
PT1 $498.80
PT2 $485.68
Entry: $518 - consolidating in this range and the short confirmation will be the price rejection
Stop loss: $522.7

SPY/QQQ Plan Your Trade Update : EPP Flag Setup CompleteI created this video to highlight the current EPP Flag setup in the SPY/ES.
It is my opinion that the market are about ready to ROLL OVER into a downward trend because of this current EPP setup.
Once the FLAG forms (in this case a BULLISH FLAG), the next phase is a BREAKDOWN INTO CONSOLIDATION.
It is my belief the current FLAG will prompt a breakdown in price - moving into a lower consolidation range.
I'm highlighting this EPP pattern to help everyone learn how to use them more efficiently.
Get ready. If I'm right, we're going to see a big move downward over the next 2-4+ days.
Get some...
#trading #research #investing #tradingalgos #tradingsignals #cycles #fibonacci #elliotwave #modelingsystems #stocks #bitcoin #btcusd #cryptos #spy #gold #nq #investing #trading #spytrading #spymarket #tradingmarket #stockmarket #silver

SP500 coiling up at major resistance. Looking at a Big MoveSP500 coiling up at major resistance. Looking at a Big Move either 10-15% downward unless Trump Tweets and pumps us 10% to 50 day moving average. The descending broadening wedge pattern should continue.

April 24, 2025 - Not getting fired (yet)Hello everyone, it’s April 24, 2025, welcome back to another wild episode of “Trumponomics: The Market Edition.” For the second day in a row, global markets are on the rise, and yes, it’s all thanks to the Trump playbook: slap tariffs everywhere, terrify the market, escalate tensions, then toss out a gesture of peace and voilà — rally mode engaged.
The key word this morning? Relief. Relief that Trump might chill out on China, and Powell isn’t getting fired (yet). But let’s not pop the champagne too soon — anyone betting against a weekend plot twist from Trump hasn’t been paying attention.
In the US, the Fed’s Beige Book (a.k.a. the economy’s mood diary) painted a picture that’s… let’s say “limp but not lifeless.” Only 5 of the 12 Fed districts saw growth, and even that was more “walker with tennis balls” than Olympic sprint. Inflation? Creeping in slowly, with companies sharpening their price-hike pencils just in case Trump cranks up the tariff heat again. Employment? Not awful, but nothing to brag about. And uncertainty? It was mentioned 80 times in the report. That’s not a joke.
Meanwhile, auto sales are up — not because the economy’s booming, but because Americans are panic-buying ahead of expected price surges from more tariffs. Business travel is tanking, and tourism’s taking a nosedive. Welcome to the “Not-quite-a-crisis-but-definitely-not-fine” States of America.
As for OANDA:XAUUSD , after a brief flirtation with $3,500, it’s cooled down to $3,337. BLACKBULL:WTI is holding at $62.86. And INDEX:BTCUSD ? It’s back in the spotlight at $92,000 and climbing — yes, people are talking about it again, which should tell you something about the vibe out there.
On the politics front, Trump hinted that the tariff moratorium could be revoked for some countries, and he’s back to pestering Powell to cut rates. Classic. Meanwhile, Wall Street is just trying not to get whiplash. NYSE:BA numbers came in better than feared, and NASDAQ:NVDA supply chain via INX looks solid despite wild swings.
Today’s economic calendar includes durable goods data and jobless claims in the CME_MINI:ES1! are down 0.2% — looks like investors are just bracing for the next Trump curveball.
TL;DR: Markets are riding the Trump-coaster, gold cooled off, crypto’s surging, and America’s economy is wobbling but still upright — for now. Keep your helmets on.

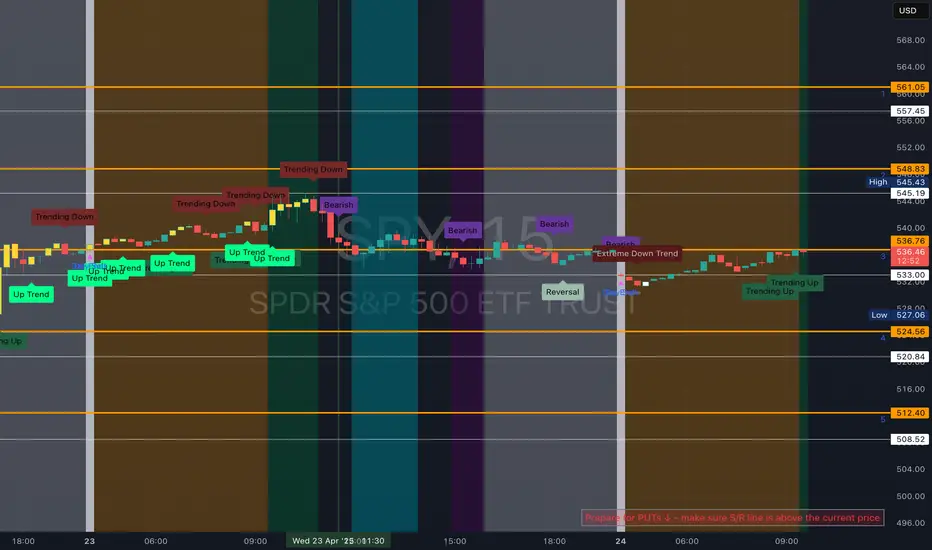
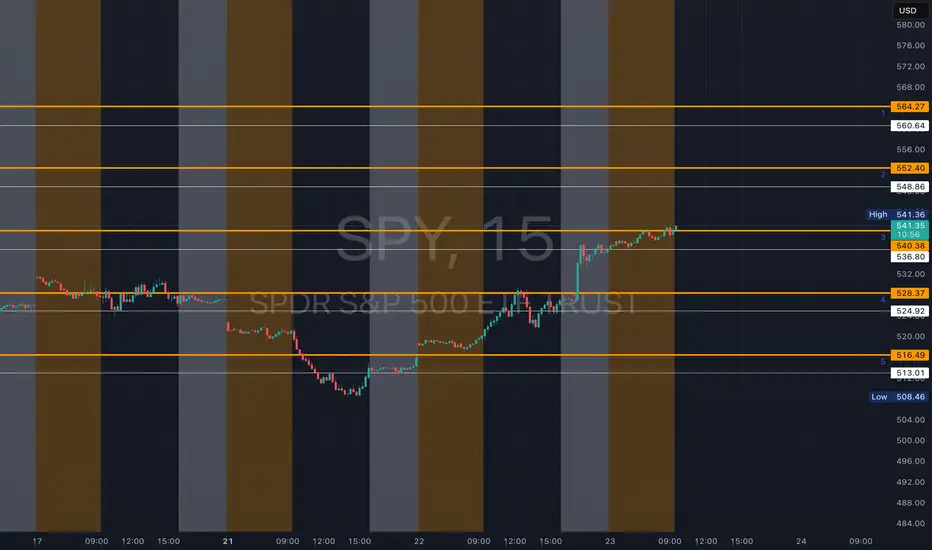
SPY - support & resistant areas for today April 24 2025These are Support and Resistance lines for today, April 24, 2025, and will not be valid for the next day. Mark these in your chart by clicking grab this below.
Yellow Lines: Heavily S/R areas, price action will start when closing in on these.
White Lines: Are SL, TP or Mid Level Support and Resistance Areas, these are traded if consolidation take place on them.
Bull FlagSPY looks like it’s forming a bull flag on the 15-min. If it breaks and holds above 536.43 with a strong green candle close, I’m grabbing calls. First take profit is 538.75, and if RSI stays above 60 I’ll leave a runner toward 542. If it breaks down under 534.30, that’s a sniper short setup toward 531.10. As always, do your own due diligence—this isn’t financial advice.

Spy Road To $500SPY is currently hovering around $533 in the afterhours session. Based on today’s price action and macro sentiment, if we open between $533–$532, we’re eyeing a potential retracement to the $522 zone. This zone aligns with previous demand structure and key VWAP deviation.
Bearish Confirmation Triggers:
Failure to reclaim $535 in the first 2 hours.
Breakdown below $530 + low volume bounce = short trigger.
MACD histogram flipping red on the 1H.
Target Zone: $522–$520
Stop Loss: Above $535 reclaim
Indicators Used: VWAP, MACD, Volume Imbalance, Daily Pivot Zones, Institutional Flow Heatmap.
We’re also watching dark pool prints under $529 and the delta shift on order flow—both signaling increasing bearish pressure.
If SPY opens flat and ranges for 2 hours → downside bias continues.
As always safe Trades

Will History Repeat Itself? $580 Target For SPY By Early MayThe market has been in the doldrums since finding support after a nasty wave of selling that caused AMEX:SPY to decline by an additional 15% in a matter of days. Since we’ve been chopping around in this $65 range, we have seen some sharp swings both ways, but little sense of direction. i think that is about to change soon. Using the time around the Death Cross (When the daily 50MA crosses below the 200MA) of 2022 as a frame of reference, and taking recent PA into account using Elliott Wave, I think it is clear a bear market rally is already underway.
Starting with 2022, the price fell in three distinct waves before making a significant retracement. The day after the 50MA crossed below the 200MA, the price found a temporary bottom before chopping around for 13 sessions. Volume was on a steady decline before the price made a higher low and retraced nearly 75% of Wave (A) over the course of another 13 sessions (13 is a fibonacci number btw). The price briefly spiked above all of the moving averages (50/100/200) before getting sold off again in the strongest wave of the bear market of that year.
Now looking at the daily chart for this year, the setup is a little bit different but there are still similarities. For starters, the 50MA crossed below the 200MA a few days after the market found a temporary bottom at $482. What I’m counting as Wave A of (B) lasted for five sessions (another Fibonacci number). Wave B of (B) was actually four sessions but I decided to compare the volume of both movements using the same chunk of time. As you can see, there was nearly double the volume in Wave A vs Wave B, signaling that bulls are in control (for now). Volume in Wave A was comparatively higher on average than the entire downtrend, which is also worthy of note.
Since we are now in Wave C of (B) and the 100MA is converging with the 200MA, we should see the squeeze here. A similar retracement to complete Wave (B), when comparing to 2022, would suggest AMEX:SPY will spike above $580 rather quickly before the next sell off. If Wave C were to unfold in a more conservative eight sessions (the next biggest fib number) we should see Wave (B) end around Thursday May 1st. It could take a little bit longer since the next FOMC is May 6-7, which could be an event that will cause the market to change directions.
Lastly, for a closer look, this is how I am counting the sub-waves on the 500R ($5) chart. Wave B was a classic Regular Flat pattern that saw wave (c) find support slightly past 100% of wave (a) at roughly $509. The price quickly found support (much faster than I would have expected) without filling the gap and ripped higher. We’ve also seen the price hover around monthly VWAP for a while, which indicates somewhat of an agreement on price despite the wild swings.
The price gapped up over 2% on Wednesday before seeing some selling in the afternoon. We could either close this gap on Thursday or continue higher to close the upper gap at $560 and beyond. Volume increased from wave (b)-(c), and has remained higher - which I think is accumulation. Using intraday ratios, Wave C of (B) could extend as high as the 1.618 extension at $587.
Actually, one last thing. TVC:VIX price action also supports my thesis. Even through the PA on AMEX:SPY was relatively neutral on Wednesday after the gap up, VIX still importantly dropped below support and is now below the 0.618 retracement. I think it will return to the 200MA for support, which usually hovers around $20. Fib circles added just because they’re kind of interesting to me when analyzing VIX.
If you’ve made it this far, thank you for reading and good luck. As always - use your best judgement and be ready to react to anything that happens in the market.

Nightly $SPY / $SPX Scenarios for April 24, 2025🔮 Nightly AMEX:SPY / SP:SPX Scenarios for April 24, 2025 🔮
🌍 Market-Moving News 🌍
🇪🇺 European Banks Brace for Tariff Impact: European banks are facing a challenging outlook as U.S. tariff hikes raise recession fears. Analysts anticipate slower revenue growth and increased loan loss provisions, with institutions like BNP Paribas expected to report earnings reflecting these pressures.
✈️ Airline Industry Faces Booking Declines: European airlines report a 3% drop in planned summer trips, with leisure travel down 8% compared to 2024. Economic concerns and rising travel costs, particularly among Gen Z travelers, are contributing factors. Airlines like Ryanair and Air France-KLM are considering fare adjustments to maintain demand.
👗 Kering's Revenue Drops Amid Gucci Struggles: Luxury group Kering reported a 14% decline in Q1 revenue, with flagship brand Gucci experiencing a 25% drop. The company attributes the downturn to ongoing brand challenges and macroeconomic factors affecting consumer spending in key markets.
📊 Key Data Releases 📊
📅 Thursday, April 24:
📦 Durable Goods Orders (8:30 AM ET):
Forecast: +2.1%
Previous: +0.9%
Measures new orders for manufactured durable goods, indicating manufacturing sector health.
📈 Initial Jobless Claims (8:30 AM ET):
Forecast: 222,000
Previous: 215,000
Reflects the number of individuals filing for unemployment benefits for the first time, signaling labor market trends.
🏠 Existing Home Sales (10:00 AM ET):
Forecast: 4.14 million
Previous: 4.26 million
Indicates the annualized number of existing residential buildings sold, providing insight into housing market conditions.
⚠️ Disclaimer: This information is for educational and informational purposes only and should not be construed as financial advice. Always consult a licensed financial advisor before making investment decisions.
📌 #trading #stockmarket #economy #news #trendtao #charting #technicalanalysis


$SPY & $SPX Blocked @ the 1hr200MA, Daily 35EMA, Downtrend & GapThe 35EMA across timeframes really doesn’t disappoint. This is the Daily timeframe.
We had the 1hr 200MA, the Downtrend Line off of all time highs, and the 35EMA on the daily timeframe. We were not going anywhere. And add to that the MASSIVE bear gap.
Good Job today if you guys took any of the trades I posted either here or on the video last night - every one closed up 100%
"SPY & SPX Stalled: 200MA, 35EMA, Downtrend & Bear Gap Clash!"

SPY Long and Neutralnear demand Zone,
Long entry 516
no Stop ,
Target 530
Risk management is much more important than a good entry point.
I am not a PRO trader.
In my trading plan, the Max Risk of each short term trade should be less than 1% of an account.

PY has bottomedWhat Price Action Says:
SPY has bottomed, support now at 510, up from 485!
Strong resistances at 550 & 585, but AMEX:SPY is likely to break through these levels in the second half of the year.
In the short term, it remains within a range.
Watch 510/550 closely.

bullish SPY (pitchfork based)SPY reached the bottom of one pitchfork and the middle of the second one and bounced back up. I expect the bounce to continue

SPY - support & resistant areas for today April 23 2025These are Support and Resistance lines for today, April 23, 2025, and will not be valid for the next day. Mark these in your chart by clicking grab this below.
Yellow Lines: Heavily S/R areas, price action will start when closing in on these.
White Lines: Are SL, TP or Mid Level Support and Resistance Areas, these are traded if consolidation take place on them.
SPY/QQQ Plan Your Trade For 4-23 : Rally-111 PatternToday's RALLY pattern suggests the SPY/QQQ will continue to push higher, possibly breaking upper resistance near $550/493.
As I suggested in this video, I believe the upward price trend bias will continue into Friday (4-25) and suddenly shift into a BEARISH price trend/bias early next week.
The May 2-5 Major Bottom cycle low, my research predicts, will happen and should prompt a fairly strong downward price trend as we near the end of April and head into early May.
Gold and Silver will likely consolidate a bit over the next 24-48 hours. So, this is a great time to pick lower entry price levels for LONGS/CALLS.
Ultimately, I'm still expecting Gold to rally above $3750 before the end of May and attempt to target $4500++ before the end of June.
BTCUSD is moving into a potential "INVALIDATION" phase. Although I'm currently estimating the probability of that invalidation at about 20-30%, it is still a valid price trend.
I believe BTCUSD will shift into a downward price trend as the markets continue to unwind excesses through the May, July, and October lows, according to my cycles.
The big opportunity for traders over the next 48 hours is playing the upward trend bias in the SPY/QQQ - then moving into a mode of preparation for next week's breakdown/downward price trend in the SPY/QQQ.
So, play it smart. Follow the chart and don't try to be a superhero.
Play what is in front of you and prepare for the bigger price swings headed into next week and beyond.
Get some.
#trading #research #investing #tradingalgos #tradingsignals #cycles #fibonacci #elliotwave #modelingsystems #stocks #bitcoin #btcusd #cryptos #spy #gold #nq #investing #trading #spytrading #spymarket #tradingmarket #stockmarket #silver

SPY Setting Up for a Breakout? Gamma, Liquidity & TA Aligning 🔍GEX Analysis (Options Sentiment)
SPY is showing an impressive surge off the 508 HVL zone, with a clean stair-step climb supported by options flow. Gamma exposure is shifting favorably:
* Strongest Call Wall sits at 528–530, where we see the highest positive NETGEX—aka the Gamma Wall.
* Price is currently testing the 536 level, and the bulls are targeting 549 and potentially 561+ if momentum continues.
* Options Oscillator shows notable GEX alignment (🟢🟢🟢) and IVR 48.8, suggesting room for more expansion.
➡️ Calls are in control (48.6%), and no major PUT pressure remains above 508. With IV contraction, theta decay is less brutal. This opens the door for short-dated call entries (0DTE to 3DTE) above 530.31 with stops below 526.61.
Price Action & Trading Plan
On the 1H chart, SPY has broken out from a CHoCH + BOS structure, and we’re currently in a bullish continuation move.
* Trend Strength: Strong Bullish
* Market Structure: In premium but bullish hold.
* Candle Volume: Thin, but breakout is supported by prior strong demand.
* Setup: Long is forming – waiting for follow-through.
🔑 Key Levels:
* Entry: Above 530.31
* Targets: 549 (RRR 1), 561.53 (RRR 2)
* Invalidation: Below 526.61
🧠 My Thoughts
SPY is building momentum and options are reinforcing the move. The breakout through the HVL zone, combined with SMC-confirmed structure and GEX tailwinds, tells me the path of least resistance is up. Volume isn’t overly strong yet, so we need to monitor follow-through and not get trapped if a reversal forms near 540–549. If bulls defend 530, this could turn into a "home run" leg into the week.
🚨 Disclaimer
This analysis is for educational purposes only. It does not constitute financial advice. Always do your own due diligence and manage your risk accordingly.

SPY INV C&H Right at the 50% fib retracement & the trendline. We are not out of the woods just yet. Careful tomorrow.

Nightly $SPY / $SPX Scenarios for April 23, 2025🔮 🔮
🌍 Market-Moving News 🌍
🇺🇸 U.S.–China Trade Tensions Ease: President Trump announced plans to "substantially" reduce tariffs on Chinese imports, signaling a potential de-escalation in the trade war. Treasury Secretary Scott Bessent labeled the current tariffs as "unsustainable," and the IMF warned of a "major negative shock" to global growth due to the ongoing trade conflict.
📉 Tesla's Profit Decline: Tesla reported a 71% drop in Q1 profits, attributing the decline to backlash over CEO Elon Musk's involvement in government affairs. Musk announced plans to reduce his role in the "Department of Government Efficiency" (Doge) starting in May.
🛫 Boeing's Earnings Under Scrutiny: Boeing is set to report earnings, with investors closely watching for impacts of trade tensions on Chinese plane deliveries. The company's performance is seen as a bellwether for the aerospace sector amid global economic uncertainties.
📊 Key Data Releases 📊
📅 Wednesday, April 23:
🏠 New Home Sales (10:00 AM ET):
Forecast: 675,000
Previous: 662,000
Measures the annualized number of newly constructed homes sold, indicating housing market strength.
📈 S&P Global Manufacturing & Services PMI (9:45 AM ET):
Manufacturing Forecast: 49.5
Services Forecast: 51.0
Provides insight into the economic health of the manufacturing and services sectors.
🛢️ EIA Crude Oil Inventory Report (10:30 AM ET):
Reports on the weekly change in the number of barrels of commercial crude oil held by U.S. firms, influencing oil prices and energy sector performance.
⚠️ Disclaimer: This information is for educational and informational purposes only and should not be construed as financial advice. Always consult a licensed financial advisor before making investment decisions.
📌 #trading #stockmarket #economy #news #trendtao #charting #technicalanalysis

Back of trendline on Hourly look for profit takingon the daily it's bullish for uptrend, however in the hourly chart it looks like we can see some profit taking. a small short there.
