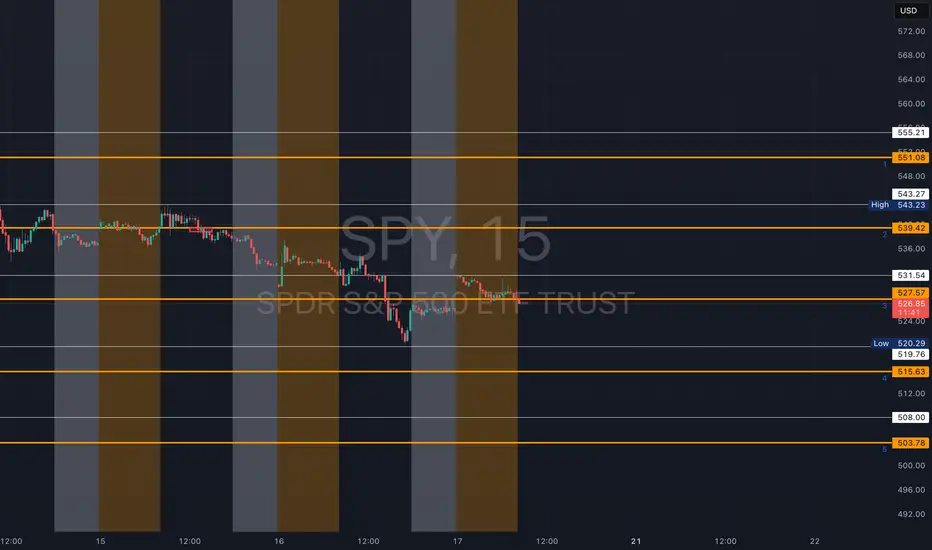
SPY - support & resistant areas for today April 17 2025These are Support and Resistance lines for today April 17 2025 and will not be valid for next day. Mark these in your chart by clicking grab this below.
Yellow Lines: Heavily S/R areas, price action will start when closing in on these.
White Lines: Are SL, TP or Mid Level Support and Resistance Areas, these are traded if consolidation take place on them.
SPY trade ideas
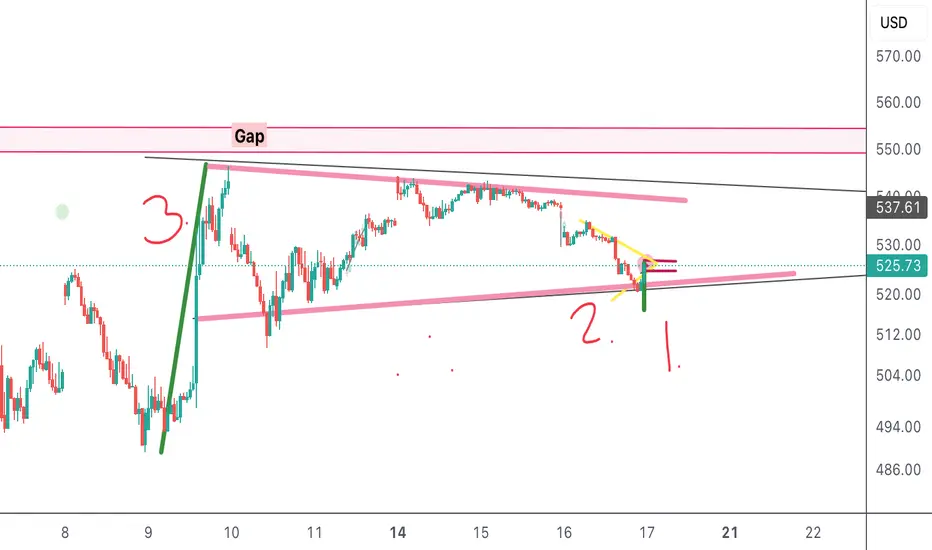
Bulls held the line!boost and follow for more 🔥
In my last SPY analysis I pointed out the potential short trap below major support, I added back all shares and some shortly after I noticed this when spy was around 490.
I think as long as 523 holds then a push higher to 550-570 can happen in the next few weeks.🎯
first and last chart from me today, I hope you all have a great weekend 🤝

$SPY April 17 2025Not much to share. I am waiting for a base between 480 to 530 to form. Maybe 1 or 2 weeks.
Till then i will watch. No set ups

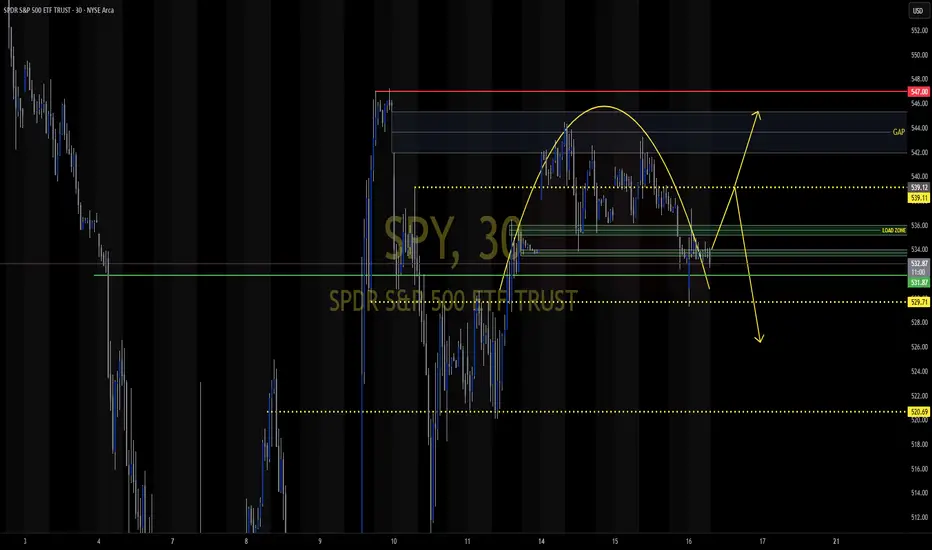
SPY/QQQ Plan Your Trade Video For 4-17 : Another BLANK dayToday's BLANK pattern in counter-trend mode is nothing to worry about.
As I research and document these patterns, there are patterns that appear frequently on the Daily price chart and there are others that appear more infrequently.
If I have not already marked these patterns and documented them, they have not appeared anywhere in the 11+ years of the Daily price data I use within the Lookup Engine.
Therefore, these are VERY RARE types of patterns - Extremely infrequent.
I will add that the secondary looking criteria show yesterday and today could be similar to "key top/bottom" types of price rotation. So, I do believe the current price level on the SPY (520-535) could prove to be very critical support/resistance going forward.
Tomorrow is Good Friday (no trading). So if you are going to take any trades today, make sure you remember to plan your exits for TODAY or NEXT WEEK (or later). You will not be able to exit stock/ETF trades tomorrow (sorry).
Gold is moving into a Momentum Rally, and I really want to see how that pattern plays out before the long holiday weekend.
Fingers crossed we see a BIG RALLY again today.
BTCUSD is still rolling into a downward price trend based on my EPP pattern structure. This downward trend aligns with my May 2 Major Bottom pattern for the SPY/QQQ. So I would expect BTCUSD to start to roll downward sometime near the middle/end of next week.
Remember, this weekend should be about your family, your friends, and your beliefs.
Relax and enjoy.
Get some...
#trading #research #investing #tradingalgos #tradingsignals #cycles #fibonacci #elliotwave #modelingsystems #stocks #bitcoin #btcusd #cryptos #spy #gold #nq #investing #trading #spytrading #spymarket #tradingmarket #stockmarket #silver #xauusd

April 17, 2025 - Powell, Japan & TrumpHello everyone, it’s April 17, 2025. Yesterday’s U.S. trading was pure market carnage. Semiconductors ( NASDAQ:NVDA , NASDAQ:AMD , NASDAQ:ASML ) were steamrolled as AI chip bans to China kicked in and Trump dropped another tariff bomb, hiking duties to 245%. That wiped $200 billion off Nvidia alone.
In Chicago, Powell stoked the flames, warning tariffs will fuel inflation and choke growth, and insisted he’s in no rush to cut rates. The CME_MINI:NQ1! tumbled 3%, the CME_MINI:SOX1! lost 4.1%, and bond futures plunged.
This morning, U.S. futures are up about 0.75% on headlines that Trump’s talks with Japanese negotiators are “going very well,” sparking rallies across Asia: Nikkei +1%, Hong Kong +2.7%, Shanghai +1%. It seems even a whiff of détente with Japan sends everyone scrambling back into risk assets.
On commodities, BLACKBULL:WTI jumps to $63.35 amid fresh U.S. sanctions on Iran and OPEC output cuts; OANDA:XAUUSD rockets to $3,352 /oz; INDEX:BTCUSD hovers near $83,500.
Today watch the ECB’s rate cut, Powell’s next speech, Philly Fed and jobless claims before the Good Friday shutdown. With Trump’s erratic tariff theatrics and Powell’s warning of higher inflation and slower growth, volatility is set to reign supreme. Buckle up.

$SPY Recap of April 16 2025Awesome drop all the way down to the bottom of the implied move.
The spreads I suggested in last night's video filled at the end of the day and closed up 100% 🙌🏼
Let's do it again tomorrow!!

SpY...BULLISH (for now)High and tight flag on nearly every time horizon....Today's price action foreshadowed---the rare pattern was popping off like firecrackers---but here comes the roman candle. I think it's one last bull run before we do a bit more correcting....
Bulls and Bears Oh myhmmm up to test resistance. Possibly fill the 550ish gap if it goes a little wild... head and shoulders also on the table

Nightly $SPY / $SPX Scenarios for April 17, 2025🔮 🔮
🌍 Market-Moving News 🌍:
🇪🇺 ECB Expected to Cut Rates Amid Trade Pressures: The European Central Bank is anticipated to reduce its deposit rate by 25 basis points to 2.25% during its meeting on April 17. This expected move aims to counteract the economic impact of recent U.S. tariffs and a strengthening euro, which have contributed to disinflationary pressures in the eurozone.
📉 German Inflation Decline Supports Easing: Germany's inflation rate fell more than expected in March, dropping to 2.3% from 2.6% in February. This decline, driven by falling oil prices and a sluggish economy, bolsters the case for further interest rate cuts by the ECB.
🤖 AI Enhances ECB Policy Predictions: A study by the German Institute for Economic Research indicates that artificial intelligence significantly improves the accuracy of forecasting ECB monetary policy decisions. By analyzing ECB communications, AI models can better anticipate policy shifts.
📊 Key Data Releases 📊
📅 Thursday, April 17:
🏠 Housing Starts (8:30 AM ET):
Forecast: 1.420 million
Previous: 1.501 million
Indicates the number of new residential construction projects begun, reflecting housing market strength.
🏭 Philadelphia Fed Manufacturing Survey (8:30 AM ET):
Forecast: 3.7
Previous: 12.5
Measures manufacturing activity in the Philadelphia region, providing insights into sector health.
📈 Initial Jobless Claims (8:30 AM ET):
Forecast: 223,000
Previous: 223,000
Reports the number of individuals filing for unemployment benefits for the first time, reflecting labor market conditions.
⚠️ Disclaimer: This information is for educational and informational purposes only and should not be construed as financial advice. Always consult a licensed financial advisor before making investment decisions.
📌 #trading #stockmarket #economy #news #trendtao #charting #technicalanalysis

SPY CRACK! WARNING!We are in the "honey" phase in Stocks.
This is the part where they tell you:
-Don't panic
-Stocks are cheap forward EPS
-Nible on the way down
-Diversified portfolio wins..
-It's a stock picker's market
-There is a lot of cash on the sidelines
-It's just a reset
-It's a correction
-We needed this to shake out the weak hands
-Buy when there is blood in the streets, even if it's yours
-There is a lot of value in...
-This is your last chance to...
-This and that stock are going to $1,000
-Stocks are the best investment over the course of time
The list is endless to get you to buy or stay in and suck up the pain. They will "Future Fuke" you the world.
I will remind you that you cannot buy unless you first sell! No one has endless money, and your 1% addition monthly will not lower your cost basis.
All I can tell you is what this chart shows! A BIG CRACK!
WARNING!!!
Click like, follow, subscribe, and let me help you navigate these crazy markets.

Non-US ETFs outperform during trade warNon-US markets are showing resilience during this year's remarkable volatility.
While NASDAQ:QQQ and AMEX:SPY are down more than 10%, AMEX:VEA (non-U.S. Developed Markets ETF) is up nearly 5%...
AMEX:IEMG (tracking Emerging Markets) is negative so far, but less severe than others. Will Trump's volatile trade war lead to further outflow from the U.S. financial system?
Meanwhile, gold has been rallying to record highs as the world seeks an alternative to the dollar.

A break back above 530 could trigger a move toward 550Look for a strong move higher if the market breaks back above 530. Currently falling on below average volume and could see the market recover abruptly.

Down likely continuesWe had a short squeeze this morning, but the wave now looks like a C down to 521 or 512 on AMEX:SPY

SPY, NVDA, TSLA, AAPL: Certainty Amid the ‘Uncertainty’ Buzz
AMEX:SPY , NASDAQ:NVDA , NASDAQ:TSLA , NASDAQ:AAPL ,...everybody is talking about uncertainty, but much looks certain-: we are transitioning from a Keynesian to an Adam Smith economic policy. Ironing of trade barriers is part of the package, along with deflation of lofty valuations associated with goldilocks scenarios financed by federal debt increases.. Will they deflate in big nominal fashion like last month or in contained fashion such as one buffered by inflation? At some point productivity should be greater than today, and if Buffet will be around he will again act as canary in the in coal mine.

BEAR TRAP in SPY?🐻 BEAR TRAP in SPY?
After a sharp correction, SPY is showing a possible Bear Trap formation — right at the zone where the market often catches short sellers off guard.
📊 The pattern resembles the "First Sentiment Extreme" > Shakeout > Bear Trap phase from the classic market psychology cycle (see inset chart).
🔍 Supporting signs:
RSI bouncing off oversold territory (currently at 49.32)
MACD showing a bullish crossover forming
A strong bounce after a panic flush
If this is indeed a bear trap... 📈 we could be at the early stage of renewed optimism. The next few candles are crucial — confirmation could ignite a sharp reversal.
🧠 Don’t chase. Wait for confirmation. But stay alert.

SPY - support & resistant areas for today April 16 2025These are Support and Resistance lines for today April 16 2025 and will not be valid for next day. Mark these in your chart by clicking grab this below.
Yellow Lines: Heavily S/R areas, price action will start when closing in on these.
White Lines: Are SL, TP or Mid Level Support and Resistance Areas, these are traded if consolidation take place on them.

Do the Bears have it?So far, I'm sure no one is surprised where we are with SPY. From a charting perspective, we are still in a nice, long-term bullish trend. The short term is the issue. SPY is still trending downward, and until we can break through that upper resistance, I am bearish. We are also sitting right between the 100 & 200ma on the weekly chart, so there is still room for da bears. (I still want SPY @ $466, 200MA.) The good news is, price is making good swings, so you can still carve out wins! Stay optimistic!
C.

SPY T&A Patterns and breaks I see the INV C&H formation, but I am still leaning bullish, watch for the confirmations and the Gap fill. News will be key!!!!
SPY/QQQ Plan Your Trade For 4-15 : BLANK pattern day.As I stated in this video, last night I looked through the data and could not find any reference for this pattern going back more than 11 years. Same thing for tomorrow's pattern.
That means these are very RARE pattern setups and we'll have to watch to see how price action plays out today.
If there were no reference points over 11+ years of Daily price data (more than 2500 Daily Price Bars), then this is something very unique.
I believe today will act like a Reversal Bar. Potentially rallying off a lower opening price and setting up a type of Gap Lower Rally type of pattern - but that is just a guess.
At this point, trade smaller quantities until we see how price reacts this morning.
Gold and Silver make a BIG MOVE overnight - breaking above the $3300/$33 levels I suggested were critical psychological levels.
This is an INCREDIBLE rally in metals (thanks, China).
At this point, if you were long metals like I was, you can thank me all you want.
Be aware that metals will likely pause a bit above this psychological level, then start to move higher again.
The next big target is $3600-$3750 for Gold.
Bitcoin is doing exactly what I stated it would do - rolling into a top as demand for BTCUSD wanes. I believe the next low for BTCUSD will be closer to $60k-$63k. Pay attention.
Going to be a good day for everyone holding Gold/Silver/Miners CALLS (like I kept suggesting).
GOT SOME.
#trading #research #investing #tradingalgos #tradingsignals #cycles #fibonacci #elliotwave #modelingsystems #stocks #bitcoin #btcusd #cryptos #spy #gold #nq #investing #trading #spytrading #spymarket #tradingmarket #stockmarket #silver

$SPY - RECAP APRIL 15 2025When someone tells me TA doesn’t work I just laugh and laugh. Ok, if you say so.
Look at that 30min 200MA today and yesterday. It just kept pushing price lower. Honestly quite beautiful actually.

SPY Weekly Options Trade Plan 2025-04-15AMEX:SPY SPY Weekly Analysis Summary (2025-04-15)
Below is an integrated view of the models’ findings:
─────────────────────────────
SUMMARY OF MODEL KEY POINTS
• Grok/xAI noted that on very short timeframes the price is a bit below key 5‑minute EMAs and near lower Bollinger Bands—with RSI and MACD giving mixed signals—but on the daily chart some bullish features (price above the 10‑EMA, a slight MACD bullish grace, and a max pain level at $549) hint at a potential mean reversion. Their “if forced” ramp suggested a call at the $549 strike, though overall confidence was low (≈55%).
• Gemini/Google’s report highlighted conflicting technical readings – the M5 setup looked bearish while the daily chart showed a little bullishness. Their integration of high but falling VIX and options open‑interest levels led to an overall neutral/unclear reading. Their recommendation was to refrain from entering a directional trade at open.
• Llama/Meta leaned toward a moderately bearish reading based on the short‐term indicators (price below key EMAs, bearish MACD on both charts) despite some daily support. They specifically recommended buying the $537 put option (even though the premium is higher than the “ideal” $0.30–$0.60 range) with a target profit roughly 50% above the cost and a stop when SPY breaches an upper resistance level—backed by a 70% confidence level.
• DeepSeek also synthesized mixed timeframes – pointing out that while the market holds some daily support, the intraday picture is muddled by technical conflict, expensive premium costs for the moves required, and time decay factors. Their view was to wait rather than initiate a new position.
─────────────────────────────
2. AREAS OF AGREEMENT AND DISAGREEMENT
• Agreement: All reports recognize that SPY (about $537.61) is trading near key short‑term support levels with significant options OI clustering. The falling VIX is universally noted as a positive sign for reducing fear even though overall volatility remains high.
• Disagreement:
– Grok’s report and to some extent the daily charts hint at a slight bias to the upside (supported by max pain at $549), suggesting a potential call wing trade.
– In contrast, Llama/Meta’s analysis and the very short‐term indicators (M5, lower Bollinger band, bearish MACD) point toward a bearish bias, recommending a put trade.
– Both Gemini/Google and DeepSeek, however, find the technical signals too mixed to have high confidence in initiating any naked single‑leg weekly option trade at open.
─────────────────────────────
3. CLEAR CONCLUSION
• Overall Market Direction Consensus:
The models collectively paint a picture of uncertainty. There is no clear, high‑conviction directional bias at the open. The short‑term (intraday) technicals lean bearish or at best neutral, while the daily chart and max pain argument hint at a potential slight mean reversion. Given these conflicting signals, the overall market direction remains neutral/unclear.
• Recommended Trade:
Based on the clash in opinions—only one model (Llama/Meta) would go short (with puts) while two models (Grok/xAI and Llama/Meta) suggest if forced a trade—and given that the majority (Gemini/Google and DeepSeek) advise against trading in the current conditions, the consensus is not to enter a new weekly options position at the market open.
– Strategy: Single‐leg, naked options (calls or puts)
– Expiration: Weekly options only (expiry April 17, 2025)
– Premium: Trading ideal premium range is $0.30–$0.60, but neither candidate in the call nor put space meets all our criteria with high conviction
– Entry Timing: At open would be the plan if a trade were to be placed
– Confidence: Overall confidence in any trade is low (<60%)
• Key Risks and Considerations:
– The short‑term technical indicators (lower EMAs, bearish M5 MACD, tight Bollinger bands) could trigger a whipsaw if SPY moves sideways or reverses abruptly.
– The high but falling VIX signals that although volatility is subsiding, levels remain elevated.
– Time decay (theta) on weekly options is significant at the open, and the probability of a strong directional move is diminished without further confirmation during the session.
– Conflicting signals between daily trend (some bullish pointers) and intraday behavior reduce the reliability of a directional play.
─────────────────────────────
4. FINAL RECOMMENDATION
Given the model consensus with mixed and conflicting signals, the recommendation is to NOT trade weekly SPY options at market open today.
─────────────────────────────
TRADE_DETAILS (JSON Format)
{
"instrument": null,
"direction": null,
"strike": null,
"expiry": null,
"confidence": null,
"profit_target": null,
"stop_loss": null,
"size": null,
"entry_price": null,
"entry_timing": null
}
Disclaimer: This newsletter is not trading or investment advice but for general informational purposes only. This newsletter represents my personal opinions based on proprietary research which I am sharing publicly as my personal blog. Futures, stocks, and options trading of any kind involves a lot of risk. No guarantee of any profit whatsoever is made. In fact, you may lose everything you have. So be very careful. I guarantee no profit whatsoever, You assume the entire cost and risk of any trading or investing activities you choose to undertake. You are solely responsible for making your own investment decisions. Owners/authors of this newsletter, its representatives, its principals, its moderators, and its members, are NOT registered as securities broker-dealers or investment advisors either with the U.S. Securities and Exchange Commission, CFTC, or with any other securities/regulatory authority. Consult with a registered investment advisor, broker-dealer, and/or financial advisor. By reading and using this newsletter or any of my publications, you are agreeing to these terms. Any screenshots used here are courtesy of TradingView. I am just an end user with no affiliations with them. Information and quotes shared in this blog can be 100% wrong. Markets are risky and can go to 0 at any time. Furthermore, you will not share or copy any content in this blog as it is the authors' IP. By reading this blog, you accept these terms of conditions and acknowledge I am sharing this blog as my personal trading journal, nothing more.

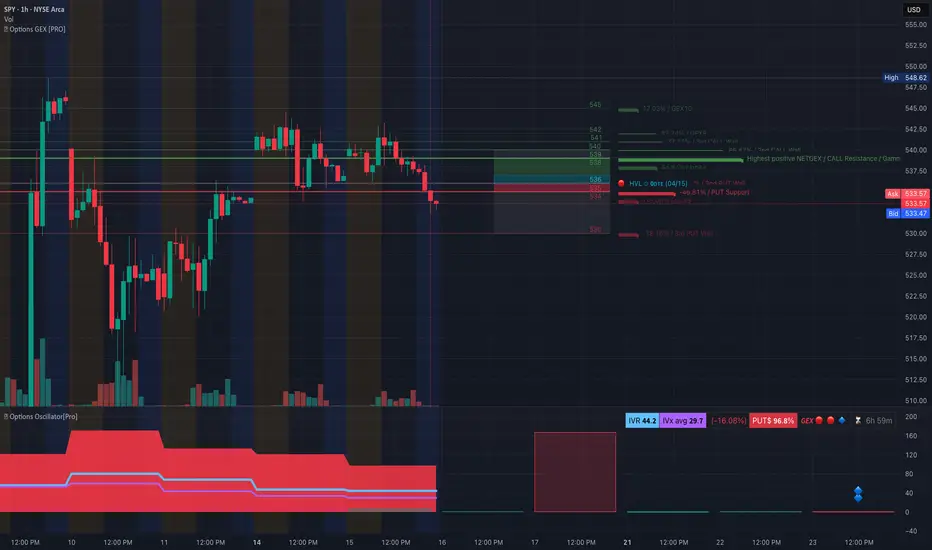
SPY Hits Critical Gamma Level at 533 – Breakdown or Bounce? Market Awaits Trigger 🎯
🔮 GEX (Gamma Exposure) – Options Sentiment Analysis
🔥 Gamma Hotspot at 533 – Dealers in Trouble Below
* SPY is sitting right on the highest negative NET GEX zone at 533.57, indicating heavy dealer long gamma exposure.
* If price holds above, dealers may stabilize the market — but if 533 breaks, the path toward 530 and possibly 519.92 opens quickly due to forced hedging.
📉 Call Walls Block the Path Above
* CALL resistance stacks from 536–538–540, with a gamma ceiling forming around 538, where net positive GEX peaks.
* Above that, 544–545 is a tough zone to reclaim short term unless a macro tailwind hits.
📊 Options Sentiment Snapshot:
* IVR: 44.2 → Volatility expectations are moderate but stable.
* IVx avg: 29.7, dropping –16.08%, suggesting traders are defensively positioned with volatility being sold.
* PUTs 96.8% → This is extreme — a highly bearish options environment, making SPY susceptible to gamma-induced plunges if price cracks lower.
🎯 GEX Flow Outlook:
* Below 533: Fast move to 530, then potential gamma landslide toward 519.92 and beyond.
* Above 536: Bulls need to reclaim VWAP and move toward 538+ to flip gamma positioning and trap short hedgers.
🕰️ 1-Hour Technical Analysis
Trend:
* SPY broke down from a rising wedge and lost EMA/VWAP support on accelerating volume.
* Price is hugging the lower channel support — breakdown is in play unless a fast reversal occurs.
MACD:
* Weakening with a bearish crossover — confirms downward momentum building.
RSI:
* Falling under 40 with no bullish divergence — sellers still in control.
Key Levels:
* Support: 533.5 → 530 → 519.92 → 485.26
* Resistance: 536 → 538 → 544.62
🧠 Final Thoughts:
SPY is teetering at a gamma tipping point. With over 96% of flow favoring PUTs, dealers are in a short gamma setup — and price under 533 risks triggering a cascade toward 530 or even 520 if broader indices follow.
However, if bulls can reclaim VWAP and 536+, a reversal squeeze could target 538 or higher.
Stay nimble — this is a GEX-powered market waiting for its next catalyst.
This analysis is for educational purposes only and does not constitute financial advice. Always confirm with price action and use proper risk management.
Nightly $SPY / $SPX Scenarios for April 16, 2025🔮 🔮
🌍 Market-Moving News 🌍:
🗣️ Federal Reserve Speeches: Federal Reserve Chair Jerome Powell is scheduled to speak at 1:30 PM ET, providing insights into the economic outlook and potential monetary policy adjustments. Additionally, Cleveland Fed President Loretta Mester will speak at 12:00 PM ET, and Kansas City Fed President Jeffrey Schmid and Dallas Fed President Lorie Logan will speak at 7:00 PM ET.
📊 Key Data Releases 📊
📅 Wednesday, April 16:
🛍️ Retail Sales (8:30 AM ET):
Forecast: +1.2%
Previous: +0.2%
Measures the total receipts of retail stores, reflecting consumer spending trends.
🏭 Industrial Production (9:15 AM ET):
Forecast: -0.1%
Previous: +0.7%
Indicates the output of the nation's factories, mines, and utilities.
🏠 Homebuilder Confidence Index (10:00 AM ET):
Forecast: 37
Previous: 39
Assesses the confidence of homebuilders in the market for newly built single-family homes.
⚠️ Disclaimer: This information is for educational and informational purposes only and should not be construed as financial advice. Always consult a licensed financial advisor before making investment decisions.
📌 #trading #stockmarket #economy #news #trendtao #charting #technicalanalysis
