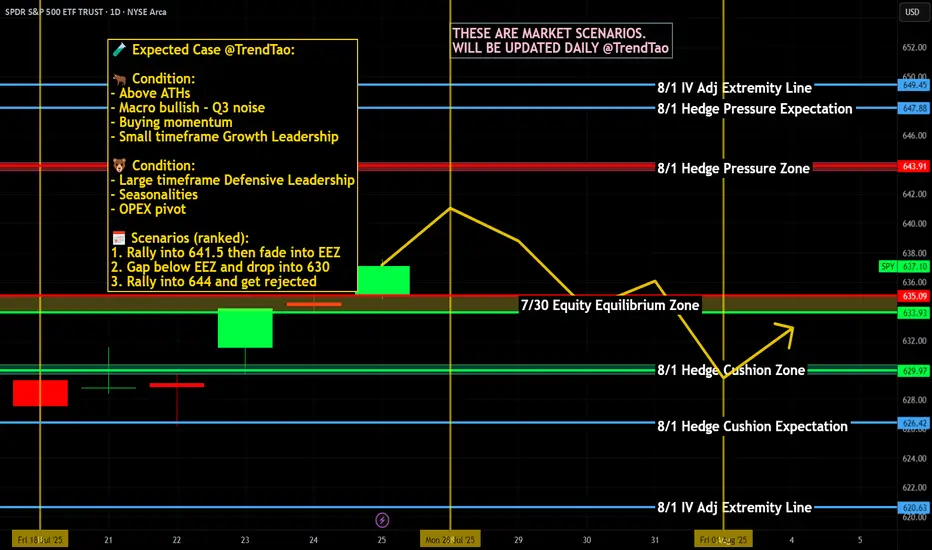
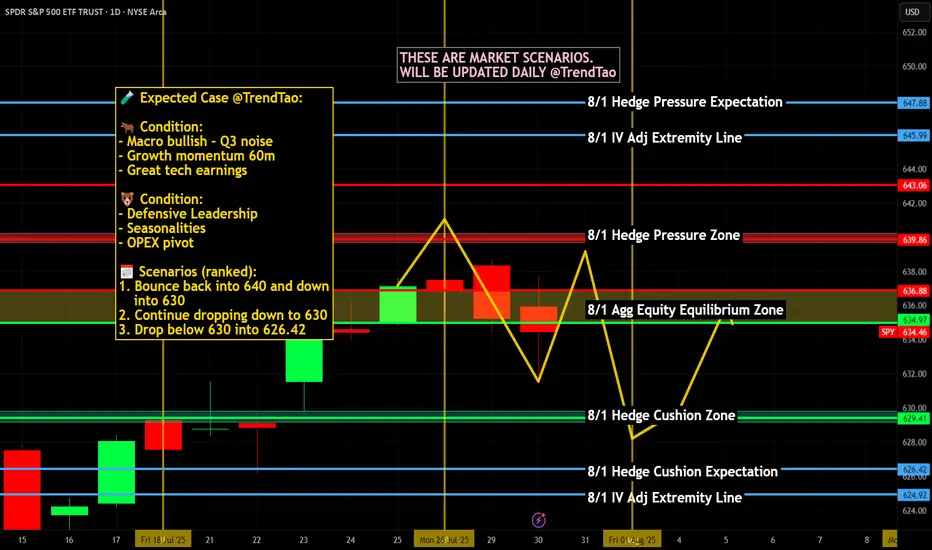
Weekly $SPY / $SPX Scenarios for July 28–August 1, 2025🔮 Weekly AMEX:SPY / SP:SPX Scenarios for July 28–August 1, 2025 🔮
🌍 Market‑Moving News 🌍
🏦 Fed Holds Steady, Faces Political Pressure
The Federal Reserve is expected to keep rates at 4.25%–4.50% during its FOMC meeting midweek. While rates are unchanged, political pressure from President Trump continues as calls intensify for rate cuts and questions arise over the Fed’s independence—including dissent from Governors Waller and Bowman.
📦 Trade Truce Extends & New Deal With EU
A new trade framework with the EU reduces tariffs to 15%, easing tensions. Meanwhile, U.S. and Chinese trade teams begin talks in Stockholm on Monday aiming to avoid an early-August tariff deadline.
💻 Tech and Mega-Cap Earnings Spotlight
This week features earnings from tech giants including Meta, Microsoft (Wednesday), followed by Amazon and Apple (Thursday). Markets will prioritize forward guidance around AI investments, capital expenditures, and sales trends.
📊 Key Data Releases & Events 📊
📅 Monday, July 28
No major releases
📅 Tuesday, July 29
Chicago PMI (July flash) – early indicator of regional manufacturing trends.
Global PMIs – flash readings for Europe and Asia gauge economic health.
📅 Wednesday, July 30
FOMC Rate Decision & Powell Press Conference – investors will scrutinize tone, forward guidance on rates, labor markets, and inflation.
Q2 U.S. GDP (Advance Estimate) – expected at ~1.9%, signaling rebound after Q1 contraction.
📅 Thursday, July 31
June PCE & Core PCE Indexes – Fed’s preferred inflation measure. Core PCE expected at ~2.7% YoY.
Consumer Confidence (July) – key for household spending trends.
Trade Balance (June) – provides data on U.S. import/export dynamics.
📅 Friday, August 1
July Nonfarm Payrolls, Unemployment & Wage Data – forecast for ~102,000 new jobs and ~4.2% unemployment; markets await for labor-market cooling signs.
Tariff Deadline – new tariffs loom unless trade agreements with EU, Canada, China etc. materialize by today’s cutoff.
⚠️ Disclaimer:
This summary is educational and informational only. It is not financial advice. Always consult a licensed financial advisor before making any investment decisions.
📌 #trading #stockmarket #economy #Fed #earnings #inflation #tariffs #GDP #PCE #jobs #technicalanalysis
SPY trade ideas
SPY Forming A Bearish Head and Shoulders PatternSPX Technical Update – Bearish Watch
Chart Focus: S&P 500 Index (30-Min Chart)
Date: July 21, 2025
🧠 Pattern Watch: Classic Head & Shoulders Formation
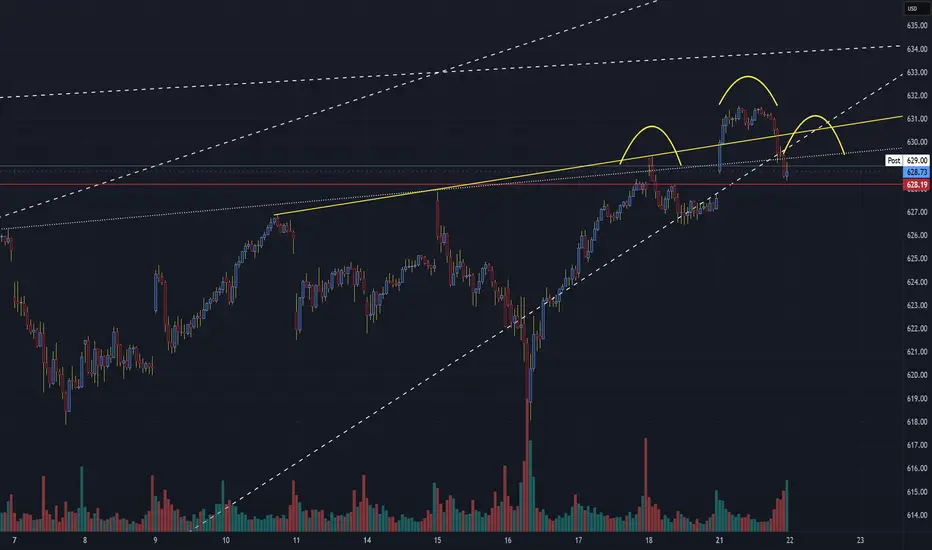
A clear head and shoulders pattern has emerged on the short-term 30-minute chart, signaling a potential bearish reversal after the recent uptrend.
Left Shoulder: Around 630.75
Head: Peaked near 633.00
Right Shoulder: Capped just under 631.00
Neckline: Sits near the 628.75–628.20 zone, marked by a yellow upward-sloping trendline and tested support.
📉 Bearish Breakdown in Play
The price has now broken below the neckline zone at 628.75 with increasing volume — an early confirmation of a bearish break.
The break beneath the rising wedge support and neckline suggests increased downside risk in the near term.
🧭 Technical Levels to Watch
Key Level Type Action
633.00 Resistance (Head) Likely capped unless strong reversal
631.00 Resistance Right shoulder, overhead rejection
628.75 Neckline Support (Broken) Bearish trigger zone
628.20 Intraday support Final support test (now resistance)
625.50 Initial Target Breakdown projection
622.75 Lower Support Measured move target zone
📌 Measured Move Projection:
A break of ~4.5 points from head to neckline projects a target near 624–625 in the near term.
📊 Volume Profile Note
Volume expanded on the neckline break, supporting the validity of the pattern.
Recent bars show a rise in selling pressure as bulls failed to reclaim above 630 after the breakdown.
🔍 Summary Outlook
Bearish Bias: Valid while below 628.75 neckline resistance.
Invalidation Zone: A sustained close above 631.00 would invalidate the bearish pattern.
Watch for Retest: Any bounce into 628.75–629.25 could act as a retest and fade opportunity.
📆 Next Steps:
Short-term traders should monitor price action around 625.50 and 622.75 as the most likely zones for support. Watch for further confirmation with broader index weakness or macro catalysts.
SPY CONTINUES IN AN ASCENDING WEDGE PATTERNThe SPDR S&P 500 ETF Trust (SPY) is currently exhibiting an ascending wedge pattern on the 30-minute chart, a bearish technical pattern that often signals a potential reversal or selloff when confirmed. Below, I’ll explain the ascending wedge pattern, identify key levels to watch for a potential selloff, and provide context based on recent market sentiment. Since I cannot view the real-time chart, I’ll base the analysis on the characteristics of an ascending wedge and recent posts on X that discuss SPY’s price action, ensuring a critical approach to the data.
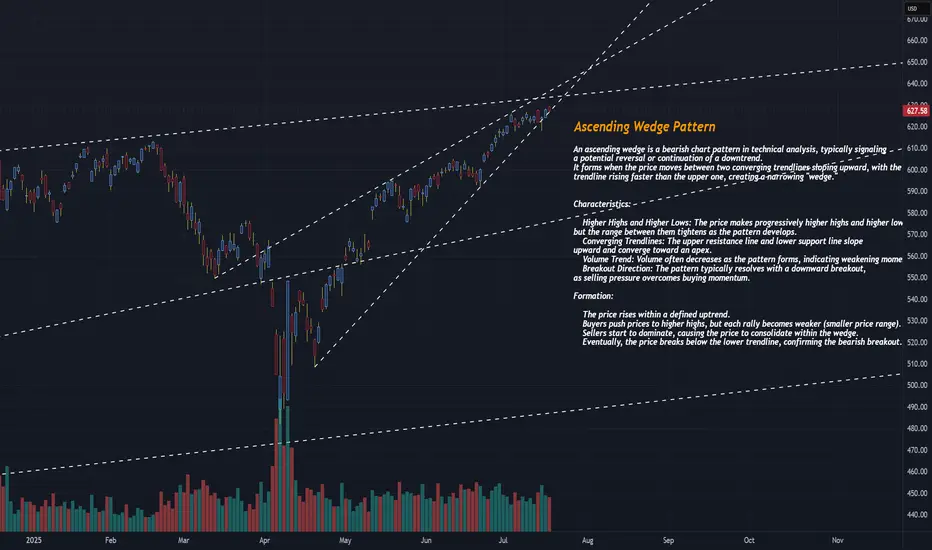
What is an Ascending Wedge Pattern?
An ascending wedge (or rising wedge) is a bearish chart pattern formed when the price consolidates between two upward-sloping trendlines that converge over time. The upper trendline (resistance) connects higher highs, and the lower trendline (support) connects higher lows, creating a narrowing price range. This pattern typically indicates that bullish momentum is weakening, as buyers are pushing prices higher but with diminishing strength, often leading to a breakdown below the lower trendline.
Key characteristics of an ascending wedge include:
Converging Trendlines: Both the support and resistance lines slope upward, with the support line often steeper than the resistance line.
Decreasing Volume: Trading volume typically declines as the pattern forms, reflecting reduced buying conviction. A spike in volume often accompanies a breakout or breakdown.
Bearish Implication: In an uptrend, the ascending wedge signals a potential reversal to the downside. In a downtrend, it may act as a continuation pattern, but the bearish bias remains.
Breakout Confirmation: A convincing break below the lower trendline, preferably with increased volume, confirms the bearish reversal. A retest of the broken support (now resistance) may occur before further declines.
The pattern typically forms over 3–4 weeks but can appear on shorter timeframes like the 30-minute chart, making it relevant for intraday or short-term traders.investopedia.comen.wikipedia.org
SPY’s Current Ascending Wedge on the 30-Minute Chart
Given that SPY is in an ascending wedge on the 30-minute chart, we can infer the following based on recent posts on X and general technical analysis principles:
Pattern Context:
The ascending wedge suggests SPY has been making higher highs and higher lows in a tightening range, indicating a potential exhaustion of the bullish trend.
Recent posts on X (e.g., @AskPerplexity on July 16, 2025) noted a rising wedge in SPY with a breakdown through the lower trendline, suggesting bearish momentum. Another post (@YakshuMadaan on July 15, 2025) mentioned a wedge breaking below 6220, targeting 6050 on the S&P 500 index ( SP:SPX ), which correlates to SPY levels around $605–$610.
Key Levels to Watch:
Lower Trendline (Support): The critical level to monitor is the lower trendline of the wedge, which connects the higher lows. A decisive break below this level (e.g., a close below on the 30-minute chart with strong volume) signals a bearish breakdown and potential selloff. Based on recent X posts, this level may have been around $622 (equivalent to ~6220 on SP:SPX ) recently, but you should confirm the exact level on the current chart.
Upper Trendline (Resistance): The upper trendline connects the higher highs and acts as resistance. If SPY fails to break above this level, it reinforces the bearish bias. This could be near recent highs, potentially around $630–$635, depending on the chart’s progression.
Support Zones Post-Breakdown: If the lower trendline breaks, key support levels to watch include:
$590–$600: A post on X highlighted this as a major support zone based on volume profile analysis, likely corresponding to a prior consolidation area or gap fill.
$605–$610: Another post suggested a target of 6050 on SP:SPX , translating to roughly $605–$610 for SPY, aligning with a significant retracement level.
Retest Level: After a breakdown, the price may retest the broken lower trendline (now resistance). For example, if the breakdown occurs at $622, a retest could see SPY rally back to $622–$625 before resuming the decline.ig.com
Volume and Indicators:
Volume: Look for declining volume as the wedge forms, followed by a spike on the breakdown to confirm the move. Low volume during the wedge suggests waning bullish momentum.xs.com
Relative Strength Index (RSI): An RSI above 70 near the upper trendline or showing bearish divergence (lower RSI highs while price makes higher highs) strengthens the case for a selloff.xs.com
Moving Average Convergence Divergence (MACD): A bearish crossover (MACD line crossing below the signal line) near the upper trendline can confirm weakening momentum.xs.com
Potential Selloff Triggers:
A close below the lower trendline on the 30-minute chart, especially with a spike in volume, is the primary trigger for a selloff. For example, a break below $622 (if that’s the current support) could initiate a move toward $605–$610 or lower to $590–$600.
A failed retest of the broken trendline (e.g., SPY rallies to $622–$625 after breaking down but fails to reclaim the trendline) would confirm bearish continuation.
Broader Market Context: Recent X posts suggest market concerns about macroeconomic factors (e.g., interest rate fears, policy shifts) could amplify a selloff, especially if technical levels break.
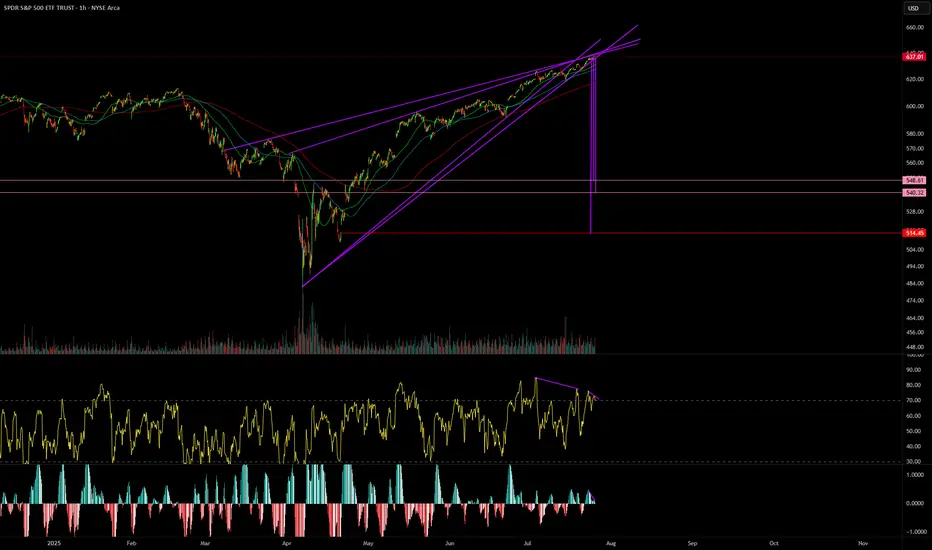
SPY Imagine the SmellImagine the smell from the Bulls if the $514 gap is filled.
Bearish divergence galore.
Not a matter of if this wedge breaks.
Its when.
Stock Market Forecast | TSLA NVDA AAPL AMZN META MSFTStock Market Forecast | CME_MINI:NQ1! CME_MINI:ES1! SPY QQQ
Mag 7 forecast NASDAQ:TSLA NASDAQ:NVDA AAPL AMZN META MSFT GOOG

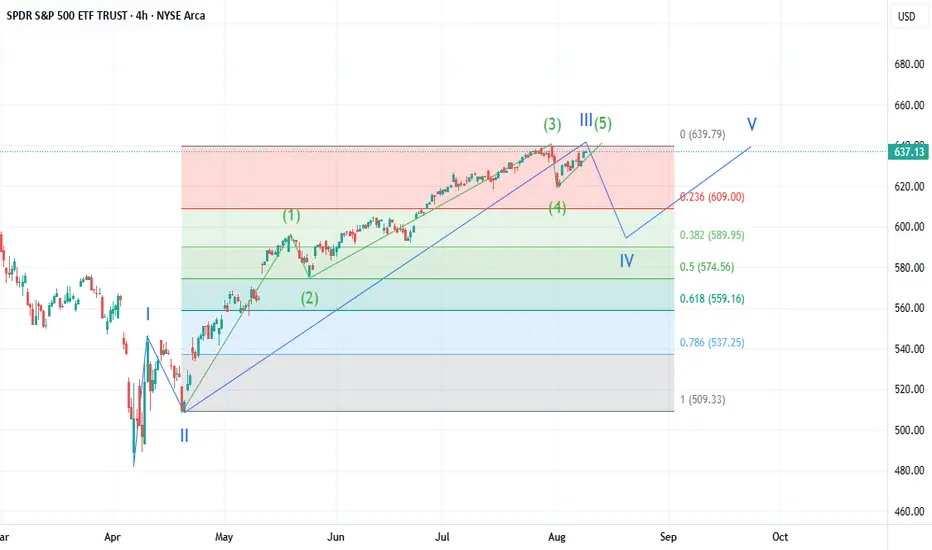
SPY: End of Wave 3Based on how I see the wave structure of SPY, SPX, NQ1, and QQQ, it seems more likely that we are at the end of Wave 3 rather than Wave 5. Over the next 2 to 4 weeks, I expect a sharp decline in SPY to 591 before a final rally to 640 - 660.
My Spy chartMy Spy chart with the same ghost levels.
As you can see, these levels hold up nicely going al the way back to 1999 - Now
Hope ths helps. Have a wonderful Friday and God Bless.

2 Way StreetReal Quick:
Price is bouncing off my zone. Which could lead to a bigger push higher to my 2nd tp.
Or it could be a trap, leading into a bearish divergence. That could be bad.
Im still somewhat bullish, but I doalready locked in some profits.
“Disclaimer: The information provided is NOT financial advice. I am not a financial adviser, accountant or the like. This information is purely from my own due diligence and an expression of my thoughts, my opinions based on my personal experiences, and the way I transact.

Weekly $SPY / $SPX Scenarios for August 4–8, 2025🔮 Weekly AMEX:SPY / SP:SPX Scenarios for August 4–8, 2025 🔮
🌍 Market-Moving News 🌍
📦 U.S. Tariffs Finalized as August 7 Deadline Nears
President Trump’s administration confirmed newly finalized tariff rates—ranging from 10% to over 40%—on dozens of countries, set to take effect starting August 7. The announcement has heightened global trade uncertainty and injected volatility into equity markets
📉 Weak Jobs Data Spurs Concern
July’s nonfarm payrolls came in at just 73,000 jobs added, far below expectations, while revisions to May and June data subtracted a combined 258,000 jobs. In response, the administration fired the Bureau of Labor Statistics head, escalating political risk around economic transparency
📈 U.S. Shows Resilience Amid Policy Chaos
Despite the tariff-era turbulence and labor softness, U.S. Q2 GDP rose by 3%—outperforming forecasts. Businesses racked up inventory as a hedge, absorbing initial price shocks. Still, concerns about sustained inflation pressures and waning consumer confidence linger
🎯 Earnings Week Spotlight on Tech & Industrial Names
Major companies reporting include Palantir (Monday), AMD, Uber, Disney, McDonald’s, Gilead, Pfizer, Constellation Energy, and Eli Lilly. Markets will watch for AI signals, consumer demand, and industrial trends
📊 Key Data Releases & Events 📊
📅 Monday, August 4
Factory Orders (June) — Critical for industrial demand and trade momentum.
📅 Tuesday, August 5
ISM U.S. Services PMI (July) — Thermometer for expansion in the biggest part of the economy.
S&P U.S. Services PMI (July, flash) — Preliminary signal on service-sector strength.
Trade Balance (June) — Watching for impact of tariffs and shifting cross-border flows.
📅 Thursday, August 7
Initial & Continuing Jobless Claims — Weekly labor-market readings post weak payroll report.
Productivity & Labor Costs (Q2) — Reflect business efficiency and wage trend shifts.
Wholesale Inventories (June) — Key for supply-chain and inventory cycle insights.
Consumer Credit (June) — Measures household borrowing resilience.
📅 Friday, August 8
Fed Speech: St. Louis Fed President Musalem — Market-watchers will look for cues on the near-term rate path.
⚠️ Disclaimer:
This weekly outlook is for educational and informational purposes only and should not be construed as financial advice. Always consult a licensed financial advisor before making investment decisions.
📌 #trading #stockmarket #economy #tariffs #jobs #earnings #inflation #Fed #technicalanalysis
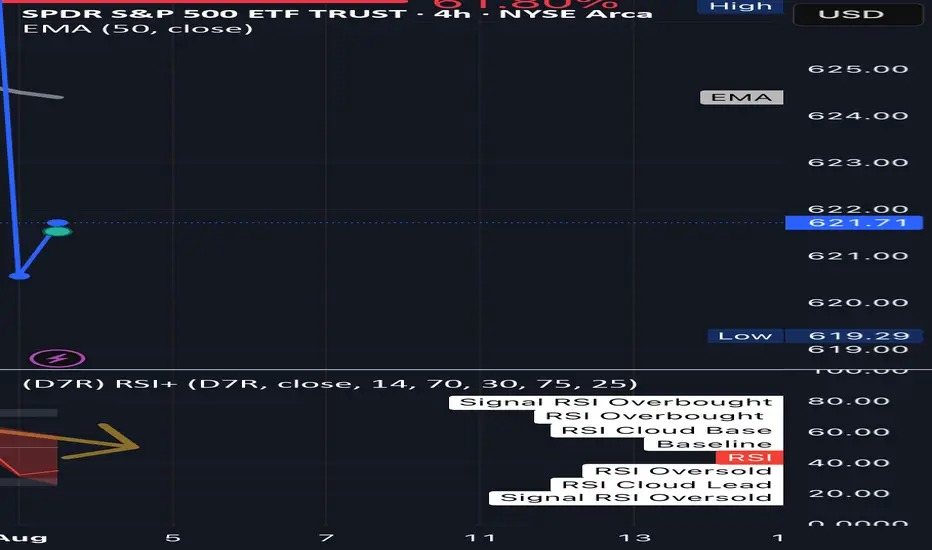
SPY 4H – Broke the Fib… Now What? Just Sharing What I See Hey People,
not an expert, just showing what i’m seeing on the 4H chart 👇
🧭 quick breakdown:
SPY ran up to around 639, then started dumping.
i dropped a fib from top to bottom and it hit the 61.8% level (626.66)… then lost it.
right now we’re sitting around 621, so it already broke a big level.
🧠 what that might mean:
if price gets back above 626, maybe we bounce back toward **629**
if not, and it keeps chilling under that **50 EMA (around 624)**, it’s probably still weak
nothing confirmed yet, i’m just watching how price moves around those spots.
⚠️ RSi is sketchy too:
rsi is making lower highs, even when price was up; that’s called bearish divergence
basically means momentum isn’t really behind the move
📉 If it keeps dropping:
if we lose 621, next support might be around **615**
and if that breaks? maybe even **610 gets swept** before any bounce
📝 Just how i’m seeing it rn:
not calling anything, just building my plan out loud
Still learning. open to feedback if you see something different
what levels are you watching?
I want everyone to win. 💛
SPY: Growth & Bullish Forecast
The price of SPY will most likely increase soon enough, due to the demand beginning to exceed supply which we can see by looking at the chart of the pair.
Disclosure: I am part of Trade Nation's Influencer program and receive a monthly fee for using their TradingView charts in my analysis.
❤️ Please, support our work with like & comment! ❤️

SPY bears finally show up. Here are my targetsLong term charts still look perfectly fine, and I'm not interested in fighting bears on the first day they show up in months. Here are the targets I'm looking at to find potential support

FIBO touch and goPretty violent last couple of days in July, but I honestly think it might be over for now. Price action couldn't break past .38 fibo retracement. If I'm right we could see continuation of uptrend in coming weeks.
Nightly $SPY / $SPX Scenarios for July 31, 2025🔮 Nightly AMEX:SPY / SP:SPX Scenarios for July 31, 2025 🔮
🌍 Market-Moving News 🌍
🏦 Fed Holds Rates — Dissent Indicates Division
The Federal Reserve maintained its benchmark rate at 4.25%–4.50%. Notably, two governors—Christopher Waller and Michelle Bowman—dissented in favor of a 25 bp rate cut, underscoring internal divisions amid growing political pressure
📈 Strong Q2 Growth, But No Rate-Cut Signal
U.S. GDP expanded at a 3.0% annualized rate in Q2, rebounding sharply from Q1's contraction. Despite this, Powell emphasized persistent inflation, particularly from tariffs, reinforcing the Fed’s cautious policy stance
🛢️ Oil Climbs as Tariff Tensions Rise
Brent crude rose to ~$73.51 and WTI to ~$70.37 on fears of supply disruptions tied to President Trump’s threats of new tariffs on Russian oil and new tariffs imposed on Brazil and South Korea
📊 Key Data Releases & Events 📊
📅 Thursday, July 31:
8:30 AM ET – Initial Jobless Claims (week ending July 26)
Initial claims rose to 222,000, up from 217,000 previously—an early gauge of labor-market trends
8:30 AM ET – Employment Cost Index (Q2)
Quarterly growth in labor costs edged lower to 0.8%, down from 0.9%—a signal of moderate wage pressures
8:30 AM ET – Personal Income (June)
Data released on household income and spending patterns—crucial for assessing consumer resilience heading into Q3
⚠️ Disclaimer:
This information is for educational and informational purposes only and should not be construed as financial advice. Always consult a licensed financial advisor before making investment decisions.
📌 #trading #stockmarket #economy #Fed #inflation #jobs #technicalanalysis
Market Outlook: Bulls are still in control, but be defensive.At theses levels don't let your guard down. I could see us pulling back next week, meanwhile we may continue to stay above the 10-EMA for now.

SPY: Aiming 626 today Slowly./ Let's observe what this market will give us. If there is a setup, we take the trade.

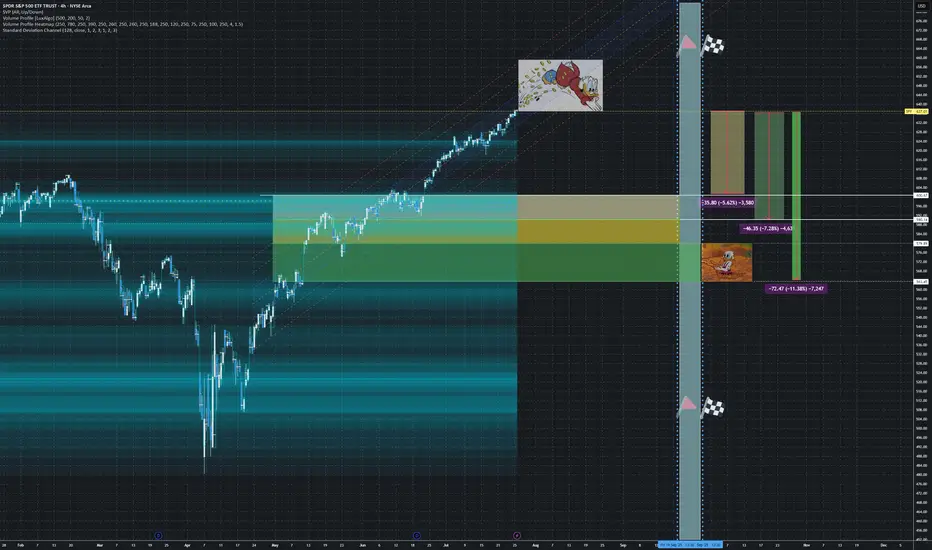
[$SPY] S&P500: The Big mini Short or Why hedging is not a crimeAMEX:SPY CBOE:XSP
No financial advice.
For Entertainment purpose only.
Have you ever considered to protect yourself and wake up from the 'Long-Only-Delirium'?
Now is the time.. do you hear the cracking in the bond-market?
Rate cutting will solve it?
No reason to panic?
Doomsday i*diot?
We will see... 😈 tic tac tic tac
This time THETA is against us, but GAMMA is bleeding.
📊 Strategy Characteristics
+++Note: We set this one as a 'Diagonal Ratio Put Spread'
> Diagonal: Because the options have different expiration dates (Sept 19 + Sept 30)
> Ratio: Because we are buying more puts than selling (4:2 ratio)
> Put Spread: Because both legs are puts with the same strike
"We are all at a wonderful ball where the champagne sparkles in every glass and soft laughter falls upon the summer air. We know, by the rules, that at some moment, the Black Horseman will come shattering through the great terrace doors, wreaking vengeance and scattering the survivors. Those who leave early are saved, but the ball is so splendid no one wants to leave while there is still time, so that everyone keeps asking, ‘What time is it? What time is it?’ But none of the clocks have any hands." ~George Goodman

[$SPY] S&P500: The Big mini Short or Why hedging is not a crimeAMEX:SPY
No financial advice.
For Entertainment purpose only.
Have you ever considered to protect yourself and wake up from the 'Long-Only-Delirium'?
Now is the time.. do you hear the cracking in the bond-market?
Rate cutting will solve it?
No reason to panic?
Doomsday i*diot?
We will see... 😈 tic tac tic tac
This time THETA is against us, but GAMMA is bleeding.
"We are all at a wonderful ball where the champagne sparkles in every glass and soft laughter falls upon the summer air. We know, by the rules, that at some moment, the Black Horseman will come shattering through the great terrace doors, wreaking vengeance and scattering the survivors. Those who leave early are saved, but the ball is so splendid no one wants to leave while there is still time, so that everyone keeps asking, ‘What time is it? What time is it?’ But none of the clocks have any hands." ~George Goodman
SPY: Pullback or No? Hey everyone,
Posting again for next week.
My thoughts, not advice as usual.
Hope you find them helpful and I hope you all have a great and sunny weekend!
Take care and safe trades!

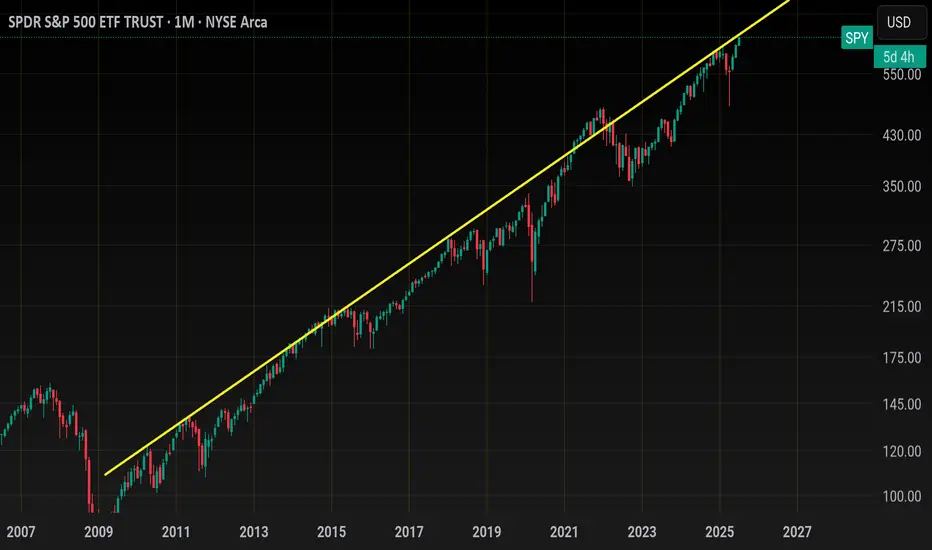
Spy.. 650 topLooking for a top this week
The top of this monthly trendline dating from 2009 should be tagged this week around 643-645.00. As you can see price can grind up here for weeks until the BIG drop.
That grind would possibly be distribution with
A range trade of 620-640 for the month of august. historically Sept is very bearish and could see a drop back below 600 then.
Summer price action looks like so
Smaller price action (Tradeable technicals)
Bull flag early July has us squeezing up this last leg here..
If we gap up Sunday night then i like the short around 638ish
If we gap down and flush i like the dip buy around 634 gap close with the next target being 640+
Daily candle closed outside Bbands so I would not long this on any gap up... on a big earnings week like this, there will be a shake out day or a flush to try and stop out all of those who bought long last week for this weeks earnings.
TVC:NYA or NYSE
Has also reached the top of its weekly channel here. 21,000 will be tough. Price could grind up here but I'd be careful trading anything non tech.
As far as tech goes
Here's NASDAQ:QQQ
monthly chart (Logarithmic)
We have room for 575-580
This should compliment Spy 550
Zoomed in on the daily chart and it's climbing back up to the resistance shown on the monthly
Hourly chart shows price action from early july... tight channel illustrates how frustrating the swings have been
562-563 is support heading into next week. If we have a major gap up Sunday night I would look to open short near 570 for a pullback before ER... if we gap down, I would buy the dip around 563 and average down if need be down to 561..
We should tag 575 this week
The sector that I think lags the most this week is the banking sector... AMEX:XLF
Banks outperform the entire market last week and are overheated at resistance I think they lag this week
I will update this more throughout the week if necessary..
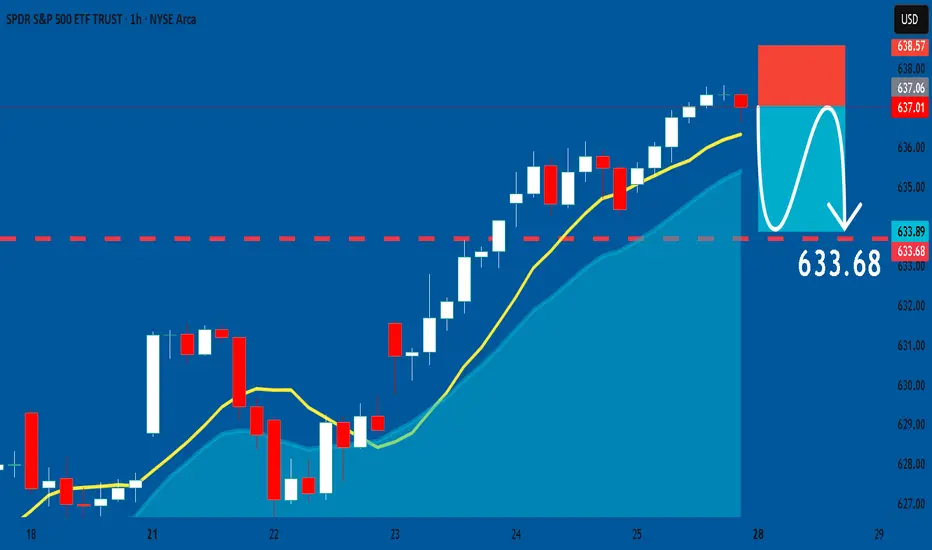
SPY: Bearish Continuation & Short Signal
SPY
- Classic bearish setup
- Our team expects bearish continuation
SUGGESTED TRADE:
Swing Trade
Short SPY
Entry Point - 637.01
Stop Loss - 638.57
Take Profit - 633.58
Our Risk - 1%
Start protection of your profits from lower levels
Disclosure: I am part of Trade Nation's Influencer program and receive a monthly fee for using their TradingView charts in my analysis.
❤️ Please, support our work with like & comment! ❤️
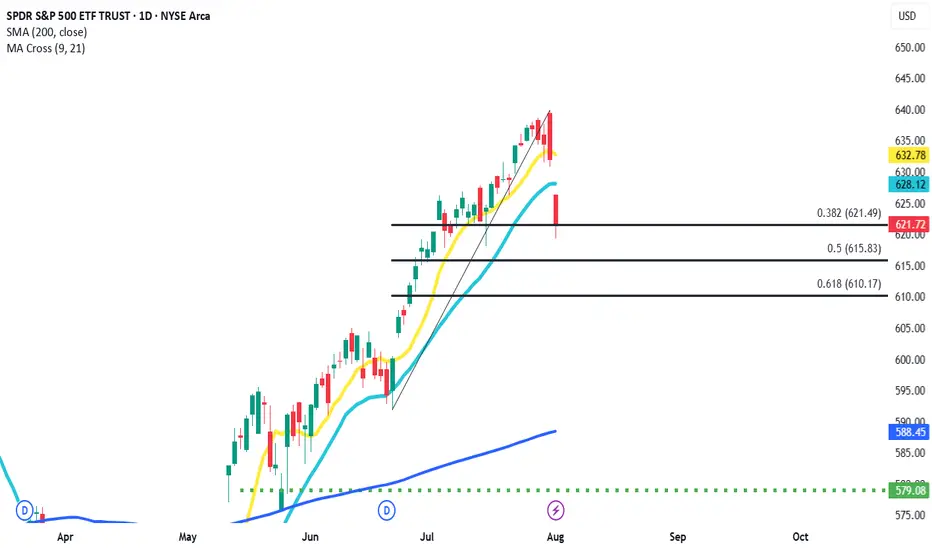
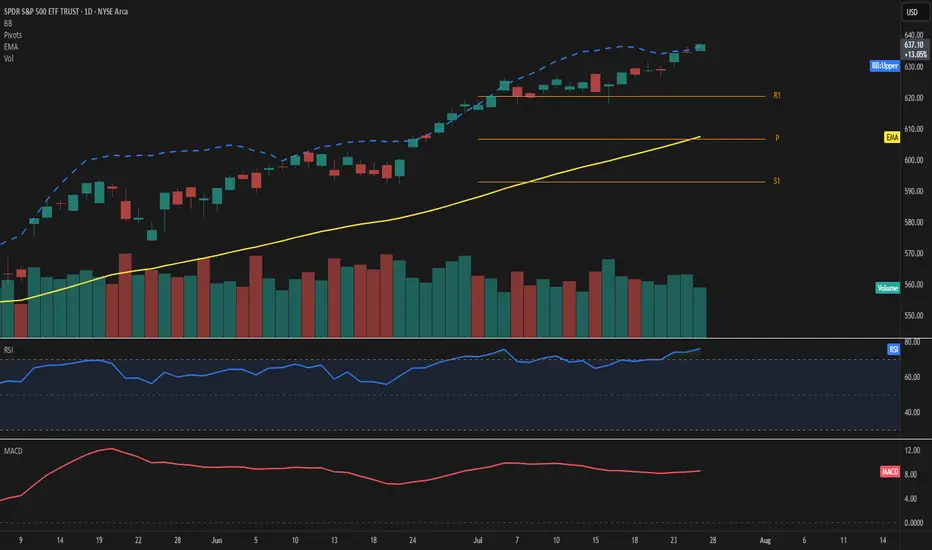
SPY – Explosive strength above resistancePrice extends well above the 50-day EMA and pierces through the upper Bollinger Band, highlighting strong bullish momentum. RSI stands at 76, confirming overbought conditions, while MACD remains firmly positive.
The ongoing move leaves the EMA50 at 608 and the Fibonacci pivot at 607—both now acting as key support levels. With R1 at 620 already surpassed, the next potential resistance zone lies in uncharted territory beyond 636.
Volume has decreased by over 20%, which tempers the move slightly and should be monitored closely.
As long as price holds above 620, the bullish scenario remains valid.
Watch for any sudden spike in volume or a drop back below 636 as a possible shift signal.
A tale of two wedgesIn early 2025 we’ve seen two classic wedge patterns on two of the market’s most watched charts: a falling wedge on the U.S. Dollar Index ( TVC:DXY ) and a rising wedge on the S&P 500 ETF ( AMEX:SPY ). Alone each tells its own tale—but together they sketch a tug‑of‑war between a fading dollar and resilient equities.
The Falling Wedge on DXY
A falling wedge in a downtrend signals waning bearish momentum and often precedes a bullish reversal once price breaks the upper trendline.
The Rising Wedge on SPY
A rising wedge in an uptrend is classically a bearish reversal pattern —a breakdown below the lower trendline confirms sellers are gaining control.
A Converging Reversal
Given the well‑known inverse correlation between the dollar and most assets, it’s noteworthy that both asset classes are flashing signs of a reversal. Taken together that makes a compelling argument.
