SPY trade ideas

DID THE S&P 500 BOTTOM? MASSIVE STOCK MARKET RALLY INCOMING????Our indicator just printed a super rare signal on the weekly chart, let's discuss what this means for the future of the stock market and why this may be one of the best buying opportunities for the long term.
Because historically, this indicator prints green when it's been the best time to buy to prepare for the next 5-10 years of bullish price action

Earnings Which Way Do We Go Pure TAStaying long took some off
see what earnings bring warning we can drop and continue lower to 460
Weekly stoch tuning up BUT has not broken the red line bottom up through 30%
no VOL

SPY/QQQ Plan Your Trade Overview For 4-12 : Thank youThis video is mostly a big thank you for all the great comments and questions over the past few weeks.
I've been posting these videos on TradingView for almost a year and the types of viewers/followers I've been gaining is incredible.
You guys & gals have really impressed me with your questions and engagement. Many of you follow me for months without ever commenting or asking any questions.
I received a call from a client/follower in Alberta last night and he reported last week's gains at over 300% by following my videos.
I received a message from another TV follower saying he's been following my videos for many months and, after a bad loss a few years back, he has decided to give trading another go.
I've stated it before and I'll keep saying it.. I'm not trying to scam you out of anything. I'm trying to show you the RIGHT SKILLS and TECHNIQUES for you to learn to become a better, more skilled trader.
The way I look at it is like this...
If I can teach you half of what I know and see on the charts, then you guys will be able to achieve so much greater success and have gained/retained the knowledge to do it on your own.
You watch me do it over and over on these charts. Guess what - you are LEARNING at the same time.
Now, after a couple of years of doing this and following my videos, you've GAINED an education on how to trade more efficiently, manage risk more efficiently, and achieve your trading goals (I hope).
Right now, I'm getting messages/comments from people saying they are making 200%, 300%, 500%, or more every week or two from my videos.
That is absolutely incredible. I just want to urge you to remember I'm not 100% perfect in predicting the markets. No one EVER really is 100% perfect at it.
In the long run, as long as you don't get super greedy, you'll survive any minor losses and live to trade another day.
That is probably the most important thing I can teach you - trade within a proper scale to your RISK LEVEL. Never BET THE FARM on your trades. Always have a 50% to 70% cash reserve.
Anyway. Thank you. I really appreciate all of you.
Hope you enjoy this video.
#trading #research #investing #tradingalgos #tradingsignals #cycles #fibonacci #elliotwave #modelingsystems #stocks #bitcoin #btcusd #cryptos #spy #gold #nq #investing #trading #spytrading #spymarket #tradingmarket #stockmarket #silver

SPY - RISK OF BEAR MARKET VERY REALTrumps tariffs is going to be the catalyst for a bear market that the US needs to have. I'm expecting a 30% - 40% drop at most but don't worry, it will be a good time to buy when the dust settles.
The RSI is painting bearish divergence on monthly. Big sign of drop.
The MACD is curving downwards. Also a big sign that we'll be dropping soon.
Bear cycles typically last only 1 year. But its alright, I'll be there to buy spy when its cheap because I have confidence in the US to produce cool new things and figure out new innovations.
Also intrest rates will drop, money printer go BRRR and dumb money flows back into the space.

SPY Trade Review – Potential Pop and Flop SetupI’m tracking a potential pop and flop scenario forming on SPY. There’s a setup for a possible 5.5% move higher, followed by the opportunity for a larger short of up to 15% toward final downside targets.
SPY and its key influencers, including the Magnificent Seven , are currently rebounding off significant support levels. This could allow for continued upside before running into major resistance.
As highlighted in the chart, we may see a further push higher of approximately 5.5% , taking us into the weekly/daily high support lost zone at $564 . If this level acts as firm resistance and price reverses, a break below $549.83 (our trigger for adding short exposure) could lead to a significant selloff.
Downside targets include:
- Target 1: $502
- Target 2: $476.30 (a potential new local low)
A daily or weekly close above $564.52 would invalidate this short setup.
This is a high time frame setup , but I’ve shown it on the 4-hour chart for greater clarity. Now we wait and see!

I SPY and link with US Debt..do you Waldo?Its not hard to find correlations in life...but this seems a little blatant. So I thought I would show that only one debt shelf ever resulted in no fall after it occurrs...an interesting finding...
But just think of this logic...If the bonds are rising in a solid manner to the toon of even the 3 month going from 2022 levels of .002% to now some 4.2% or so....why does anyone think that things can keep going up when you fund everything but what you need in the country.
Lets give you guys some homework:
how much debt was spent on new highway improvements on bridges and tunnels(i see you lincoln), expressways etc.
how much debt was used to build major power generation in Cali and NY so their brown outs aren't so bad....to which I say, those two states should just suck it up and allow more data centers so silly cat pics or anime can be generated on GPUs eh??
how much debt was actually spent on the poor condition of sports complexes or school infrastructure so to give children the ability to play...so that the NFL doesn't have to try for like 3 month to encourage play-60....only an hour of play folks...yeah, that'll keep the Coke sugars well balanced eh?
Finally how much debt was spent towards improving the very secondary and neglicted hard educations...or what some call vo-tech, which you need to repair/build these mass construction projects and splice cables over 200 feet in the air on mountainsides involving high tension wires after hurricanes like Helene barrel through places.
Yeah..well its about as much as the fellow "make this place great again" person has contributed their time and a bit of their NVDA or PLTR proceeds to a local community center or to a local youth developmental program for kids in rough neighborhoods....oh wait...that's for the government to do, so they can blame government for over spending on...the things above???
As two members of royalty I attended school with, both from active kings who sent a princess and prince to two of my schools said, "When they realize there are more of them then US, you begin to see a shift in attitude which makes US accountable. But when they think the few of US are more powerful then all of them combined you can see how your people believe in shadow governments or Illuminati( another name for "Deep State" back in that era..hmm where did that go eh??). Cause the whole government is made up of neighbors and the military is made up of college friends or past coworkers- but only simpletons think a title or a uniform/suit makes everything change- it doesn't".
another idea later tonight and linked in the comments after posting will show the 10 year yield and its relation to following crashes

2nd post of I SPY no reason for Bond shock as rates riseWhy is everyone shocked about rates rising as the market moves down...its seems to fit the logic as stated and is the Newtonian force-action see-saw:
You buy bonds and the interest rate goes down....you sell them and or don't purchase and they must go up in yield.
How has that been broken with the chart I have shown. Well it's due to outside structures forcing a "paper trade" kind of, technical analysis wishy washy, excuse of why things are not moving as they should.
Well, you didn't want to face the music after 2003 so the printer ripped right into the bank pockets, "protecting inflation from the little man". Well that caused 2008, which needed even more bank help even though they got a bunch since 2003 (see previous post and the debt rocketing after 2008)
So now you need to slam more debt, circa 2008, and the bonds are being bought cause the market basically went nowhere for another 6 or 7 years.....But then there was a change to how things were run....a loosening per say:
Now the banks can play in the stock market once the downturn of 16 started and the Entertainer was brought in to keep people pacified as things were turning down( almost like now, eh?). You see the magic rainbow that occurred from '15 to '16, well that was a last ditch effort to save the banks coughing up blood from terrible investments. So as I said, the Entertainer was brought in to pacify everyone to allow for the cutting of rates and "Dow to the Moon"...(kinda reminds you of "bitcoin to the moon" now, no?) and that worked until 2018...one more cut and print jober while stacking the market was attempted but now the foreign banks were going down and China refused to help the US after its initial injection in 2008.
So, rates are slashed, you crash in 19 and you need something to kind of start to take people's attention off how everything is going down around them(kinda like now with tariffs or fentenyl crap, eh?)....maybe to target that big nation who refused any more bond help or financial backing...like China maybe. Hence the cough was rolled out to allow emergency powers acts to engage and the secrecy of money moving was shrouded from eyes under said act...kinda like in 2001...huh, wonder if related somehow.
Well this was supposed to cripple foreign entities, especially Russia, since the US was already arming Ukraine under the Entertainer who no one cared to see what he signed off on, both his planeloads of money and weapons to the Z-man...then that Shoulder sticker which conveniently everyone has forgotten he solely pushed and claimed "beautiful responsibility for"---didn't that ruin career and cost lives...hmm, 2001 connection again, who knows, but you know.
So why does this explain the bonds turning around...it's due to the countries of the East seeing the coordinated NATO response to said cough and the banking sectors getting mass injections of cash to try and undo liabilities that went bad. However, this caused them to turn that cash into working capital by pumping stocks and signing mass M&A deals and all from all the companies going under or being crippled from the cough...again, damn near as convenient as those passports being fireproof, lucky be a lady.
So now you engage in the bonds climbing with the market cause there is no money in bonds yielding like 1 or less percent...but when you have unemployment money, crypto money, and payment protection plan money screaming into the market...you stop it all for midterm elections and then the crash of '22 in fall occurs.
But hold on to your laces buddy, Pelosi Put is to the rescue with a Chips act which fuels all the "AI" to suddenly become a thing apparently, even though its been in every video game since like 2008-9 and was basically the Alexa and Siri,....so way to fall for that one people. Well that caused dollar stocks to rip into 100, 200, even a 3000 dollar Mexican grille stock... burritos with a 800-900 PE ratio...good analysis there guys.
So the bonds feel neglected and have to hike up their skirt a little more to get attention, to which Russia catches a sniff and asked the US to hold its Beer while the Bear goes to town on their Proxy they were arming since the Entertained was slipped in, in 2016. So The Bear gets sanctioned to "hell and back" while having foreign accounts and treasuries either seized or frozen (hey, where did the 'seize not freeze' story go..hmm). So now no foreigner can trust holding US based assets and the purge begins which really moves the bonds in a fast hurry.
Finally, you have the genius idea to slap the Dragon's ass while he is busy making your stuff that you agree to teach him how to make and then build for you- well everyone saw that public pissing match and reveled XI has the ability to be a sundial if its a clear day out, and he delivered the worst pain shot right back..."Sup Bra', did you say something- we forgot we even do business with you again"
So now you have a country with a population that can buy the hell out of anything, not buying anything due to being a culture of savers(unlike the credit card addicts of the US) suddenly being encouraged to improve their lives and become a tiny bit American and have like heated slippers and maybe a water sprinkler for their dog. So if you think that Uncle Sam is the back breaker of the dear 'ol Dragon...you may need to visit your nearest supply house and see what is on the barcode sticker; if it says USA, see where its base metals, resins, and catalyst chemicals are from...then ask who needs who.
Basically....you slashed rates rather than having like 4 recessions as of now...kinda like the Ozempic people who can't go back in their photo gallery and pinpoint the year they just suddenly were dangerously overweight...nope, just woke up to it...couldn't do a more meat heavy, low insulin driving meal..."gots to keep Frito Lays and the boys at Kraft/Nabisco employed". Well you skipped 4 recessions and you froze foreign assets for no reason and then you decided to let banks play with free money to prop the stock market up- *see JPM has ass earning outside of trading desk...PS MBS and Commercial Real Estate is dead :)
>>So that's why bond yields go up and they need the fed to cut...but it seems since 2022 the 3 month bond went from 0.002% to 4.3 or so as of today....good one fellas, practically within 2 years and you scream higher causing all this debt to roll over at higher rates, like aforementioned Commercial Real Estate having to refinance every 5, 8, or 11 years per many contracts...well 5 years ago a 3 month would be cheap...even a 7 or 10 year at about a percent or less ...but not now...some of my buddies are saying 8% is a dream and 15% is becoming a nightmare in that space...but hey, be like a fat American...make everyone do stuff for you and then wonder why you are on Ozempic and now have intestinal peristalsis problems and feel like SH1t all the time :)

$SPY ONCE IN A LIFETIME Nailed it at 500! Nailed it at 500! Gave yall this MEASURED MOVE LIVE STEP BY STEP Bear Leg Completion
I will be looking to ADD TO WINNERS NEXT WEEK
Drop a "❤️" and I will update you DAILY step by step

We just entered a bull cycleEvery time we went within the support lines of my indicator it marked the bottom
Every time in the last 11 years

Completing the B waveToday looks like it is a completion of a B wave, so I expect C down into Monday and Tuesday. I'm looking for some selling into the end of the day.

04/07 GEX + Historic VIX Highs: Extreme Volatility with OptionsWow, where to begin? We’ve just come through a week that even the most thorough analysts found surprising.
Last Friday’s brutal sell-off triggered such a massive margin call rally that even the hedge funds were forced to exit gold—which is usually considered a safe haven—on Friday.
The VIX is at a historic high — no joke. We last saw levels like this during the 2008 crisis and the COVID panic in 2020.
📌 High IV = High Theta
When implied volatility (IV) is high, theta (the time decay of options) is also high. This means that maintaining long put protection becomes extremely expensive. From a broker’s hedging perspective, if they are short expensive put options, they can gradually buy back their futures positions over time (all else being equal). As IV rises, this buyback becomes increasingly attractive for them.
Let’s look at our weekly SPY analysis using GEX Profile (Gamma Exposure) indicator first:
It’s definitely not a cheerful chart!
* Below 520: We have strikes dominated by puts. The largest negative GEX “profit-taking zone” sits at 490. If price reaches that level and the support fails (the previous major bottom from April 2024), we could move even further down into a very wide negative squeeze zone, possibly as far as 445.
* HVL zone: 520–546: A choppy area around the gamma flip.
* Above 546: This would signal a +10-15% rally, putting us in a positive gamma zone. However, such a scenario currently seems unlikely—at least based on the gamma levels we see right now.
I won’t sugarcoat it: we’re at levels now where the market could easily move 10% in either direction. So, in my view, forget about conservative option strategies with flat delta exposure.
🤔 What Can We Do?
Important: This analysis reflects my personal opinion only. It’s primarily for those looking to speculate in this highly uncertain environment. If you’re holding put options strictly as a hedge, then this may not be directly relevant to you. In these conditions, the number one rule is to survive—hedges are meant to protect assets or guard against margin calls, not to make profit.
Currently, IV (implied volatility) and VIX are at historic highs. For them to stay this elevated, we’d need new negative headlines and further major market drops. While that could certainly happen, statistically it becomes less and less likely as time goes on.
Buying Put Options …. no way?
First off, there are plenty of challenges if you plan to buy put options right now—most of all their cost. Put options are nearly twice as expensive as calls in many cases.
Does this mean I recommend selling puts or put spreads? I’m not saying you shouldn’t, but be aware: this isn’t for the faint-hearted or for beginners (the risk is high!). It might be worth exploring butterfly or vertical debit spread strategies, as our goal remains the same as always: to maximize the risk–reward ratio.
🐂 If You’re Bullish
This might sound like a ninja move, but one possibility is to buy call butterfly spreads. Yes, the market could still drop—that’s absolutely possible. But statistically, it’s becoming less likely that we’ll see another huge leg down without some form of rebound.
- Slight Move Up: In the event of a mild rise, call spreads and call butterfly strategies can significantly outperform a simple long call. The short legs in a spread/fly offset high theta costs and mitigate the negative effects of falling IV.
- Even with a +10% Move: A long call is often still not the best choice in this environment—even if the option goes deep in the money.
Where Call Spread/Butterfly Can Fail
If stocks rally 15–20% or more and IV also increases (which would be unprecedented in just a few days).
If the market crashes and VIX spikes above 100 (IV would skyrocket, raising the cost of all options further).
Cheap Bullish Calendar Spread
In a situation like this, even a cheap calendar spread can be a good play — the risk is relatively low, especially if managed well and the breakeven range is wide. Of course, if implied volatility drops, the spread could narrow, but that would likely come with a market rally, which theta can help capitalize on.
🐻 If You’re Bearish
I strongly advise against buying single-leg puts, even on a 0DTE (zero-days-to-expiration) basis. If you’re convinced the market will keep dropping, I’d only consider debit spreads, aiming for a solid risk–reward ratio (in my case, I look for at least 1:2 risk-to-reward).
⚖️ If You Want to Stay Neutral / Omni bullish
If you prefer not to pick a direction, you could try to capitalize on historically high IV with a May-expiration Iron Condor. This is the classic TastyTrade approach, with the caveat that you must monitor GEX levels and IV daily and adjust the far side as needed.
Risk Management: If the spot price threatens one of your short strikes, you probably shouldn’t wait around in this volatile environment. It’s usually better to close the position and take a small loss than to hope for a reversal—hoping can become very expensive!
Conclusion
The market is extremely volatile, and expensive options mean traditional strategies may not work as well as they usually do. Stay cautious, manage risk meticulously, and don’t be afraid to close out losing trades quickly. As always, surviving to trade another day is the most important rule.

$SPYStill in the downward megaphone, but short term is riding the ascending trend.
Lets see how it plays out.

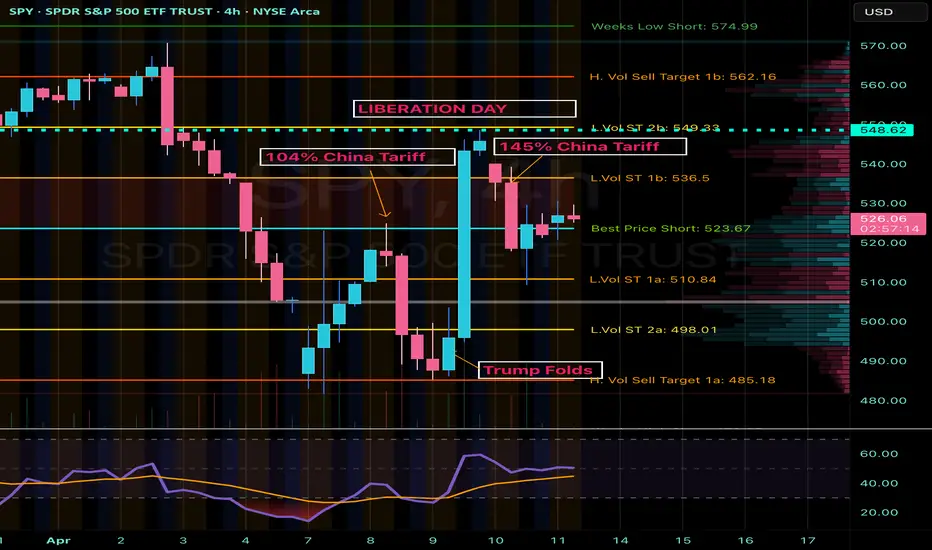
SPY Analysis: Navigating Tariff-Induced VolatilityContinuing from my last update, market volatility remains high due to Trump's unpredictable policy decisions. After initially folding and offering economic relief, Trump pivoted sharply with a sudden 145% tariff announcement. Today, China countered strongly with a 125% tariff. These escalating tariff exchanges continue to create significant uncertainty and market fluctuations, highlighting the critical need for careful analysis and precise trade management.
Technical Breakdown (4-Hour Chart)
Current Price Zone: Around $528.45
Key Resistance Levels:
- Immediate Resistance: $536.50 (L.Vol ST 1b)
- Critical Resistance: $549.33 - $549.60 (L.Vol ST 2b)
- Major Resistance Zone (Liberation Day): Approximately $562.16
Support Levels:
- Initial Support: $523.67 (Best Price Short)
- Secondary Support: $510.84 (L.Vol ST 1a)
- Important Lower Support: $498.01 (L.Vol ST 2a)
- Strong Support Level (Trump Folded area): ~$485.18
Trading Scenarios
Bullish Scenario (Potential Tariff Tension Relief):
- Entry Trigger: Confirmed breakout and sustained hold above resistance at $536.50.
Profit Targets:
- Target 1: $549.33 (next strong resistance level)
- Target 2: $562.16 (major resistance)
- Stop Loss: Below immediate support at $523.67, carefully managing downside risk.
Bearish Scenario (Ongoing Tariff Escalation or Increased Market Fear):
Entry Trigger: Inability to reclaim $536.50, or a decisive breakdown below support at $523.67.
Profit Targets:
- Target 1: $510.84 (nearest significant support)
- Target 2: $498.01 (secondary critical support)
- Target 3: $485.18 (robust support area)
- Stop Loss: Above resistance at $536.50 to protect against potential reversals.
Thought Process & Final Thoughts
The SPY currently trades within clearly defined resistance and support bands, heavily influenced by unpredictable tariff-driven headlines. Trump's volatile policy shifts and China's assertive retaliations amplify short-term market risks. Maintain flexible trading strategies, adhere strictly to established levels, and practice disciplined risk management. Continuous monitoring and swift response to evolving market sentiment will be essential for navigating this challenging environment effectively.
"Disbelief Rally" back to 52 week HighsPrior plunges below this custom weekly Keltner channel have a good track record of highlighting buying opportunities. In simile terms.. when markets plunge too much and too fast, a great accumulation occurs with wild oscillations. After the accumulation will come a "disbelief rally" where the market will continue to rip higher in a concave down curve to the previous 52 week high leaving market participants in disbelief that we didn't retest the plunge levels again. Each dip in this "disbelief rally" becomes a great opportunity for long-style trades.


SPY retest of macro Golden PocketBeautiful retest of Golden Pocket SPY. Last time was August 5th 2024 Yen Carry Trade test.

$SPY ONCE IN A LIFETIMEMeasured MOVE target is 485-500
Gave yall this OUTSIDE BAR Short last week I DID NOT THINK it would DROP SO FAST
I will be looking to LOAD HEAVY on the completion of the BEAR LEG!
Drop a "❤️" and I will update you DAILY step by step and do videos!

What on Earth Is a Circuit Breaker?!Every couple of days since April 2nd, everybody's been talking about a stock market halt all day. You're left there trying to Google it so you're not the only person in the group chat who doesn't know what's going on. But actually, nobody else in your group chat knows what's going on either. They're low-key Googling it under the desk. You don't have to know everything in the market to be a "seasoned" trader. What does get disappointing is when people guess instead of providing facts or a direct link to an article about market halts.
So, this is your quick-but-detailed-read article/ guide to market halts and circuit breakers. Send it to your friends in that group chat. Why today's dump happened in the first place? More on that later. It's a long story. 🥹
What is a circuit breaker?
It's simple: a circuit breaker is a 15 minute OR whole-day market-wide HALT when the market reaches 1 of 3 decline levels. It all depends on the level, how fast the decline is, and potentially other factors that we are not aware of. Keep in mind this is not something we have to deal with often.
When does it happen? And what stock does it track?
Good question. The halt is triggered following declines in the S&P 500 only . That is: AMEX:SPY SP:SPX $CME_MINI:ES1!.
If these level 1 & 2 are reached before 3:25 PM EDT , there is a 15 minute market-wide trading halt. Meaning you cannot enter or exit positions. If level 3 is reached at any time in the day, the entire day's trading will come to an end.
Level 1: -7.00% | 15 minute halt
Level 2: -13.00% | 15 minute halt
Level 3: -20.00% | Entire day halt
So when the S&P 500 index reaches -6.98%, be sure a halt is coming very soon at -7.00%. Sure, like today, "they" might pump it and use that as support and prevent a halt (we got very close to -6.35% on CME_MINI:ES1! if I'm not mistaken). But it's good to be vigilant and make sure you're not in any daytrades.
Does CME_MINI:NQ1! NASDAQ:QQQ CBOT_MINI:YM1! trigger the halt also?
No. The halt is only triggered by the S&P 500. The Nasdaq Composite famously moves much more than S&P 500, so a 7% drop in S&P is way more dramatic than a 7% drop in Nasdaq and it's highly likely at -7% in S&P that Nasdaq would be at -8% or -9%. Although, both are undoubtedly decimating for any long positions.
Why does this rule exist?
This was introduced after Black Monday of 1987 where the market was free falling ( DJ:DJI dropped 22.6%) with no safety stops in place to prevent a market-wide disaster. This prevents further panic selling and massive stop loss raids, and also gives institutional traders time to zoom out and see the bigger picture.
How close did we get recently?
Today we got within 0.7% of getting a 15 minute halt.
See for yourself:
And the intraday 15 minute chart:
FUN FACT: What if I shorted the top on CME_MINI:ES1! ?
Assuming your time machine goes back 24 hours (some time machines only go back 10 years minimum), you'd have booked 1500 ticks at $12.50 per tick. So around $19k per contract. You know that's not too bad. It's almost a Toyota Camry per contract. Do better! 😆
How do I trade this?
Do you really have to? Please do not FOMO & catch a falling knife. Trade light. The market is open for the rest of the year. Trade with a stop loss, and remember, if you FOMO'd and bought at -3% just because it's down 3%, you'd have gotten decimated. Use the charts not the % on your screen. 🔥
Hit the follow button for free educational content because knowledge is free. KD out.

Self-Sacrifice That Seems Like Self-Destruction… But Toward What🔻 SPY down 21% | IWM down 29% from ATHs as of April 7, 2025.
After months of tracking the Trump tariff narrative and comparing it with the 2018–2019 playbook, we're now living the sequel. But this time, it's happening on steroids, faster and with more chaos.
🧠 Context: Why This Isn’t Just Another Correction
It’s not purely about macroeconomic numbers or earnings calls anymore. The market's volatility is now emotionally and politically driven — centered around one dominant voice:
Donald Trump.
He’s not just reacting to the market — he’s orchestrating the market. And every tweet or announcement can change the direction of the S&P in real time.
🔁 2018–2019 vs. 2025: Chart Overlay Insights
📉 In 2018, the first round of tariffs triggered a -20% drop in SPY — followed by a powerful reversal.
📉 In 2025, the same pattern repeats — another ~-21% drop from highs.
SPY printed a nearly identical two-bottom structure
This sharpens my conviction that we may have already bottomed — barring another external macro event outside the tariff story.
🧩 The Tweet Timeline
Initial Setup Tweet:
"THIS IS A GREAT TIME TO BUY!!! DJT"
A tweet that initially seemed random, but now clearly was a setup.
The Main Policy Drop:
On the same day, hours later, Trump officially dropped the real bomb: a massive 125% tariff hike on China, coupled with a 90-day relief for all other nations.
📈 The market exploded: SPY ended the day +10.5% — one of the biggest intraday reversals in recent history.
Fake Tweet Incident:
Just a few days prior, a fake “90-day pause” tweet circulated, reportedly backed by a journalist referencing a major bank. It turned out to be false — but it caused a sharp 20-minute rally, followed by a dump when it was denied.
🪙 That wasn’t the “Golden Tweet.” But it was what I call a Silver Tweet — a smaller catalyst that injected brief optimism.
👉 Silver Tweets bring air back into a suffocating market. But the real bounce… needs a Golden Tweet.
🧨 And Then the Wildcard:
Despite the massive selloff, the 10-year yield went up, not down — likely the result of a powerful player dumping bonds to counter Trump’s objective of yield suppression.
But that’s not the only possible force at play:
Hedge funds are now facing margin calls.
This has triggered forced liquidations across equities, bonds, and even certain safe-haven positions.
That’s why we’re seeing the unusual combination of rising yields and rising gold — while broader equity markets were still heading aggressively lower.
This suggests:
A hidden battle of titans
Broad rebalancing under pressure
And that Trump may no longer be fully in control of the chaos he set in motion.
🔭 Trade Zones
📌 IWM
Entry: $179–185
Short-Term Target: $195–205
Mid-Term Target Target: $270–280 (or Retest ATH)
Max Downside Estimate: -5 to -7%
Stop-Loss: Weekly close below $171
📌 SPY
Current Level: $517.99
Short-Term Target: $548–556
Mid-Term Target: Retest ATH ($612+)
Max Further Downside Estimate: -3 to -5% from low
Stop-Loss: Weekly close below $485
📌 Note: Volume on reversal was highest since Covid crash, signaling serious accumulation.
📉 What This Could Mean
Trump’s pressure campaign is likely aimed at forcing the Fed to cut rates.
The 90-day pause was meant to cool global reaction — while keeping pressure on China.
However, if yields keep rising and inflation picks back up, the Fed might get stuck, causing even more market instability.
This isn't just a tariff tantrum — it's a chess match with real capital on the line.
🔮 Final Word
We're in the middle of the unraveling, and the market is still testing the gains made during the relief rally. But I’m more confident than ever in my thesis — unless another macro shock comes into play.
📉 We now have:
2 matching 20%+ drops (2018 + 2025)
Matching double bottoms
Trump-driven catalysts unfolding
📲 The markets will react more to Trump's feed than to Powell’s tone or CPI reports.
That said, this isn't a guarantee. If Trump loses control of this chaos, or geopolitical escalation spills over — the downside isn't out of the question.
The only certainty right now: The market is watching one man.
#TrumpIndex #SPY #IWM #MacroNarrative #GoldenTweet #SilverTweet #MarketCycle #Fibonacci #Tariffs #TradingViewIdeas

SPY PRICE ACTION 10TH APRIL2025Spy further price action is here. I have discussed all the potential buying levels and do not go long at current price as we are into a supply zone.
Feel free to leave a comment
NOTE:WAIT AS WE ARE INTO A SUPPLY

SPY/QQQ Plan Your Trade For 4-10 : FLAT-DOWN PatternToday's Flat-Down Pattern suggests the SPY/QQQ will struggle to move away from yesterday's big open-close range.
Normally, I would suggest the Flat-Down pattern will be a small, somewhat FLAT price move.
But, after yesterday's big move, the Flat-Down pattern can really be anywhere within yesterday's Daily Body range.
So, we could see very wild volatility today. That means we need to be prepared for general price consolidation (which suggests somewhat sideways price trending) and be prepared for some potential BIG price trends within that consolidation.
These BIG price trends would be more like bursts of trending, while still staying somewhat consolidated overall.
Watch today's video to learn how the Excess Phase Peak pattern is dominating the trend right now (in the Consolidation Phase).
The same thing is happening in BTCUSD. BTCUSD has been in an EPP Consolidation phase for over 35+ days now.
Gold and Silver are setting up a CRUSH pattern today. That could be a VERY BIG move higher (or downward). Given my analysis of Gold acting like a hedge (a proper hedge for global risk levels), I believe today's move will EXPLODE higher.
Gold is already in an early-stage parabolic bullish price trend. When gold explodes above $3500, I believe it will quickly gain momentum towards the $5100 level.
Right now, Gold is recovering from the Tariff news and about to explode upward (above $3200) if we see this CRUSH pattern play out well.
Thank you again for all the great compliments. I'm just trying to share my knowledge and skills with all of you before I die. There is no need to carry all of this great information and technology to my grave.
So, follow along, ask questions, learn, and PROFIT while I keep doing this.
Get some.
#trading #research #investing #tradingalgos #tradingsignals #cycles #fibonacci #elliotwave #modelingsystems #stocks #bitcoin #btcusd #cryptos #spy #gold #nq #investing #trading #spytrading #spymarket #tradingmarket #stockmarket #silver

Nightly $SPY / $SPX Scenarios for April 10, 2025🔮 🔮
🌍 Market-Moving News 🌍:
🇺🇸📈 U.S. Tariff Pause and Increased Tariffs on China: President Donald Trump announced a 90-day pause on tariffs for most trading partners but increased tariffs on Chinese imports to 125%. This move led to a surge in global stock markets, with the S&P 500 rising by 9.5% and the Dow Jones by 7.9%.
🇨🇳📈 China's Retaliatory Tariffs: In response, China imposed additional tariffs of 84% on U.S. goods, escalating trade tensions and impacting global markets.
📊 Key Data Releases 📊
📅 Thursday, April 10:
📈 Consumer Price Index (CPI) (8:30 AM ET):
Forecast: 0.1%
Previous: 0.2%
Measures the average change over time in the prices paid by consumers for goods and services, indicating inflation trends.
📉 Initial Jobless Claims (8:30 AM ET):
Forecast: 219,000
Previous: 225,000
Reports the number of individuals filing for unemployment benefits for the first time, reflecting labor market conditions.
🗣️ Fed Governor Michelle Bowman Testifies to Senate (10:00 AM ET):
Provides insights into the Federal Reserve's perspective on economic conditions and monetary policy.
⚠️ Disclaimer: This information is for educational and informational purposes only and should not be construed as financial advice. Always consult a licensed financial advisor before making investment decisions.
📌 #trading #stockmarket #economy #news #trendtao #charting #technicalanalysis
