Rollercoaster Continues For SPYMy overall thesis is we are in the very early stages of a multi-year decline ultimately with the S&P 500 below 3500. I am estimating this symbol to be in wave position SuperCycle 2, Cycle A, Primary 1, Intermediate 3 (pink), Minor 3 (yellow), Minute 3 or 4 (green). I originally had this symbol nearly complete with Primary wave 1, but the continued declines received significant wave 3 of 3 signals (pink lines in bottom chart band). It is still unclear if we are in my theoretical larger decline or if we are in a simple corrective wave. It will take at least another two months to likely achieve the answer.
Theory 1 is my hypothesis where we are about to finish Minor wave 3 in Intermediate wave 3 in Primary wave 1 in a multi-year market correction. This would see SPY bottom around 486 within two weeks and briefly head up toward 535 before continuing significant downward movement. Currently Intermediate wave 1 lasted 111 trading hours. Intermediate wave 3 is somewhat on pace to finish in the same amount of time around 17 April. Extensions based on Minor wave 1's movement could put Minor wave 3's bottom around 499.
Theory 2 is that Intermediate waves 1, 2 and 3 (pink) are actually waves A, B, and C (white) in a short-term corrective wave. This would mean this symbol returns to all-time highs around the fall of 2025.
Theory 3 places the stock in the third wave about to finish a wave A down over the next two months. Wave B up would last a few months before wave C takes the market to a bottom sometime around the end of 2025.
All three theories will observe the same movement over the next few weeks with a low soon and then a bounce up. Theory 2 becomes the likely winner if SPY breaks above 576.33 within the next 3 months. Theories 1 and 3 will trade the same for quite some time.
I will reevaluate this ETF once Minor wave 3 finishes. It should aid in providing a better bottom for Intermediate wave 3 in the next two weeks.
SPY trade ideas

Market Falls comparison of the last 25 yearsBetween 2000-2019 the market had 7 big falls.
Since the Pandemic in 2020, the market has fallen 2 times and currently experiencing the 3rd big fall.
Although the current and last two falls seem big, percentwise have not been as big as the ones from 2000 and 2008.
Get ready for the current market to continue falling for the next 2-3 months and it will still only feel like a 20% correction, nowhere as big as the 3 biggest falls from the last 25 years.

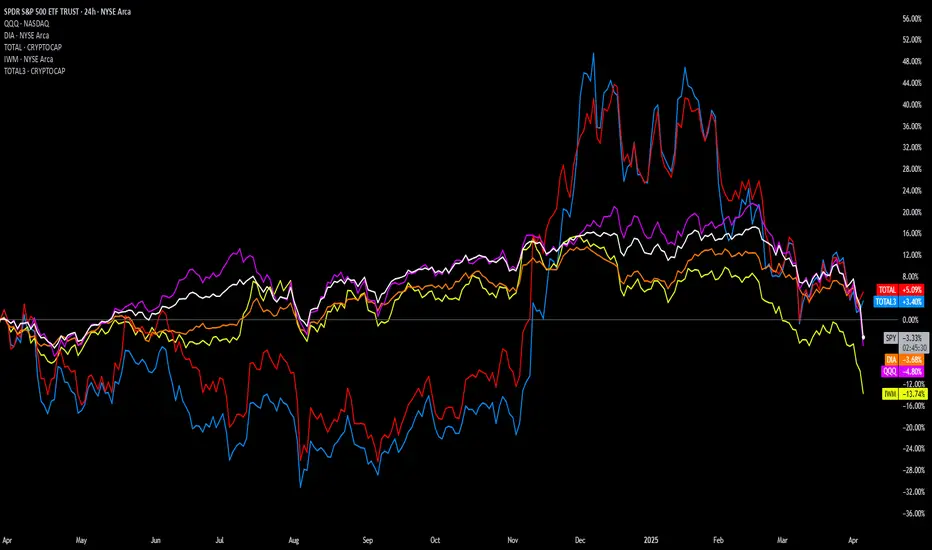
US stock market vs CryptoUS stock market vs Crypto
Here's a YOY comparison chart of the US stock market vs Crypto. While all US stock market indices are down year over year, crypto is still up. Is crypto a better investment, or is this a temporary snapshot in time? Please drop a line and let me know your opinion.
SPY -3.3%
QQQ -4.88%
DIA -3.68%
IWM -13.8%
TOTAL +4.93%
TOTAL3 +3.24%
Tariff FUD is reking ports. SPY 505 First Stop. 460 Second.Trading Fam,
It's no surprise that Trump's implementation of high tariffs would cause initial FUD. This can be observed in the massive spikes on the $VIX. What is unknown and has caught many traders by surprise, myself included, is how substantial of a drop would be incurred by investor uncertainty.
Initially, it did appear that 500 might hold. That was a huge support. I knew if it broke, the sell-off would be deep. But I held hope that the market would hold above this trendline. It did not. So, yesterday and today, investors who held are incurring substantial losses.
For those who were smarter than me and sold at or near the top, congratulations! You've saved yourself some duress and cash. Now, some are calling this the beginning of a longer bear market. I still don't see it that way. Honestly (and I know this will be hard to believe), I still see the SPY hitting my target #3 at 670-700 before 2026 comes to an end. Longer-term we still remain in a massive secular bull market since 2009 and to break this long-term trend, the SPY would actually have to break below 300. That is a long way down and I just don't see that happening, though as always, I definitely could be wrong.
Shorter-term I am seeing two prominent areas of support. The first has almost been reached at 505. If I would have played this correctly, I'd be DCA'ing in my first load of cash here. The second area of support is at around 460 and slightly rising daily. This would be where I DCA'ed in another load of cash. However, if that broke, I'd exit immediately and reassess the charts. 300 is a long way down, but over the past 5 years we have seen some extraordinary market price action and volatility. TBH, even the best of us technicians are struggling to understand the larger macro-economic picture, but I'd wager to say that tariff fears may be overexaggerated as market reactions often tend to be.
One interesting note is that crypto price action no longer seems to correlate and prices have help up surprisingly well. Could this be our first indicator that the markets are due to turn up again in a few weeks/months? Unknown. But I can promise you I'll be watching this all closely.
✌️Stew

SPY April weekly forecasts - New stuff-This is an idea I've done in the past, but never posted on here. Sometimes it's pretty close to how things play out with variances on timing. Regardless, I want to see it as a journal entry for my dowsing work with all my notes with the chart.
It may be interesting to other people as well, so I'm posting it.
Dates are often reversals. I do think next Tuesday could be a bounce.
I'd like to get monthly highs/lows on SPY/QQQ, but that doesn't seem to be in the cards atm. :(

Big Break Could Come SPY has bounced off the 1.61 and is inside a possible 1.26 rejection.
Clean breaks of a 1.61 like this tend towards big fast drops to the next fibs.
Often this zone will then hold a retest. Big area for SPY. If this isn't support, bad things are likely.

$SPY Intraday patterns in oversold conditions This video shows common chart patterns play out in real time. This is bullish descending wedge pattern that played out beautifully--also highlighting how oversold conditions can fuel bullish pivots.
Thanks for viewing, boosting, and following!

SPY: Key Support Zones in FocusIf SPY drops to 490, that's nearly a 20% decline from its 611.39 peak. The 490–500 zone may stabilize recent volatility, but if it breaks, watch 470 — a key support and 20% below last year’s close.

Don’t trade momentum rev strat is a reversal
2-1-2 bearish/bullish is a reversal
2-1-2 continuation is not a reversal it’s momentum

SPY is close to a bottom? More Downside ahead? (April 3, 2025)In this video, AMEX:SPY is showing early signs of being oversold on the weekly chart, but the pullback may not be over for another 150 days. So Let's talk about it and see what to expect next for SPY going forward!!

SPY: Breakdown with Strong Momentum – Key Targets Ahead
📉 Overview:
The S&P 500 ETF (SPY) has broken through a key support level with strong downward momentum. This bearish move suggests further downside potential, with key targets identified below.
🔍 Technical Analysis:
Price has decisively broken below a key support zone with strong momentum, indicating a potential continuation to the downside.
1st Target: Around $537.75, which aligns with the yearly mid-level support.
2nd Target: Around $510.27, which coincides with the 6-month low level.
Momentum indicators (Neon Momentum Waves) are trending downward, supporting bearish sentiment.
Long-Term Support: The yearly low at $466.43 remains a major downside level to watch if bearish pressure intensifies.
🚨 Trading Plan:
📌 Bearish Bias – Look for potential short entries on pullbacks towards the broken support level, now acting as resistance.
📌 Stop Loss: Consider placing stops above the breakdown level (~$560) to mitigate risk.
📌 Profit Targets:
First target: $537.75
Second target: $510.27
📊 Risk Management:
Keep an eye on volume and momentum indicators to confirm the bearish move.
If price reclaims the broken support level, reconsider the short thesis.
📢 Conclusion:
SPY is showing strong bearish momentum after breaking key support. If the trend continues, the price may reach the identified targets. Traders should monitor price action and momentum signals for confirmation.
⚠ Disclaimer: I'm not a financial expert—just sharing my thoughts based on my analysis. Always do your own research and manage risk accordingly.
Do you agree with this outlook? Let’s discuss in the comments! 🚀📉
#SPY #Trading #StockMarket #Bearish #TechnicalAnalysis #SwingTrade #Momentum #NotFinancialAdvice

$SPY: Second Bearish Wave in Motion, $537 First, $512 Next
AMEX:SPY , looking at the bear market that started in February, it looks today as if a 2nd bearish wave started. It will not be confirmed until $549 is broken, however Fib projections point to $537 as first stop, and eventually at $512 as 2nd stop.
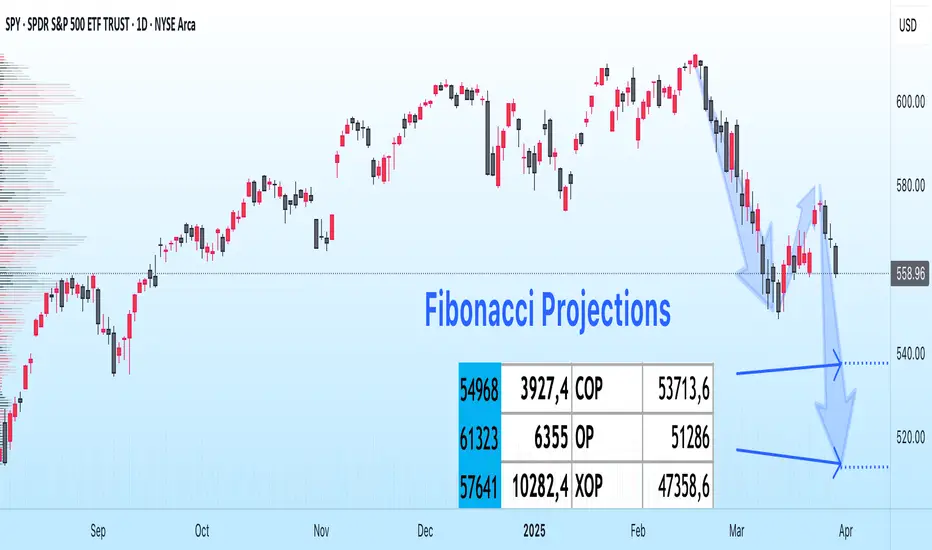
the FlushDown to 510 is possible on AMEX:SPY , there are some gaps there. We'll see. I wouldn't start buying until the VI shows either one more high or a double top.

$SPY #RisingWedge #BreakDOWN #ReTest #RecessionI highlighted the potential topping formation that could for especially if we see a rejection around 598-601 on XMas EVE via #XMasAlert.
This morning I am seeing signs of momentum wearing off PLUS what looks like a #BreakDOWN-ReTEST of a rising wedge look to the AMEX:SPY , check my TSLA to 420.69 Chart for conceptualization of this break out BELOW;
In my post 2 days ago () I mentioned Strikes TBD.
Well here are my favorites;
SPY 560P 3.21 (Bigger Risk Reward)
SPY 600P 3.21 (Essentially ATM Short w some Leverage)
-Prophecies
PS;
1) "I LOVE GOLD" - Fat BastarD
2) DONT OVER LOOK GOLD SAFETY HAVEN VIA CRYPTOCAP:BTC Headwinds?
3) And Don't Overlook NASDAQ:TSLA momentum... TO UPSIDE STILL (500Cs will be a play at somepoint this year #StayTuned)

Update for Mentorship on Trades and Key Levels $TSLA $SPY $NVDAUpdate for mentorship members on trades we've taken this week, Fib levels, support, divergence, potential tariff exemptions.

SPY/QQQ Plan Your Trade For 4-4 : Breakaway PatternToday is a very interesting day because my MRM investment model turned BEARISH on the Daily chart. That means we have broken through major support because of this tariff war and the markets are not OFFICIALLY (based on my models) into a Daily BEARISH trend (or a Daily Broad Pullback Phase).
What that means is we need to start thinking of the markets as OVERALL BEARISH and trying to identify support - or a base/bottom in the near future.
This is no longer a BULLISH market - everything seems to have flipped into a BEARISH primary trend (OFFICIALLY).
So, watch this video to understand how Fibonacci price levels will likely play out as the SPY targeting the 500-505 level (possibly lower) and where the same Fibonacci price levels will prompt the QQQ to target 395-400.
BUCKLE UP. This is a BIG CHANGE related to overall market trend.
Gold is holding up much better than Silver. But I still believe this is a PANIC selling phase in Gold/Silver and they will both base/recovery and RALLY much higher.
The funny thing about the cycles in Gold/Silver is this:
In 2007-08, just after the major expansion phase completed, the Global Financial Crisis hit - prompting a large downward price rotation in metals.
Maybe, just maybe, this forced tariff war issue is a disruption that will "speed up" the process of metals rallying above $5000++ over the next 60+ days.
I see this move as PHASES and it appears the tariff disruption may prompt a faster Phase-Shift for metals over the next few months. We'll see.
BTCUSD seems to be in SHOCK. It's really going nowhere on very low volume.
If BTCUSD is a true hedge or alternate store of value - I would think it would have an upward reaction to this selling.
We'll see how this plays out.
Get some.
#trading #research #investing #tradingalgos #tradingsignals #cycles #fibonacci #elliotwave #modelingsystems #stocks #bitcoin #btcusd #cryptos #spy #gold #nq #investing #trading #spytrading #spymarket #tradingmarket #stockmarket #silver

$540 incoming put trade expiring 4/4 or 4/11
AMEX:SPY
I start these Anchored VWAPs where the volume was the lowest before a major upside or downside.
When I entered this trade $540 expiring 4/4 was at $.5 on 3/27 on Thursday around 9.55am currently $2.06 closing week, however I want to highlight that the $540-$530 would be the major leg down and we might see the $570-$580 levels for first week of June imo.
Note: I am heavily comparing price actions for nowadays with 2022 first half drawdown.

Magnificent Value Index with Opacity CandlesThis script idea is rather old but very enlightening about the current state of the market.
It looks at the RSI or MFI values of all Mag 7 stocks, averages them out and compares it to qqq's rsi or mfi as a differential.
Real shame tradingview doesn't allow free users to participate in publishing indicators and it's a real shame the war their employees support is being lost.
Make whatever conclusions you will from this.
Good luck, we're all living in a global idiocratic world now ruled by people infected with Affluenza .

Nightly $SPY / $SPX Scenarios for April 4, 2025🔮 🔮
🌍 Market-Moving News 🌍:
🇺🇸📊 March Employment Report Release: The Bureau of Labor Statistics will release the March employment report, with forecasts predicting an addition of 140,000 nonfarm payrolls and an unemployment rate holding steady at 4.1%. This data will provide insights into the labor market's health and potential implications for Federal Reserve policy.
🇺🇸💬 Federal Reserve Chairman Powell's Address: Federal Reserve Chairman Jerome Powell is scheduled to speak at 11:25 AM ET. Investors will be closely monitoring his remarks for any indications regarding future monetary policy, especially in light of recent market volatility.
🇺🇸📈 Market Reaction to 'Liberation Day' Tariffs: Following President Donald Trump's announcement of new tariffs, dubbed "Liberation Day" tariffs, the markets experienced significant declines. The S&P 500 dropped 4.8%, and the Nasdaq Composite fell 6%, marking the worst trading day since 2020. Investors are bracing for continued volatility as the market digests the potential economic impacts of these tariffs.
📊 Key Data Releases 📊
📅 Friday, April 4:
👷♂️ Nonfarm Payrolls (8:30 AM ET):
Forecast: +140,000
Previous: +151,000
Indicates the number of jobs added or lost in the economy, excluding the farming sector.
📈 Unemployment Rate (8:30 AM ET):
Forecast: 4.1%
Previous: 4.1%
Represents the percentage of the total workforce that is unemployed and actively seeking employment.
💵 Average Hourly Earnings (8:30 AM ET):
Forecast: +0.3%
Previous: +0.3%
Measures the month-over-month change in wages, providing insight into consumer income trends.
⚠️ Disclaimer: This information is for educational and informational purposes only and should not be construed as financial advice. Always consult a licensed financial advisor before making investment decisions.
📌 #trading #stockmarket #economy #news #trendtao #charting #technicalanalysis

SPY going up to 593 by middle of AprilThe market is going to be bullish after the bearish move we just witnessed recently. Typically, I switch to the weekly format to see a larger move. You can see on the weekly chart, the Stoch RSI is turning bullish. I recently made a 3-day format which shows the indicators are already showing a bullish trend. I will post the 3 day chart/indicators as well as the weekly chart after this chart in my notes.
TARGETS:
53 point move: 599
1.618 move: 593.77
11 bar moves: April 17
**If it hits one of these targets, I am out of my trade.
** I will keep a close watch when the SPY hits 1 fib retracement at 575
** I changed my wording from 'day' to 'bar' moves
STOPS:
1) the low of the previous Heikin Ashi candlestick,
2) 2 red Heikin Ashi candlesticks,
3) a specific dollar amount for a total loss for my trade or
4) a specific dollar amount per contract.
**If it hits one of those stops, I am out of my trade.
I am using the Heikin Ashi candlesticks.
1) They show more of a directional movement within candlesticks.
2) They tend to filter out the market noise so you can see the market direction better.
3) It reduces false signals, allowing you to stay in the trade longer.
4) And, it gives you a smoother appearance making it easier to see trends and reversals. (This information is from Dr. Keith Wade who speaks at the Wealth365 Summits.)
Typically, I would wait until there are 2 green daily Heikin Ashi green candlesticks before entering.
I still tend to switch back and forth between Heikin Ashi candlesticks and regular candlesticks since regular candlesticks are what I am familiar with and have been using since I started trading.
I personally find:
* the 5 minute indicators typically represents what will happen in the next half and hour.
* the 10 minute indicators typically represents what will happen in the next hour.
* the 30 minute indicators typically represents what will happen in the daily.
* and, the hour indicators typically represents what will happen in the next week.
But right now, I am fine tuning my indicators and looking at the 20 to 25 minute indicators to precipitate a daily move
I use the MacD, the Stock RSI and the DMI to assist me with the direction of the market. Hopefully, I can explain these indicators more in the future.
Ask me any questions or point out anything you see wrong, as this is the only way we learn.
Happy Trading!


A few scenarios for the SPY! 🔉Sound on!🔉
📣Make sure to watch fullscreen!📣
Thank you as always for watching my videos. I hope that you learned something very educational! Please feel free to like, share, and comment on this post. Remember only risk what you are willing to lose. Trading is very risky but it can change your life!

Will start longs at 516I think SPY is going down to 516 (0.382 Fibonacci retracement) and could go down to 485 (0.500 Fibonacci retracement). I will start taking long positions again at 516. Back in 2022 there was a 0.500 Fibonacci retracement where SPY went from 479 to 348 but I know people have short memories.
