overview after the close quick overview after the close. I wasn't happy with the pump at the end of the day but I still lean bearish for some reasons I discuss.
SPY trade ideas

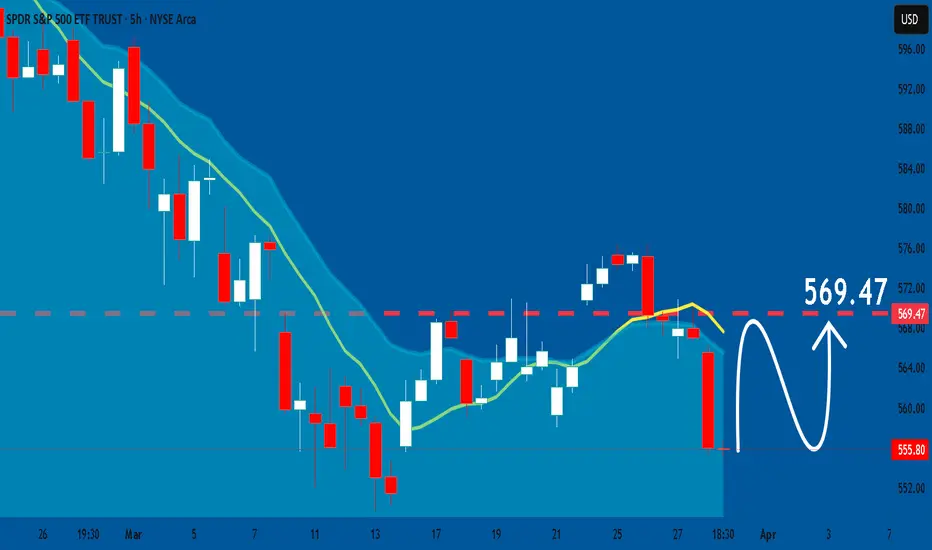
Bear flag on 1hr chartDecent size bear flag on 1hr chart. It’s looks like it setting up for tomorrow. It is currently breaking the bottom trend line and completing the pattern. If it rejects we could see it bounce one more time before the drop tomorrow. If this closes at 555-556. We could see in the next couple of days 540-545.

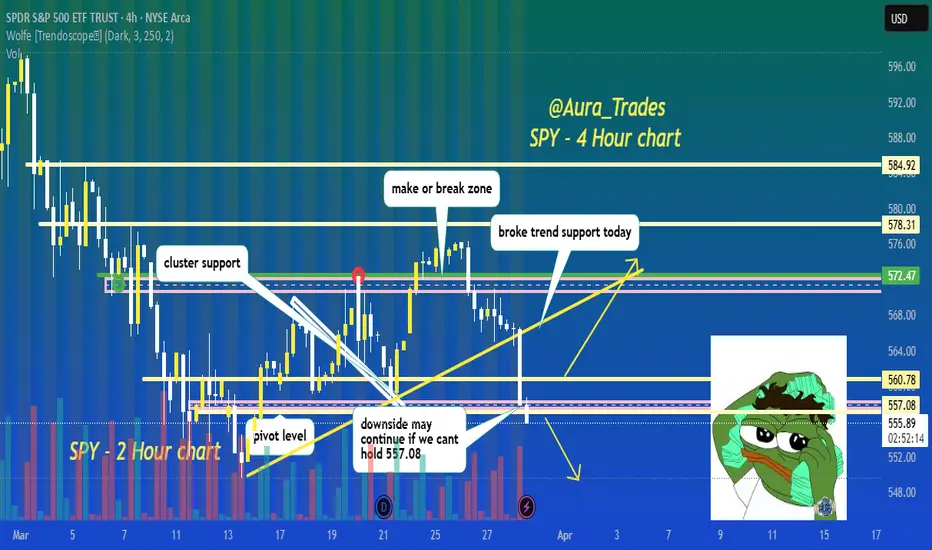
SPY is breaking support! can it reclaim?bearish break of trend support and pivot level today, if it cant reclaim 557 by close we probably see more downside next week, break above 560.78 and the bulls can start to run it back higher
boost and follow for more! 🔥
SPY at a Pivotal Zone – Bounce or Breakdown? 🧠 Market Structure + Price Action (1H)
* Trend: Downtrend confirmed. Recent Break of Structure (BOS) followed a Change of Character (CHoCH) from bulls to bears.
* Bearish momentum intensified after SPY broke support near 570.90, then plummeted through 564.85 and 558.11 key demand levels.
* Current price: 554.15 — bouncing slightly within a local demand/reaction box, but still under selling pressure.
* Price is now consolidating below structure, but inside a potential reaction zone (possible dead cat bounce or minor retracement).
🔍 Smart Money Concepts (SMC)
* CHoCH & BOS align with institutional exit behavior. The BOS confirms bearish intent.
* SPY has entered a minor demand zone, but hasn’t reclaimed any bullish market structure yet.
* If it breaks below 549.68, the next support zone opens toward the 540s.
🔁 Indicators
MACD:
* MACD is starting to curve up, with histogram showing decreasing red momentum – a potential bounce brewing.
Stoch RSI:
* Oversold condition with both lines crossing upward — supports a short-term relief rally or retracement.
🔥 GEX & Options Sentiment Analysis
* IVR: 37.8 (Moderate); IVx Avg: 22.6
* Put Positioning: Very high at 71% — bears are loaded up.
* GEX Sentiment:
* GEX is red 🔴🔴🔴 — strong gamma exposure to puts, favoring downward pressure.
* Highest negative NETGEX / PUT Support at 555.83, which is just above current price — this acts as a magnet and pivot.
* If SPY stays below this level, dealer hedging accelerates selling.
* Major Put Walls at:
* 545: GEX8 at -22%
* 544-540: Very deep bearish gamma — potential acceleration if we break lower.
* Call Resistance (Gamma Wall):
* 573 → 577 → 580 zone = Gamma ceiling.
* Dealers short calls here and hedge by selling, which adds resistance on rallies.
⚖️ Trade Scenarios
🐂 Bullish Reversal Setup:
* Trigger: Break & close above 555.83 with volume.
* Target: 558.11 → 564.85
* Invalidation: Below 549.68
* Risk/Reward: Favorable if volume confirms.
🐻 Bearish Continuation Setup:
* Trigger: Break below 549.68 with follow-through.
* Target: 545 → 540 zone (GEX & PUT walls)
* Stop-Loss: Above 555.83 or structure retest
* Confluence: GEX alignment + broken structure + dealer flow pressure.
🧭 Directional Bias:
Bearish bias still intact — but signs of short-term bounce forming. Likely we see a dead cat bounce unless 555.83 is reclaimed with conviction.
🎯 Actionable Strategy:
* Intraday scalp: Long toward 558 if price reclaims 555.83.
* Swing short: Below 549.68 toward 540 using SPY or PUT options.
⚠️ Disclaimer:
This analysis is for educational purposes only. It does not constitute financial advice. Always do your own research and manage your risk.

$SPY April 2, 2025AMEX:SPY April 2, 2025
15 Minutes
Downtrend intact as long below 200 in 15 minutes for the day.
For the fall 570.02 to 546.87 AMEX:SPY has retraced to 61.8 level around 561.
For the rise 546.87 to 560.69 holding 552-553 is important.
For the day consider the last rise from 552.73 to 560.69.
Holding 555-556 we can expect 561-563 as target for the day. It should be resisted around 564-565 being 200 averages in 15 minutes.

SPY/QQQ Plan Your Trade For 4-1-25 : Temp Bottom PatternToday's pattern suggests the SPY/QQQ will attempt to find temporary support near recent lows or a bit lower.
I'm not expecting much in terms of price trending today. I do believe the downward price trend will continue today with the SPY attempting to move down to the 548-550 level trying to find support.
The QQQ will likely attempt to move downward toward the 458-460 level trying to find the support/base/bottom level today.
Gold and Silver are in a moderate consolidation phase that I believe is transitioning through a Flag-Trend-Flag-Trend-Flag-Trend type of phase. Ultimately, the trend will continue to push higher through this phase as metals have moved into the broad Expansion phase. This phase should see gold attempt to move above $4500+ before the end of May/June 2025.
BTCUSD is rolling within the 0.382 to 0.618 Fibonacci price levels related to the last price swing. I see this middle Fib level and the "battle ground" for price. I expect price to stall, consolidate, and roll around between these levels trying to establish a new trend.
Thus, I believe BTCUSD will move downward, attempting to move back down to the $78,000 level.
Nothing has really changed in my analysis except that we are experiencing a 48-96 hour consolidation phase before we move back into big trending.
Play smart. Position your trades so that you can profit from this rolling price trend and prepare for the bigger price move downward (targeting the bigger base/bottom near April 15, 2025).
Get some.
#trading #research #investing #tradingalgos #tradingsignals #cycles #fibonacci #elliotwave #modelingsystems #stocks #bitcoin #btcusd #cryptos #spy #gold #nq #investing #trading #spytrading #spymarket #tradingmarket #stockmarket #silver

Nightly $SPY / $SPX Scenarios for April 1, 2025🔮 🔮
🌍 Market-Moving News 🌍:
🇺🇸📈 ISM Manufacturing PMI Release: The Institute for Supply Management (ISM) will release its Manufacturing Purchasing Managers' Index (PMI) for March. A reading below 50 indicates contraction in the manufacturing sector, which could influence market sentiment.
🇺🇸🏗️ Construction Spending Data: The U.S. Census Bureau will report on February's construction spending, providing insights into the health of the construction industry and potential impacts on related sectors.
🇺🇸📄 Job Openings Report: The Job Openings and Labor Turnover Survey (JOLTS) for February will be released, offering a view into labor demand and potential implications for wage growth and consumer spending.
📊 Key Data Releases 📊
📅 Tuesday, April 1:
🏭 ISM Manufacturing PMI (10:00 AM ET):
Forecast: 49.5%
Previous: 50.3%
Assesses the health of the manufacturing sector; a reading below 50% suggests contraction.
🏗️ Construction Spending (10:00 AM ET):
Forecast: 0.3%
Previous: -0.2%
Measures the total value of construction work done; indicates trends in the construction industry.
📄 Job Openings (10:00 AM ET):
Forecast: 7.7 million
Previous: 7.7 million
Provides insight into labor market demand by reporting the number of job vacancies.
⚠️ Disclaimer: This information is for educational and informational purposes only and should not be construed as financial advice. Always consult a licensed financial advisor before making investment decisions.
📌 #trading #stockmarket #economy #news #trendtao #charting #technicalanalysis

SPY/QQQ Plan Your Trade EOD Update : Rejecting The BreakdownDoes this big rejection bar mean the selling trend is over?
I doubt it.
In my opinion and experience, big rejection bars like this reflect a critical price level where the markets will attempt to REVISIT in the near future.
Normally, when we get a big rejection bar, like today, we are testing a critical support/resistance level in price and you can see the difference between the SPY, DIA and QQQ charts.
The QQQ price data is already below the critical support level and barely trying to get back above the rejection level. Whereas the SPY and DIA are still above the rejection lows.
I see this as a technology driven breakdown and because of the continued CAPTIAL SHIFT, we may move into a broader WAVE-C breakdown of this current trend.
I see the SPY already completing a Wave-A and Wave-B. If this breakdown plays out like I expect, we'll see a bigger breakdown in price targeting $525-535, then possibly reaching $495-505 as the immediate ultimate low.
If you follow my research, there is a much lower level near $465-475 that is still a likely downward target level, but we'll have to see how price reacts over the next 2+ days before we can determine if that level is still a valid target.
Watch for more support near recent lows tomorrow, then a potential breakdown in the SPY/QQQ/DIA.
Get some.
#trading #research #investing #tradingalgos #tradingsignals #cycles #fibonacci #elliotwave #modelingsystems #stocks #bitcoin #btcusd #cryptos #spy #gold #nq #investing #trading #spytrading #spymarket #tradingmarket #stockmarket #silver

$SPY BOOOM Perfectly Nailed the Bottom in last nights video
548/546 Bull put spreads were the money play today on that drop. And of course that would have been the place to go long on the day.
SPY timing for low Tgt $585My short idea target was hit (and blown yesterday, tho QQQ idea was almost perfect), and if you saw the last idea, I mentioned the date of the 11th was in play. This seems accurate from what I'm getting now with my dowsing work.
I am quite pumped that the timing was so good. The upside target (repeating) is around $585. When I ask what date this hits by, I get 3/25. We shall see if lightning can strike twice!

SPY - Macro-Market Overview and what the algorithms are sayingCurrently we are being guided by a strong selling teal on the LTF but we must keep in mind the HTF algorithms of red and white (which are bullish liquidity builders). Right now, we need to see who wins out in this fight between teal and red - if we break red and prove teal guidance, we are definitively in strong selling and can easily make our way toward the HTF white at the low $500's.
As always, let the algorithms guide you!
Happy Trading :)

$SPY March 31 2025
Looks like the structure is broken. No need to fight the trend as of now.
540 is the target for the last rise as marked.
As long as below 200 in lower time frames. No buys for me.

SPY/QQQ Plan Your Trade For 3-31 : Carryover PatternToday's pattern suggests the SPY/QQQ will attempt to carryover Friday's selling trend.
I do believe the SPY/QQQ will attempt to find some support as we move into a Temp Bottom pattern tomorrow. So be aware that the SPY/QQQ may attempt to find support near 535-540/450-455 over the next few days.
I would also urge traders to not get very aggressive in terms of trying to pick a bottom in this downtrend.
In my opinion, I don't see any reason why anyone should be buying into this breakdown unless you are prepared to take a few big lumps. Just wait it out - wait for a base/bottom to setup.
Gold and Silver are moving higher and I believe this trend will continue for many weeks/months.
BTCUSD should continue to move downward - trying to establish the Consolidation Phase range.
As we move into trading this week. Be aware that Tuesday/Wednesday of this week are more ROTATION type days. They may be wide-range days - but they are still going to be ROTATIONAL.
Get some.
#trading #research #investing #tradingalgos #tradingsignals #cycles #fibonacci #elliotwave #modelingsystems #stocks #bitcoin #btcusd #cryptos #spy #gold #nq #investing #trading #spytrading #spymarket #tradingmarket #stockmarket #silver

$Spy Road To $544well in summary this is the same chart i made 2 in a half weeks ago with no changes i never changed my thesis to bear lol allocating funds to the downside for my Short thesis!!! Lets see if we hit $544 this week Market sentiment is Bearish Terrif Reactions will most likely be priced in shortly so the market can actually choose its direction short bear market or bear market this week, this week will give a lot of insight and valuable information as always safe trades good luck traders and yes i will update this thread when in my theory and assessment analysis of $544 hits where i think the market go from there!!!!!

SPY: SPY looking a bit like scary hour? Continuous tariff new’s scaring the market. Many continue to say Bearish then some say Bullish.
Looking like it can retest the demand zone I see at the 1M at 584.83 but today 3/30 on AH looks like things may be gapping down already.
What are your thoughts?

Chat, Are we Cooked?We had a very similar post-Covid run up all the way before breaking in January 2022.
We saw a similar run up since that time.
Round 2, or just an overreaction?

Weekly $SPY / $SPX Scenarios for March 31 – April 4, 2025🔮 🔮
🌍 Market-Moving News 🌍:
🇺🇸📈 Anticipated U.S. Jobs Report: The March employment data, set for release on Friday, April 4, is expected to show a slowdown in job growth, with forecasts predicting an increase of 140,000 nonfarm payrolls, down from 151,000 in February. The unemployment rate is projected to remain steady at 4.1%. This report will be closely monitored for signs of economic momentum and potential impacts on Federal Reserve policy.
🇺🇸💼 President Trump's Tariff Announcement: President Donald Trump is scheduled to unveil his "reciprocal tariffs" plan on Wednesday, April 2, dubbed "Liberation Day." The announcement is anticipated to include a 25% duty on imported vehicles, which could significantly impact the automotive industry and broader market sentiment. Investors are bracing for potential volatility in response to these trade policy developments.
🇺🇸📊 Manufacturing and Services Sector Updates: Key indicators for the manufacturing and services sectors are due this week. The ISM Manufacturing PMI, scheduled for Tuesday, April 1, is expected to show a slight contraction with a forecast of 49.5%, down from 50.3% in February. The ISM Services PMI, set for release on Thursday, April 3, is projected at 53.0%, indicating continued expansion but at a slower pace. These reports will provide insights into the health of these critical sectors.
MarketWatch
📊 Key Data Releases 📊
📅 Monday, March 31:
🏭 Chicago Business Barometer (PMI) (9:45 AM ET):
Forecast: 45.5
Previous: 43.6
Measures business conditions in the Chicago area, with readings below 50 indicating contraction.
📅 Tuesday, April 1:
🏗️ Construction Spending (10:00 AM ET):
Forecast: 0.3%
Previous: -0.2%
Indicates the total amount spent on construction projects, reflecting trends in the construction industry.
📄 Job Openings (10:00 AM ET):
Forecast: 7.7 million
Previous: 7.7 million
Provides insight into labor demand by measuring the number of job vacancies.
📅 Wednesday, April 2:
🏭 Factory Orders (10:00 AM ET):
Forecast: 0.6%
Previous: 1.7%
Reflects the dollar level of new orders for both durable and non-durable goods, indicating manufacturing demand.
📅 Thursday, April 3:
📉 Initial Jobless Claims (8:30 AM ET):
Forecast: 226,000
Previous: 224,000
Measures the number of individuals filing for unemployment benefits for the first time, providing insight into labor market conditions.
📊 Trade Balance (8:30 AM ET):
Forecast: -$123.0 billion
Previous: -$131.4 billion
Indicates the difference between exports and imports of goods and services, reflecting the nation's trade activity.
📅 Friday, April 4:
💵 Average Hourly Earnings (8:30 AM ET):
Forecast: 0.3%
Previous: 0.3%
Measures the change in earnings per hour for workers, indicating wage inflation.
⚠️ Disclaimer: This information is for educational and informational purposes only and should not be construed as financial advice. Always consult with a professional financial advisor before making investment decisions.
📌 #trading #stockmarket #economy #news #trendtao #charting #technicalanalysis

SPY $545 Downtrend ContinuesSymbol: SPY
Timeframe: 30-minute chart (for your analysis)
Bias: Short (after the anticipated bounce)
Prediction: I anticipate a short-term bounce in SPY from Friday's sell-off towards the upper level of the weekly regression channel, around 560. I plan to look for a short entry at this level, expecting the price to then continue its downtrend towards the monthly regression channel support around 545.
Analysis:
Weekly Trend Channel (Blue Double Lines): The blue double lines on my chart represent a weekly trend channel for SPY. This channel was determined by performing a linear regression on the price action over the past week. The upper and lower boundaries of the channel are set at two standard deviations away from this linear regression line. This method helps to identify the statistically probable range within which the price is likely to trade over the weekly timeframe.
Monthly Trend Channel (Yellow Double Lines): Similarly, the yellow double lines indicate a monthly trend channel. This channel is derived from a linear regression of SPY's price action over the past month, with the boundaries set at two standard deviations. I expect SPY to eventually find support within this monthly channel, with the lower boundary currently around the 545 level. This is my primary downside target.
Recent Price Action and Anticipated Bounce: The aggressive 2% downtrend on Friday likely pushed SPY towards the lower end of the weekly channel, potentially creating oversold conditions in the short term. I am anticipating a bounce from this sell-off towards the upper boundary of the weekly channel, which I estimate to be around 560. This level is expected to act as resistance.
Short Entry Opportunity: I will be closely watching price action around the 560 level, which coincides with the upper boundary of the weekly regression channel. If I observe signs of rejection or bearish confirmation at this resistance, I will look to enter a short position.
Contributing Factors: President Trump's aggressive tariff policies continue to contribute to market uncertainty and the overall bearish sentiment, supporting the technical outlook for further downside.
Conclusion:
I am predicting a short-term bounce in SPY to approximately 560, which aligns with the upper level of the weekly regression channel. I will be looking for a short entry at this level with the expectation of a subsequent move down towards the monthly regression channel support around 545. This strategy aims to capitalize on a potential retracement within the established downtrend, guided by regression-based trend channels and influenced by fundamental concerns regarding tariff policies.
Disclaimer: This is my personal analysis and not financial advice. Please conduct your own research before making any trading decisions.

The Greatest Opportunity of Your Life : Answering QuestionsThis video is an answer to Luck264's question about potential price rotation.
I go into much more details because I want to highlight the need to keep price action in perspective related to overall (broader) and more immediate (shorter-term) trends.
Additionally, I try to highlight what I've been trying to tell all of you over the past 3+ years...
The next 3-%+ years are the GREATEST OPPORTUNITY OF YOUR LIFE.
You can't even imagine the potential for gains unless I try to draw it out for you. So, here you go.
This video highlights why price is the ultimate indicator and why my research/data is superior to many other types of analysis.
My data is factual, process-based, and results in A or B outcomes.
I don't mess around with too many indicators because I find them confusing at times.
Price tells me everything I need to know - learn what I do to improve your trading.
Hope you enjoy this video.
Get Some.
#trading #research #investing #tradingalgos #tradingsignals #cycles #fibonacci #elliotwave #modelingsystems #stocks #bitcoin #btcusd #cryptos #spy #gold #nq #investing #trading #spytrading #spymarket #tradingmarket #stockmarket #silver

$SPY - Keep It SimpleAll about trend lines. Since 2020 to today, there have been three major trends. The first was the bull run from covid bottoms to the 2022 highs; a very distinct trend line being drawn. The second was the correct in 2022; another distinct trendline drawn. Recently, we have a break of the uptrend associated with a bear flag continuation pattern. Keeping it simple, we take the pole of the flag and we measure it; 515-520 is a potential target. It lines up with prior lows and also the 0.385 fib level.

SPY: Bulls Will Push
The price of SPY will most likely increase soon enough, due to the demand beginning to exceed supply which we can see by looking at the chart of the pair.
Disclosure: I am part of Trade Nation's Influencer program and receive a monthly fee for using their TradingView charts in my analysis.
❤️ Please, support our work with like & comment! ❤️
SPY Price Projection: Mid-2025 TargetRevealing Market Trends: Logarithmic Regression Analysis Indicates Bullish Path for SPY
In the ever-evolving realm of financial analysis, the search for reliable predictions remains ongoing. Logarithmic scale regression analysis, coupled with potent indicators, has emerged as a promising tool for discerning trends, particularly regarding assets like the SPY.
This analysis delves into the utilization of logarithmic scale regression alongside two robust indicators, offering insights into the potential trajectory of the SPY's price movement. It's essential to note that the interpretations and predictions presented are based on my analysis alone and should not be construed as financial advice. As with any market analysis, uncertainties persist, and actual outcomes may diverge from projections.
Logarithmic scale regression accounts for the exponential nature of price movements, providing a nuanced perspective on long-term trends. When combined with indicators such as moving averages or momentum oscillators, the analysis gains depth, revealing not only the direction but also the strength of the trend.
After meticulous examination of historical data and the application of analytical tools, our analysis suggests a bullish trajectory for the SPY, with a projected price nearing 620 EUR by mid-2025. This projection implies a significant uptrend from the current date, with a potential increase of approximately 20% over the specified timeframe.
However, it's crucial to approach such forecasts with caution, recognizing the inherent risks associated with financial markets. While our analysis indicates a positive outlook, market conditions can change rapidly, leading to deviations from expected trends.
In summary, logarithmic scale regression analysis, supported by robust indicators, offers valuable insights into market trends and potential price movements. While our analysis suggests a bullish sentiment for the SPY, investors should conduct thorough research and seek professional advice before making investment decisions.
Disclaimer: The analysis provided is based on personal interpretation and should not be considered financial advice. Investing in financial markets carries risks, and actual outcomes may differ. Readers are encouraged to conduct their own research and consult with financial professionals before making investment decisions.

SPY nearing major support levels.Let's see if Spy can continue to hold 61.8 Fib Retracement at 550! A break could see further downside to the 540 area.
