Toast me or Roast me - I'm still learning & practicing charting
I was looking at descending scallops and some of their features via thepatternsite.com
What is valid or invalid about this charting here??
I have the high peak marked from the ATH that topped the uptrend on AMEX:SPY and the most recent upward breakout prior to trending back down on the 1HR as of yesterday. I know I will only be able to confirm in hindsight but is there good reason here for me to say we have the makings of a long-er term descending scallop in play here?
Thanks to all. I enjoy reading your opinions and discussions on the daily.
SPY trade ideas

Spy What's up guys?
Here's a update .. I'll cover NYA,Qqq,IWM,XLk,XLF
Here's NYA
Notice the price action above the yellow line? That's Wyckoff distribution.
Yesterday we retest that prior support.. the next leg down on this should start.
For more information just research Wyckoff distribution!
XLF (Banks)
Exact same chart as NYA.. Wyckoff retest... Pain incoming
XLK
This is the most important chart you will see on this post!
XLK is the biggest sector on the SPY! If XLK goes down so will the spy!
Daily chart is a major rising wedge..
4hour chart showing a bear flag
That same bear flag is showing on SPY and
Qqq
IWM
Bear flag inside of bear channel
To sum it up if Qqq breaks below 477 tomorrow or Friday , DO NOT CATCH THE KNIFE!!!!! We will most likely make new lows for March..
Core PCE tomorrow but don't forget about end of quarter rebalancing on Friday.. the last hour of the market WILL see some wild moves ..
Next week is a black out period with no earnings and it is the week of Tariffs. I think if they do flush they will try to get most of the selling done before earnings season kicks off April 7th.
Sorry if this is a little rushed but I've been busy.. I'll try to update this more tomorrow..
Lastly
Vix
I thought they would flush this back to 14.73 but when QQQ rejected off it's 200ma , Vix bounced off it's 200ma (No coincidence).. unless PCE sends this below 17.00 tomorrow we are headed back to 23.00
If you need a bigger picture just look at my previous spy post
But let me break this down to you simple.
This spy, you see the yellow area I am highlighting? THAT IS WYCKOFF DISTRIBUTION!
NOW GO TO YOUR WEEKLY CHART , ZOOM OUT AND LOOK AT THE STRUCTURE OF
TVC:DJI
NASDAQ:MSFT
NASDAQ:QQQ
NASDAQ:NVDA
NASDAQ:AAPL
They are all showing distribution , some 6months worth of it.. So what happens when distribution support is broken as It was on SPY at 580?
What happens next is a Reset! It is exactly what happened in 2022...

SPY 03/26Looks like it's about to roll down. First target would be monthly VWAP. Not financial advice. Could also range a little bit longer.
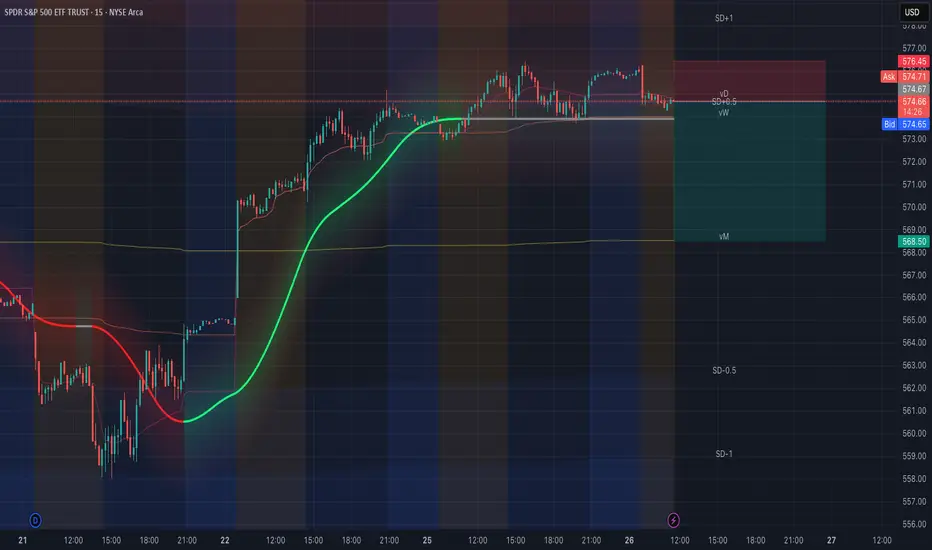
$SPY Analysis & Targets for Day Trading My bet is that we keep trading Sidewards today with the 35EMA as support intradaty
570/572 @0.30 is a nice spread to start here.
Tariffs and Trade: Order Behind the Chaos?
AMEX:SPY , NASDAQ:TLT . Tariffs: It seems that mainstream media is depicting this administration's economic policies as chaotic, suggesting a sense of uncertainty and confusion about what’s happening. However, we can infer that the situation is far from messy. Eventually, tariffs worldwide could be balanced on fairer terms, leading to much more efficient global trade. In cases where tariffs remain reciprocally high, it might simply indicate a shift to a different taxation mechanism, moving away from direct government taxation.

The End of MarchMy feeling is the bearish cycles into the end of March is playing out now and this upward correction is finished. We may revisit the bottom of both QQQ and SPY in the short term. If wrong, the SPX will get above 5780 today

SPY WILL FALL|SHORT|
✅SPY has hit a key structure level of 577.50$
Which implies a high likelihood of a move down
As some market participants will be taking profit from their long positions
While others will find this price level to be good for selling
So as usual we will have a chance to ride the wave of a bearish correction
SHORT🔥
✅Like and subscribe to never miss a new idea!✅
Disclosure: I am part of Trade Nation's Influencer program and receive a monthly fee for using their TradingView charts in my analysis.

SPY/QQQ Plan Your Trade for 3-26-25 : Flat-Down PatternToday's Flat-Down pattern for the SPY/QQQ suggests the markets will consolidate in a sideways channel, generally drifting downward.
As I've been warning all of you for the past month+, the market will likely roll over into a topping formation over the next few days, then start an aggressive downward trend targeting $525-535 on the SPY.
Today's video covers some details related to my expectations and how traders can prepare for the bigger moves I see pending.
Gold and Silver are poised for a potentially BIG BREAKOUT move to the upside. And I still believe Gold/Silver are going to rally another 15-20% within the next 30-45 days.
Bitcoin should follow the SPY/QQQ into a "rollover top" type of pattern then shift into a downward price trend over the next few days.
Everything is following my predictions/expectations almost perfectly.
Now, we try to profit from some of these big moves.
Go get some.
#trading #research #investing #tradingalgos #tradingsignals #cycles #fibonacci #elliotwave #modelingsystems #stocks #bitcoin #btcusd #cryptos #spy #gold #nq #investing #trading #spytrading #spymarket #tradingmarket #stockmarket #silver

$SPY March 26, 2025AMEX:SPY March 26, 2025
15 Minutes.
Sideways consolidation on for moving averages to catch up.
For the moment upside is capped 576-579 levels which is also top of channel.
576 - 578 is a good sell for 571-573 levels target for today.
Since 3 moving averages are nearby 9, 21 and 50.
I expect a one-sided movement.
So far, no trade for me for the week.

$SPY Bounce to 590s?Hey everyone, it's your boy pic. AMEX:SPY looks primed for a typical ABC correction to around 590 going into the second half of March. Chart lines up with NextPivot Indicator and FIB levels just as pretty as you please. Nice look with clear stops. Good luck!

* SPY Update 3/25 *Hello again peoples,
As we witnessed today, price did not do what I was looking for yesterday. Instead, we went through some range bound price movement, tested yesterday's high and bounced back strong towards today's high but not break out happened yet. That is just a perfect scenario to raise my blood pressure, but here is what I will be looking for tomorrow.
- Today's consolidation could be a bear trap for those that realized the early signs of trend weakness. As you know, our target for W3 to be completed is right above this resistance at $577. We were able to consolidate, and possibly accumulate, right below that level while holding $573 support. Bears tried, but even when they aggressively pushed down price, as soon as it hit our support, price stabilized and bulls pushed back up at the end of the day.
- If you look at our 30D Volume Profile, you can see 3 levels that I highlighted. The level #1 is the support we held, #2 is here I can see price finding resistance (end of the 70% value area), #3 is where price might go it it breaks #2.
- It might be a crazy coincidence of the universe, but our TP for W3 is right in between #2 and #3.
- In our 5min chart, we can see how we were able to bounce off the 200 EMA. And if you look at the 1hour chart:
- You can see that our 20Ema(orange) is the same as the 200ema in the 5min chart.
- A nice buy opportunity for those that missed today will be if price test that $574 support again before starting our last leg up towards $580.
Anyway, this is what I have for today. Let me know what you think and how I can make my analysis better!

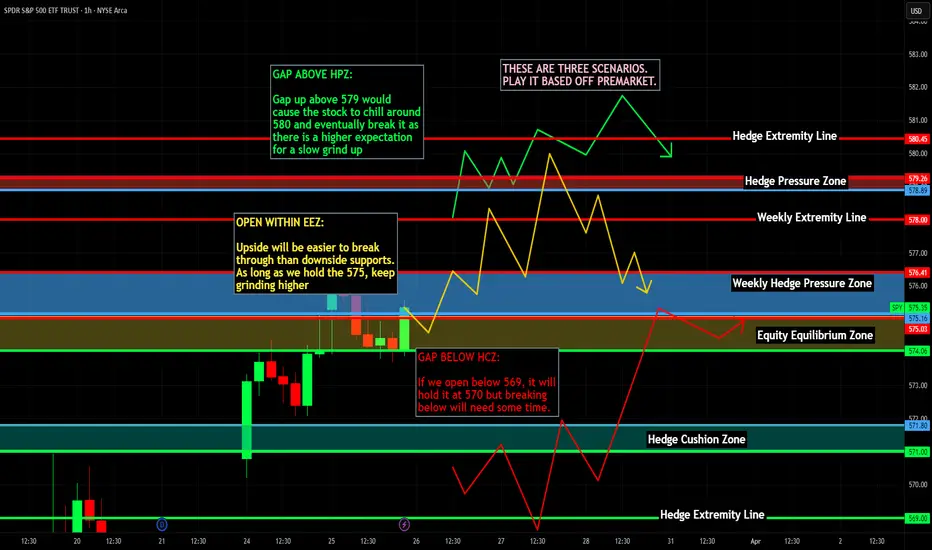
Nightly $SPY / $SPX Scenarios for March 26, 2025🔮 🔮
🌍 Market-Moving News 🌍:
🇺🇸📉 Consumer Confidence Hits Four-Year Low: The Conference Board reported that the Consumer Confidence Index fell to 92.9 in March, marking the fourth consecutive monthly decline and reaching its lowest level since January 2021. Rising concerns over tariffs and inflation are major contributors to this decline.
🇺🇸🏠 New Home Sales Rebound: New home sales increased by 1.8% in February to a seasonally adjusted annual rate of 676,000 units, slightly below the forecasted 679,000. The median sales price decreased by 1.5% to $414,500 from a year earlier, indicating potential affordability improvements in the housing market.
📊 Key Data Releases 📊
📅 Wednesday, March 26:
🛠️ Durable Goods Orders (8:30 AM ET):
Forecast: -1.0%
Previous: 3.2%
Reflects new orders placed with domestic manufacturers for long-lasting goods, indicating manufacturing activity.
⚠️ Disclaimer: This information is for educational and informational purposes only and should not be construed as financial advice. Always consult a licensed financial advisor before making investment decisions.
📌 #trading #stockmarket #economy #news #trendtao #charting #technicalanalysis
SPY Technical Outlook - Will Buyers Step In?AMEX:SPY is experiencing a corrective move after rejecting the upper boundary of the ascending channel. This rejection led to increased selling pressure, bringing price back to the lower boundary of the channel, where buyers may step in to defend the trendline support.
If the price holds at this dynamic support level, a bullish reaction could send AMEX:SPY toward the midline of the channel, with the next target around 607.00. Holding above this level would reinforce the bullish trend structure and increase the probability of continuation toward the upper boundary of the channel.
However, a breakdown below the trendline support would weaken the bullish outlook and open the door for further downside. Monitoring price action, volume, and confirmation signals will be crucial in determining the next move.

SPY Free Signal! Sell!
Hello,Traders!
SPY made a nice bullish
Move and will soon hit a
Horizontal support of 577.19$
From where we can enter
A short trade with the
Take Profit of 566.48$
And the Stop Loss of 583.38$
Sell!
Comment and subscribe to help us grow!
Check out other forecasts below too!
Disclosure: I am part of Trade Nation's Influencer program and receive a monthly fee for using their TradingView charts in my analysis.

$SPY March 25, 20252nd Post.
This chart shows oscillator divergence in LL and 100% extension around 580.
Hence this also supports the previous post numbers of 579-580 at the moment for the day.

$SPY Marcg 25, 2025AMEX:SPY Marcg 25, 2025
15 Minutes.
No trade for me yesterday as gap up and had no chance to enter.
For the rise 561.48 to 575.17 i am expecting a retrace to 566-568 levels as too far away from movoing averages.
On 60-minute time frame for the fall 597.37 to 549.68 4SPY has retraced between .5 to .618 levels.
So, at the moment I expect upside to be capped at 579-580 levels being .618 levels.
So, I will short around that levels or buy around 569 levels for the day.

SPY had a very bulish close to the week!boost and follow for more ❤️🔥
SPY had bullish break of trend resistance to finish the week after a big gap down, bulls continue to buy the dip and now we are gapping up in the futures market. push into 572.47 is likely, from there we either reject and head to lower to trend support or break the resistance and start heading higher to 578.31-584.92 🎯

SPY/QQQ Plan Your Trade For 3-25-25 : Top PatternToday's Top Pattern suggests the SPY/QQQ will find resistance slightly above yesterday's closing price level and attempt to roll over into a bearish price trend.
Watch today's video to see which levels I believe will be the top for the SPY & QQQ.
I do expect metals to rally over the next 3+ weeks and I'm watching for this morning's bounce to carry onward and upward.
Bitcoin should be rolling downward off that FWB:88K top level I predicted months ago.
We are moving into a topping phase - so get ready for the markets to attempt to ROLL DOWNWARD over the next 5+ trading days into a deeper low price level.
Get some.
#trading #research #investing #tradingalgos #tradingsignals #cycles #fibonacci #elliotwave #modelingsystems #stocks #bitcoin #btcusd #cryptos #spy #gold #nq #investing #trading #spytrading #spymarket #tradingmarket #stockmarket #silver

ETFs vs Mutual Funds: Differences and Advantages ETFs vs Mutual Funds: Differences and Advantages
Exchange-traded funds (ETFs) and mutual funds are two of the most popular investment options, each offering unique features and advantages. While both provide access to diversified portfolios, their differences in structure, management, and trading make them suitable for different strategies. This article breaks down the key distinctions between exchange-traded funds vs mutual funds and how to choose between them.
What Are ETFs?
Exchange-traded funds, or ETFs, are investment vehicles that allow traders to access a diverse range of assets through a single product. An ETF is essentially a basket of investments—such as stocks, bonds, or commodities—that typically tracks the performance of an index, sector, or specific theme. For example, SPDR S&P 500 ETF Trust (SPY) follows the S&P 500 index, providing exposure to the largest companies listed on US stock exchanges.
What sets ETFs apart is how they’re traded. Unlike mutual funds, which are only bought or sold at the end of the trading day, ETFs trade on stock exchanges throughout the day, just like individual shares. This means their prices fluctuate as demand and supply change, giving traders the flexibility to enter or exit positions at market prices.
ETFs are known for their cost-effectiveness, as most are passively managed to mirror the performance of an index rather than exceed it. This passive structure usually leads to lower management fees compared to actively managed funds. Additionally, ETFs are often transparent, with their holdings disclosed daily, so investors know exactly what they’re buying.
ETFs come in various types, from those focused on specific sectors, like technology or healthcare, to broader options covering entire economies or bond markets. This variety makes them a popular choice for traders and investors looking to diversify or target specific market opportunities.
What Are Mutual Funds?
Mutual funds are investment products that pool money from multiple investors to create a diversified portfolio, typically managed by a professional fund manager. These funds invest in a wide range of assets, including stocks, bonds, and other securities, depending on the fund’s objective. For instance, an equity mutual fund focuses on stocks, while a bond fund invests primarily in fixed-income securities.
One defining feature of mutual funds is their pricing. Unlike ETFs, mutual funds aren’t traded on stock exchanges. Instead, they are bought and sold at the fund’s net asset value (NAV), which is calculated at the end of each trading day. This makes them more suited to long-term investment strategies.
Mutual funds often appeal to investors looking for a hands-off approach. The fund manager handles the selection and management of assets, aiming to achieve the fund’s stated goals—whether that’s generating income, preserving capital, or achieving long-term growth.
However, this active management comes with higher fees compared to ETFs. These costs include management fees and sometimes additional charges like entry or exit loads, which can eat into returns over time.
Mutual funds also often require a minimum investment, making them less accessible for some investors. That said, they offer a wide variety of options, from sector-specific funds to diversified portfolios, providing flexibility for different investment goals and risk preferences.
Are There Differences Between an ETF and a Mutual Fund?
ETFs and mutual funds share similarities—they both allow investors to pool money into diversified portfolios. However, the differences between ETFs and mutual funds can significantly impact which one is better suited to an investor’s goals.
Trading and Pricing
ETFs are traded on stock exchanges continuously during market hours, similar to individual shares. Price fluctuations are based on market demand and supply. In contrast, mutual funds are priced only once per day after the market closes, based on the fund’s net asset value (NAV). This makes ETFs more appealing for those seeking flexibility and the ability to react to market movements, while mutual funds cater to long-term investors less concerned with intraday price changes.
Management Style
ETFs are mostly passively managed, designed to track the performance of a specific index, sector, or asset class. Mutual funds, on the other hand, often feature active management. This involves fund managers selecting assets to outperform the market, which can offer potential opportunities for higher returns but also comes with increased costs.
Fees and Costs
ETFs typically come with a lower expense ratio compared to mutual funds, making them more cost-efficient. This is due to their passive management approach and lower operational costs. Mutual funds may charge higher fees to cover active management and administrative expenses. Additionally, mutual funds may have extra costs like sales charges or redemption fees, whereas ETFs incur standard brokerage commissions.
Liquidity
When considering mutual funds versus ETFs, liquidity becomes a critical factor, as ETF prices change intraday, while mutual funds are limited to end-of-day pricing. This difference can influence how quickly you can access your funds.
Tax Efficiency
ETFs tend to be more tax-efficient because of their structure. When investors sell ETF shares, transactions occur directly between buyers and sellers on the exchange, limiting taxable events. In mutual funds, redemptions often require the fund manager to sell securities, which can result in capital gains distributed to all investors in the fund.
Minimum Investment
Mutual funds often require a minimum initial investment, which can range from a few hundred to thousands of dollars. ETFs, however, don’t have such requirements—traders can purchase as little as a single share, making them more accessible for those with smaller starting capital.
ETF CFD Trading
ETF CFD trading offers a flexible way for traders to speculate on the price movements of exchange-traded funds without the need to buy them on stock exchanges. CFDs, or Contracts for Difference, are derivative products that track the price of an ETF, allowing traders to take positions on whether the price will rise or fall. This approach is particularly appealing for short-term speculation, making it a useful complement to traditional long-term ETF or mutual fund investing.
Flexibility
One of the standout features of ETF CFDs is their flexibility. Unlike investing directly in ETFs, CFD trading enables you to capitalise on price fluctuations without owning ETF shares. Traders can go long if they anticipate a rise in the ETF’s value or short if they expect a decline. This ability to trade in both directions can potentially create opportunities in both bullish and bearish markets. Moreover, CFDs allow for trading over shorter timeframes like 1-minute or 5-minute charts, providing potential opportunities for scalpers and day traders.
Leverage
Leverage is another significant feature of ETF CFDs. With leverage, traders can gain larger exposure to an ETF’s price movements with smaller initial capital. For example, using 5:1 leverage, a $1,000 position would control $5,000 worth of ETF exposure. However, you should remember that while this magnifies potential returns, losses are also amplified, making risk management a critical component of trading CFD products.
Costs
Actively managed ETFs can charge expense ratios to cover management and operational costs. CFDs eliminate these fees, as traders don’t directly invest in the ETF’s assets. However, both ETF investing and ETF CFD trading include brokerage fees or spreads.
Wider Range of Markets
With CFDs, traders can access a variety of global ETF markets through a single platform. This reduces the need to open accounts in different jurisdictions, saving on administrative and currency conversion costs.
CFD trading is popular among traders who want to take advantage of short-term price movements, diversify their strategies, or access ETF markets straightforwardly. While traditional ETFs are often favoured for long-term growth, ETF CFDs provide an active, fast-paced alternative for traders looking to react quickly to market changes.
Use Cases for ETFs and Mutual Funds
In comparing ETFs vs mutual funds, it’s important to recognise their use cases based on an investor’s goals, strategies, and time horizons.
ETFs
ETFs are used by investors seeking flexibility and real-time market engagement. They are attractive for those who want to take advantage of price movements or actively manage their portfolios. For example, an investor might focus on sector-specific ETFs, like technology or energy, to capitalise on industry trends. ETFs also offer a lower-cost option for diversification, making them useful for those building broad exposure across markets without significant capital.
Additionally, ETFs may be effective for hedging. An investor with exposure to a specific market segment can use an ETF to potentially offset risks, especially in volatile markets. For instance, during an anticipated downturn in equities, an inverse ETF could be used to possibly mitigate losses.
Mutual Funds
Mutual funds are popular among long-term investors prioritising professional management. Their hands-off approach makes them appealing to individuals who prefer not to monitor markets daily. For instance, someone saving for retirement might opt for a diversified mutual fund that balances risk and growth over time.
Mutual funds are also advantageous for accessing specialised strategies, such as actively managed funds focusing on niche markets or themes. While they typically involve higher fees, the tailored management can align with specific financial objectives.
Factors for Choosing Between ETFs and Mutual Funds
Selecting between mutual funds vs ETF options depends on an investor’s financial goals, trading style, and the level of involvement they are comfortable with in managing their investments.
- Time Horizon: ETFs are popular among short- to medium-term investors and traders who prefer flexibility and the ability to follow intraday price movement. Mutual funds, on the other hand, are mostly used by long-term investors focused on gradual growth or income over time.
- Cost Sensitivity: ETFs generally have lower expense ratios and no minimum investment requirements, making them cost-efficient. Mutual funds often involve higher management fees and, in some cases, additional charges like entry or exit fees, which can add up over time.
- Active vs Passive Management: If you’re looking for a hands-off approach with professional oversight, actively managed mutual funds might be more appealing. However, if you prefer to track indices or specific sectors at a lower cost, ETFs might be more suitable.
- Liquidity Needs: Investors who need quick access to their capital often prefer ETFs because they can be traded throughout the day. Mutual funds lack this intraday liquidity, as transactions are only processed at the trading day’s end.
The Bottom Line
Understanding the differences between mutual funds vs exchange-traded funds is crucial for selecting the right investment approach. ETFs offer flexibility and cost-efficiency, while mutual funds are popular among long-term investors seeking professional management. For those interested in ETF CFD trading, which allows traders trade in rising and falling markets, opening an FXOpen account provides access to a diverse range of ETF markets alongside competitive trading conditions.
FAQ
What Is an ETF vs Mutual Fund?
An ETF is a fund traded on stock exchanges, offering intraday liquidity and lower fees, typically tracking an index or sector. A mutual fund pools investor money for professional management, priced once at the end of a trading day at its net asset value per share.
Mutual Funds and ETFs: Differences
ETFs trade like stocks, are generally more cost-efficient, and offer intraday liquidity. Mutual funds are actively managed, have higher fees, and are designed for long-term investing with end-of-day pricing.
Is the S&P 500 an ETF or a Mutual Fund?
The S&P 500 itself is an index, not a fund. However, it can be tracked by both ETFs (like SPDR S&P 500 ETF) and mutual funds, offering similar exposure but with differing management styles and fee structures.
This article represents the opinion of the Companies operating under the FXOpen brand only. It is not to be construed as an offer, solicitation, or recommendation with respect to products and services provided by the Companies operating under the FXOpen brand, nor is it to be considered financial advice.

Nightly $SPY / $SPX Scenarios for March 25, 2025🔮 🔮
🌍 Market-Moving News 🌍:
🇺🇸🛍️ Amazon Spring Sale Impact 🛍️: Amazon’s Big Spring Sale is underway, and increased consumer activity could lift retail sector sentiment this week. Watch for broader impacts on e-commerce competitors and discretionary stocks.
🇬🇧📉 UK Growth Outlook Cut 📉: Ahead of the UK's Spring Statement, the Office for Budget Responsibility is expected to revise growth forecasts downward. While not U.S.-centric, weaker UK economic momentum may influence broader global risk sentiment.
📊 Key Data Releases 📊:
📅 Tuesday, March 25:
🏠 S&P Case-Shiller Home Price Index (9:00 AM ET):
Forecast: +4.4% YoY
Previous: +4.5% YoY
A gauge of housing market strength based on home price changes in 20 U.S. metro areas.
🛒 Consumer Confidence Index (10:00 AM ET):
Forecast: 95.0
Previous: 98.3
Measures consumers’ outlook on business and labor conditions. A key sentiment driver.
🏘️ New Home Sales (10:00 AM ET):
Forecast: 679K annualized
Previous: 657K
Tracks the number of newly constructed homes sold. Sensitive to rates and affordability.
⚠️ Disclaimer: This information is for educational and informational purposes only and should not be construed as financial advice. Always consult with a professional financial advisor before making investment decisions.
📌 #trading #stockmarket #economy #news #trendtao #charting #technicalanalysis

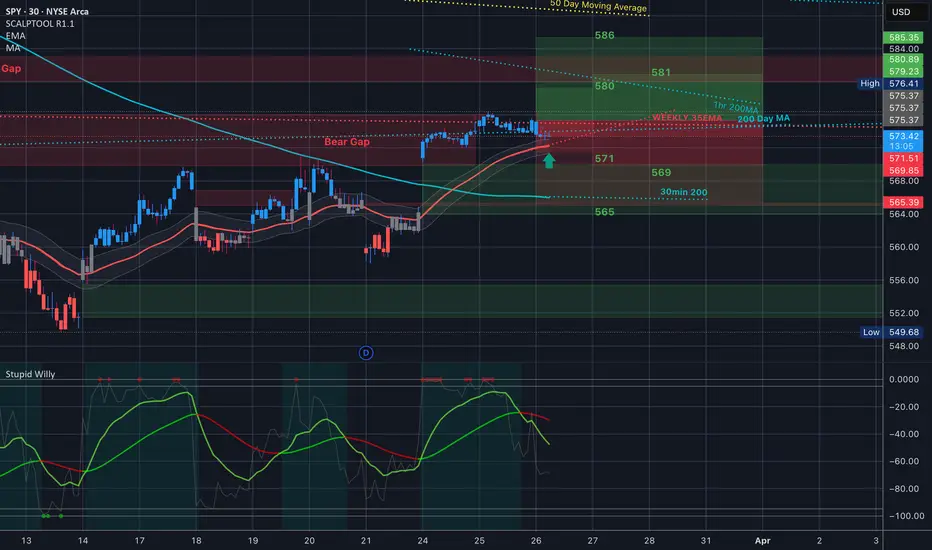
SPY at Critical Levels! Decision Point for Bulls and BearsHere’s a clear breakdown for SPY based on the 1-hour chart and Options GEX:
📈 Technical Analysis (TA):
* SPY recently broke structure bullishly (BOS) at ~$573, confirming bullish momentum.
* Immediate Support identified around $570–$573, marking a potential bullish reversal zone (green zone).
* Strong bearish reversal zone detected at $550–$560 (red zone), critical if the market pulls back significantly.
* MACD and Stoch RSI are indicating potential weakening momentum; watch closely for consolidation or slight retracement.
📊 GEX & Options Insights:
* Highest negative NETGEX / PUT support at $560 level. This area is crucial to watch for downside protection.
* Immediate strong CALL resistance at the $575–$580 area, acting as a ceiling for bullish momentum.
* IV Rank moderate at 23.2%, indicating balanced option premium pricing.
* PUT/CALL ratio balanced (PUT$ 50.7%), indicating mixed market sentiment.
💡 Trade Recommendations:
* Bullish Scenario: Confirm a hold above the green reversal zone ($573) and target CALL resistance near $580 initially, with a potential extension to $585–$590 if bullish momentum continues. Keep tight stops around $570.
* Bearish Scenario: Consider bearish positions if SPY breaks below $570 decisively, targeting the significant bearish reversal zone at $560.
* Neutral Strategy: Iron Condors or credit spreads between the $560–$580 range, benefiting from current balanced IV environment.
🛑 Risk Management:
Given current volatility at critical decision points, manage your risks carefully, and consider tighter stops and smaller position sizing.
Trade smart and safe!
Disclaimer: This analysis is for educational purposes only and does not constitute financial advice. Always do your own research and manage your risk before trading.

SPY REPEATING THIS JANUARY 2022 PATTERN NOW !! (March 24, 2025)This bearish pattern is repeating on AMEX:SPY let's talk abt it

SPY Trend Analysis
SPY has been in a long-term uptrend , with two major corrections (2022 & 2023) that touched the primary trend line before recovering.
The most recent bullish channel (late 2023 - early 2024) has broken downward , indicating a short-term pullback .
SPY remains bullish in the long-term as long as it stays above the primary trend line (~$500).
Short-term correction might continue toward $550 before resuming the uptrend.
⚠️ Disclaimer : This is not financial advice. Always conduct your own research before making investment decisions.
