SPY: Bearish Continuation & Short Trade
SPY
- Classic bearish pattern
- Our team expects retracement
SUGGESTED TRADE:
Swing Trade
Sell SPY
Entry - 625.36
Stop - 633.00
Take - 611.27
Our Risk - 1%
Start protection of your profits from lower levels
Disclosure: I am part of Trade Nation's Influencer program and receive a monthly fee for using their TradingView charts in my analysis.
❤️ Please, support our work with like & comment! ❤️
SPY trade ideas

Call or Put? Cast Your Vote!Based on this chart/image, would you vote for a Call (price going up) or Put (price going down)? What’s your opinion?"
SPY Under Pressure! SELL!
My dear friends,
Please, find my technical outlook for SPY below:
The instrument tests an important psychological level 625.36
Bias - Bearish
Technical Indicators: Supper Trend gives a precise Bearish signal, while Pivot Point HL predicts price changes and potential reversals in the market.
Target - 610.17
Recommended Stop Loss - 632.61
About Used Indicators:
Super-trend indicator is more useful in trending markets where there are clear uptrends and downtrends in price.
Disclosure: I am part of Trade Nation's Influencer program and receive a monthly fee for using their TradingView charts in my analysis.
———————————
WISH YOU ALL LUCK

SP500: Fib Channels on Fractal Corridors Research Notes
Testing angle of trendline which acts as support then defines resistance.
Structural reference
Pattern expressed in Fibonacci:
Ascending:
Descending:
Fib Channels on Fractal Corridors supposed to show alternative mapping method which differs from following approach.

SPY/QQQ Plan Your Trade End Of Week Update For 7-4Happy 4th of July
I've been very busy with projects and new tools for traders, as well as the new book I'm working on, and thought I would deliver an End Of Week update for everyone.
In this video, I cover the past Cycle Patterns and how they played out for the SPY/QQQ, Gold/Silver, and Bitcoin, as well as add some of my own insight related to the market trends.
All of my systems are still LONG and have not changed. I still believe this market is extremely overbought, and I believe it could roll over at any moment into a pullback - but we need to wait to see if/when that may/does happen.
Gold made a big move higher this week, and I believe that move could continue throughout July.
Bitcoin made a surprising Double-Top and is not rolling downward. Could be a breakdown in the markets as BTCUSD tends to lead the QQQ/NQ by about 3-5 days.
The SPY/QQQ rallied like a rocket all week. It was absolutely incredible to see the markets rally like this. But, I'm still cautious of a sudden rollover top.
I managed to catch some nice trades with options spreads this week, and my metals positions were on fire. I'm still trading from a "hedge everything" mode as I don't trust this rally, and I'm still watching for REJECTIONS near these new highs.
Stay safe and GET SOME.
DM me if you have any questions.
#trading #research #investing #tradingalgos #tradingsignals #cycles #fibonacci #elliotwave #modelingsystems #stocks #bitcoin #btcusd #cryptos #spy #gold #nq #investing #trading #spytrading #spymarket #tradingmarket #stockmarket #silver

Debugging Pine Script with log.info()log.info() is one of the most powerful tools in Pine Script that no one knows about. Whenever you code, you want to be able to debug, or find out why something isn’t working. The log.info() command will help you do that. Without it, creating more complex Pine Scripts becomes exponentially more difficult.
The first thing to note is that log.info() only displays strings. So, if you have a variable that is not a string, you must turn it into a string in order for log.info() to work. The way you do that is with the str.tostring() command. And remember, it's all lower case! You can throw in any numeric value (float, int, timestamp) into str.string() and it should work.
Next, in order to make your output intelligible, you may want to identify whatever value you are logging. For example, if an RSI value is 50, you don’t want a bunch of lines that just say “50”. You may want it to say “RSI = 50”.
To do that, you’ll have to use the concatenation operator. For example, if you have a variable called “rsi”, and its value is 50, then you would use the “+” concatenation symbol.
EXAMPLE 1
━━━━━━━━━━━━━━━━━━━━━━━━━━━━━━━━━
//@version=6
indicator("log.info()")
rsi = ta.rsi(close,14)
log.info(“RSI= ” + str.tostring(rsi))
Example Output =>
RSI= 50
Here, we use double quotes to create a string that contains the name of the variable, in this case “RSI = “, then we concatenate it with a stringified version of the variable, rsi.
Now that you know how to write a log, where do you view them? There isn’t a lot of documentation on it, and the link is not conveniently located.
Open up the “Pine Editor” tab at the bottom of any chart view, and you’ll see a “3 dot” button at the top right of the pane. Click that, and right above the “Help” menu item you’ll see “Pine logs”. Clicking that will open that to open a pane on the right of your browser - replacing whatever was in the right pane area before. This is where your log output will show up.
But, because you’re dealing with time series data, using the log.info() command without some type of condition will give you a fast moving stream of numbers that will be difficult to interpret. So, you may only want the output to show up once per bar, or only under specific conditions.
To have the output show up only after all computations have completed, you’ll need to use the barState.islast command. Remember, barState is camelCase, but islast is not!
EXAMPLE 2
━━━━━━━━━━━━━━━━━━━━━━━━━━━━━━━━━
//@version=6
indicator("log.info()")
rsi = ta.rsi(close,14)
if barState.islast
log.info("RSI=" + str.tostring(rsi))
plot(rsi)
However, this can be less than ideal, because you may want the value of the rsi variable on a particular bar, at a particular time, or under a specific chart condition. Let’s hit these one at a time.
In each of these cases, the built-in bar_index variable will come in handy. When debugging, I typically like to assign a variable “bix” to represent bar_index, and include it in the output.
So, if I want to see the rsi value when RSI crosses above 0.5, then I would have something like:
EXAMPLE 3
━━━━━━━━━━━━━━━━━━━━━━━━━━━━━━━━━
//@version=6
indicator("log.info()")
rsi = ta.rsi(close,14)
bix = bar_index
rsiCrossedOver = ta.crossover(rsi,0.5)
if rsiCrossedOver
log.info("bix=" + str.tostring(bix) + " - RSI=" + str.tostring(rsi))
plot(rsi)
Example Output =>
bix=19964 - RSI=51.8449459867
bix=19972 - RSI=50.0975830828
bix=19983 - RSI=53.3529808079
bix=19985 - RSI=53.1595745146
bix=19999 - RSI=66.6466337654
bix=20001 - RSI=52.2191767466
Here, we see that the output only appears when the condition is met.
A useful thing to know is that if you want to limit the number of decimal places, then you would use the command str.tostring(rsi,”#.##”), which tells the interpreter that the format of the number should only be 2 decimal places. Or you could round the rsi variable with a command like rsi2 = math.round(rsi*100)/100 . In either case you’re output would look like:
bix=19964 - RSI=51.84
bix=19972 - RSI=50.1
bix=19983 - RSI=53.35
bix=19985 - RSI=53.16
bix=19999 - RSI=66.65
bix=20001 - RSI=52.22
This would decrease the amount of memory that’s being used to display your variable’s values, which can become a limitation for the log.info() command. It only allows 4096 characters per line, so when you get to trying to output arrays (which is another cool feature), you’ll have to keep that in mind.
Another thing to note is that log output is always preceded by a timestamp, but for the sake of brevity, I’m not including those in the output examples.
If you wanted to only output a value after the chart was fully loaded, that’s when barState.islast command comes in. Under this condition, only one line of output is created per tick update — AFTER the chart has finished loading. For example, if you only want to see what the the current bar_index and rsi values are, without filling up your log window with everything that happens before, then you could use the following code:
EXAMPLE 4
━━━━━━━━━━━━━━━━━━━━━━━━━━━━━━━━━
//@version=6
indicator("log.info()")
rsi = ta.rsi(close,14)
bix = bar_index
if barstate.islast
log.info("bix=" + str.tostring(bix) + " - RSI=" + str.tostring(rsi))
Example Output =>
bix=20203 - RSI=53.1103309071
This value would keep updating after every new bar tick.
The log.info() command is a huge help in creating new scripts, however, it does have its limitations. As mentioned earlier, only 4096 characters are allowed per line. So, although you can use log.info() to output arrays, you have to be aware of how many characters that array will use.
The following code DOES NOT WORK! And, the only way you can find out why will be the red exclamation point next to the name of the indicator. That, and nothing will show up on the chart, or in the logs.
// CODE DOESN’T WORK
//@version=6
indicator("MW - log.info()")
var array rsi_arr = array.new()
rsi = ta.rsi(close,14)
bix = bar_index
rsiCrossedOver = ta.crossover(rsi,50)
if rsiCrossedOver
array.push(rsi_arr, rsi)
if barstate.islast
log.info("rsi_arr:" + str.tostring(rsi_arr))
log.info("bix=" + str.tostring(bix) + " - RSI=" + str.tostring(rsi))
plot(rsi)
// No code errors, but will not compile because too much is being written to the logs.
However, after putting some time restrictions in with the i_startTime and i_endTime user input variables, and creating a dateFilter variable to use in the conditions, I can limit the size of the final array. So, the following code does work.
EXAMPLE 5
━━━━━━━━━━━━━━━━━━━━━━━━━━━━━━━━━
// CODE DOES WORK
//@version=6
indicator("MW - log.info()")
i_startTime = input.time(title="Start", defval=timestamp("01 Jan 2025 13:30 +0000"))
i_endTime = input.time(title="End", defval=timestamp("1 Jan 2099 19:30 +0000"))
var array rsi_arr = array.new()
dateFilter = time >= i_startTime and time <= i_endTime
rsi = ta.rsi(close,14)
bix = bar_index
rsiCrossedOver = ta.crossover(rsi,50) and dateFilter // <== The dateFilter condition keeps the array from getting too big
if rsiCrossedOver
array.push(rsi_arr, rsi)
if barstate.islast
log.info("rsi_arr:" + str.tostring(rsi_arr))
log.info("bix=" + str.tostring(bix) + " - RSI=" + str.tostring(rsi))
plot(rsi)
Example Output =>
rsi_arr:
bix=20210 - RSI=56.9030578034
Of course, if you restrict the decimal places by using the rounding the rsi value with something like rsiRounded = math.round(rsi * 100) / 100 , then you can further reduce the size of your array. In this case the output may look something like:
Example Output =>
rsi_arr:
bix=20210 - RSI=55.6947486019
This will give your code a little breathing room.
In a nutshell, I was coding for over a year trying to debug by pushing output to labels, tables, and using libraries that cluttered up my code. Once I was able to debug with log.info() it was a game changer. I was able to start building much more advanced scripts. Hopefully, this will help you on your journey as well.

Update on the Markets 7/3/25SPY got the pop up I was looking for - now the question is - does it hold and continue? Not sure yet. Gold could be bullish if it gets over 3370. Usoil had a pop but nothing screaming reversal yet. NG is in a wedge. BTC is at the top of it's range

Opening (IRA): SPY July 18th 495 Short Put... for a 5.13 credit.
Comments: Targeting the <16 delta strike paying around 1% of the strike price in credit.
Max Profit: 5.13
ROC at Max as a Function of Strike Price: 1.04%
Will generally look to roll up if the short put is in profit at 45 DTE or greater, add at intervals if I can get in at strikes better than what I currently have on at the June 513's and July 495's, and/or consider a "window dressing" roll (i.e., a roll down to a strike that is paying about the same in credit) to milk the last drops out of the position.

SPRIAL TURN MAJOR JULY 5to the 10th TOP 4 spiral and one FIBThe chart posted is the updated chary for SPY SPIRAL calendar TURN Notice f12 is a spiral from July 16th 2024 top F 10 is from 11/2024 DJI The SPY was 12/5 th TOP F8 is from Feb 19th Top They ALL have a focus point on JULY 5th to 10th 2025 it is also 89 days since the print low. I Am looking for a MAJOR World event into this date . This time I feel it will be something with JAPAN . As to the markets here The put/call is now at the same level as july 2023 top and july 2024 . I have had fib targets in cash sp 500 from 6181 to as high as 6331 we are now in the middle of the targets But Time still has 3 to 5 days .So if we close strong today I will be buying deep in the money puts once again . The QQQ have entered the min target 551/553 But I tend to think {HOPE] we can reach 562 plus or minus 1.5 to move to a full short . But now in cash BTW the SMH target 283/285 is also a target .for its TOP Bitcoin is now setup for the next TOP I just need a new high .Best of trades WAVETIMER

SPY the pattern was there I missed it.THe chart will always show you what it wants to do. You have to see it.

SPY 4HSResistance: 630 – Strong supply zone, potential profit-taking area.
Support Zone: Around 617 – Recently tested, holding as short-term support.
Gap: 615.03 → If SPY loses 617, watch for a retracement to fill the gap toward 615.
Major 4H Support: 610.17 – Institutional block. Losing this level would break the short-term bullish structure.

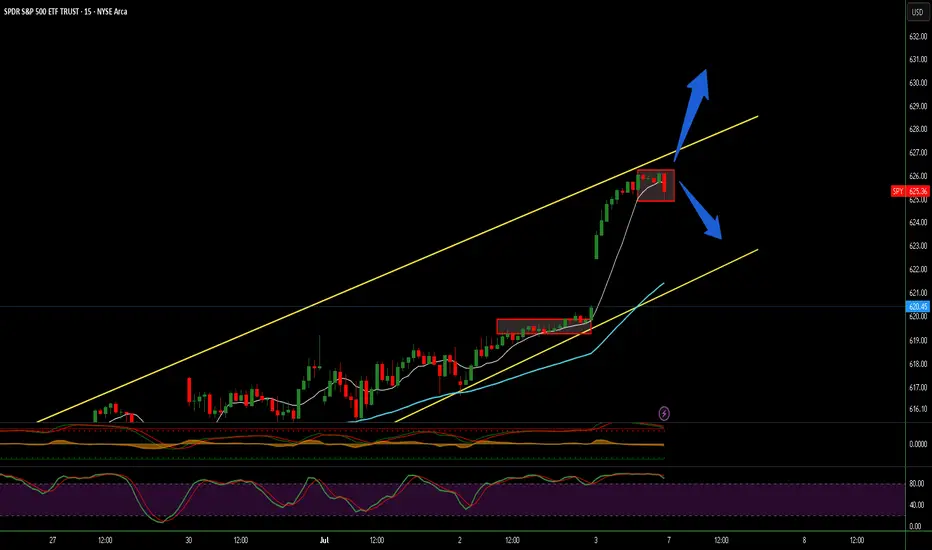
Long Trade Idea: SPY (S&P 500 ETF)!🧠
📅 Timeframe: 30-Minute
📈 Type: Long Position
📐 Setup: Tight consolidation breakout + bullish wedge pattern
📍 Trade Details:
Entry: $620.39 (breakout from rising wedge)
Stop Loss: ~$618.80 (below wedge support)
Target 1: $622.34 (minor resistance)
Target 2: $624.56 (major resistance zone)
🔎 Technical Breakdown:
Price formed a tight rising wedge, squeezing under resistance
Bullish breakout confirmed above consolidation
Strong uptrend continuation — higher highs + higher lows
SPY remains strong despite market hesitation
🎯 Risk/Reward Outlook:
Risk: ~$1.59
Reward: Up to ~$4.17
RR > 2.5:1 — ideal structure for breakout traders
💬 Caption (for Social/Chart Post):
“SPY breaks higher! 💥📈
Wedge breakout signals bullish momentum 🟢
Clean setup toward $624+ zone 🔓
Watch for continuation above $622.34!”
#SPY #LongTrade #BreakoutSetup #S&P500 #ProfittoPath #ETFTrading

SP500 approaching rising trendline from belowThere has always been some correction when the market approaches the rising trendline from below. AMEX:SPY has about 10 point and SP:SPX about 100 points to go still. The volume is still on the buy side. I expect that to fade before a correction. Some market leaders like AMZN have already touched that trendline

Nightly $SPY / $SPX Scenarios for July 3, 2025🔮 Nightly AMEX:SPY / SP:SPX Scenarios for July 3, 2025 🔮
🌍 Market-Moving News 🌍
📉 U.S. Private Payrolls Surround Weakness
The ADP report showed a drop of 33,000 private-sector jobs in June, the first decline in over two years, reflecting businesses holding back hiring amid trade uncertainty. However, layoffs remain low, signaling no acute stress yet
📊 Markets Braced for NFP Caution
Markets are wary ahead of this morning’s Non‑Farm Payroll (NFP) release—currently projected at +115,000 jobs and 4.3% unemployment—based on indications of labor-market cooling from weak ADP numbers
💵 Canadian Dollar Strengthens
The loonie jumped 0.4% as investors adjust expectations for broader central-bank dovishness, driven by the weak U.S. jobs signals and optimism over a revived U.S.–Canada trade dialogue
📊 Key Data Releases 📊
📅 Thursday, July 3:
8:30 AM ET – Non‑Farm Payrolls (June):
Forecast: +115,000; Previous: +139,000 (May). Watching for signs of sustained job-growth slowdown.
8:30 AM ET – Unemployment Rate:
Forecast: 4.3%, up from 4.2% in May. A rise may increase odds of rate cuts.
8:30 AM ET – Average Hourly Earnings (MoM):
Forecast: +0.3%; prior: +0.4%. Cooling wages would ease inflation pressures.
8:30 AM ET – Initial & Continuing Jobless Claims:
Track week-to-week stability or worsening of labor-market conditions.
9:45 AM ET – Services PMI (June, flash):
Monitor for signs of slowing in U.S. service-sector activity.
10:00 AM ET – ISM Non-Manufacturing PMI (June, flash):
Forecast: 50.8. A reading below 50 suggests contraction in services.
⚠️ Disclaimer:
For informational and educational purposes only. It does not constitute financial advice. Consult a licensed financial advisor before making investment decisions.
📌 #trading #stockmarket #economy #jobs #Fed #labor #technicalanalysis

SPY - TargetsWatching this wedge, Trump making headwinds with trade talks, striking a vietnam deal. Buyers still in control but hesitant, the "Big Beautiful Bill' being hashed out in the next couple of weeks. Could easily see a small pull back into the EMA's, Betting we see prices higher to the bullish target $700 if we can break above T/L with nice volume.

update on the markets 7/2/2025SPY continues to move up and I think a bit higher is likely still, although the bearish divergences are warning that another high may not hold. Gold may be bullish if it can push a bit higher. NG still looks bearish overall. USOIL also looks bearish. BTC is trying to breakout, but might not be able to just yet.

FED SPY INFLATION UNEMPThe variables attached have an important roll in economics stability.
Pay attention!

SPY/QQQ Plan Your Trade For 7-1 : Post Market UpdateToday was a very powerful day for the Cycle Patterns - particularly for Gold and BTCUSD.
Gold rallied as the Cycle Pattern predicted a RALLY in TREND mode.
BTCUSD collapsed on a CRUSH Cycle Pattern.
The SPY Cycle Pattern predicted a Gap Reversal pattern. We did see the Gap today and a moderate reversal in price. But the SPY, as usual, continued to try to melt upward.
I highlighted a very interesting TWINNING pattern in Bitcoin in this video. Pay attention.
Get some.
#trading #research #investing #tradingalgos #tradingsignals #cycles #fibonacci #elliotwave #modelingsystems #stocks #bitcoin #btcusd #cryptos #spy #gold #nq #investing #trading #spytrading #spymarket #tradingmarket #stockmarket #silver

Nightly $SPY / $SPX Scenarios for July 2, 2025🔮 Nightly AMEX:SPY / SP:SPX Scenarios for July 2, 2025 🔮
🌍 Market-Moving News 🌍
🏭 U.S. Manufacturing Remains Under Pressure
The ISM Manufacturing PMI for June rose slightly to 49.0 from 48.5 in May—still in contraction territory. Tariff-induced uncertainty and rising input costs continue to weigh on factory activity, with new orders still weak and employment contracting
📈 Global Factory Rebound Led by India & Europe
While U.S. factories struggle, India hit a 14-month high in its manufacturing PMI at 58.4, and euro‑zone factory orders stabilized at 49.5—the first sign of recovery in over three years. Asia-Europe divergence may shift global capital flows .
🏦 Powell Says Tariffs Are Delaying Rate Cuts
Fed Chair Powell warned at the ECB forum in Sintra that elevated inflation—driven in part by Trump-era tariffs—has postponed the timeline for U.S. rate cuts. The Fed’s dot-plot now indicates only two cuts for 2025, with markets adjusting accordingly
💵 Dollar Nears 3½-Year Lows
The U.S. dollar weakened further, trading near a three-and-a-half-year low amid soft PMI data, a dovish Fed tilt, and renewed optimism over U.S.–Canada trade talks
📊 Key Data Releases & Events 📊
📅 Wednesday, July 2:
(No major scheduled U.S. economic data)
Market focus shifts to upcoming Nonfarm Payrolls on July 3, Powell's remarks, and trade-talk headlines.
⚠️ Disclaimer:
This information is for educational and informational purposes only and should not be construed as financial advice. Always consult a licensed financial advisor before making investment decisions.
📌 #trading #stockmarket #economy #manufacturing #Fed #inflation #charting #technicalanalysis

How I screen for long term investmentsIn this video, I’ll show you the exact stock screener I use to find long-term investment opportunities — the kind of stocks you can buy and hold for years.
I’ll walk you through the key metrics to look for, how to use free tools like TradingView screener, and what red flags to avoid. This strategy is perfect for beginner and experienced investors who want to build long-term wealth, not chase hype.
Whether you're looking for undervalued stocks, consistent compounders, or just trying to build your long-term portfolio, this screener can help.
Hope you enjoy!!

Update on the markets 7-1-2025SPX still floating but IWM and DJT are both having strong rallies, which usually means SPX will go higher today or tomorrow. Gold is at resistance. NG is a support. OIl still looks like a bear flag. BTC is pulling back from 107k - again.

$SPY Review of 6.30.25Yesterday’s price action was flat near previous ATH’s for the first part of the day and then the second part of the day we had some nice volatility that tapped the top of the implied move at 619 and then pulled back.

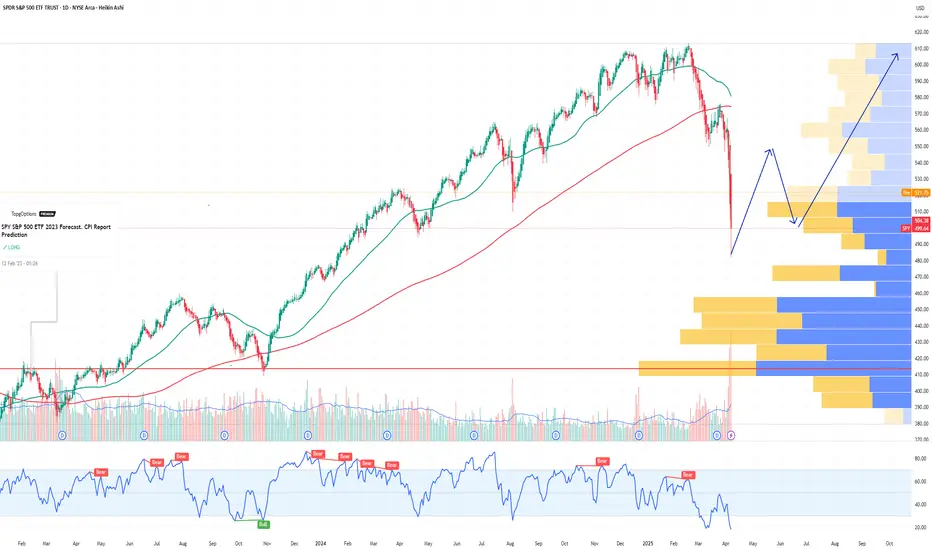
SPY S&P 500 ETF Potential W-Shaped Recovery Forming We may be witnessing the formation of a W-shaped recovery on the SPY (S&P 500 ETF) – a classic double-bottom structure that often signals a strong reversal after a period of correction or volatility. Let’s dive into the technicals and what this could mean in the sessions ahead.
🔍 The Technical Setup:
SPY recently tested key support around the $485-$500 zone, bouncing off that area twice in the past few weeks. This gives us the left leg of the W and the first bottom. After a modest relief rally to ~$520, we saw another pullback – but this second dip failed to break below the first bottom, a hallmark of the W-pattern.
As of today, SPY is starting to reclaim ground toward the $517-$520 resistance zone. If bulls can push through this neckline area, especially with volume confirmation, we could see a breakout that targets the $530-$535 area in the short term.
🔑 Key Levels to Watch:
Support: $490-$500 (double-bottom support zone)
Neckline/Resistance: $530
Breakout Target: $550 (previous highs)
Invalidation: A break below $490 with volume could invalidate the W-recovery idea and shift bias bearish.
📊 Momentum & Volume:
RSI is climbing back above the 50 level – bullish momentum building.
MACD shows a potential crossover forming, hinting at a shift in trend.
Watch for increasing buy volume as SPY approaches the neckline – that’s where the bulls will need to step up.
🧠 Macro & Earnings Angle:
Don’t forget – we’re entering a heavy earnings season and rate cut expectations are still a wildcard. A dovish tone from the Fed and strong corporate results could be the fuel that sends SPY higher to complete this W-shaped recovery.
🧭 Final Thoughts:
This is a high-probability setup if neckline resistance is broken cleanly. Wait for confirmation before going heavy – fakeouts are common in double-bottom scenarios. If we do get the breakout, we may be looking at a broader market rebound going into summer.
🔔 Set alerts near $525. A confirmed breakout could mean the bulls are back in charge.