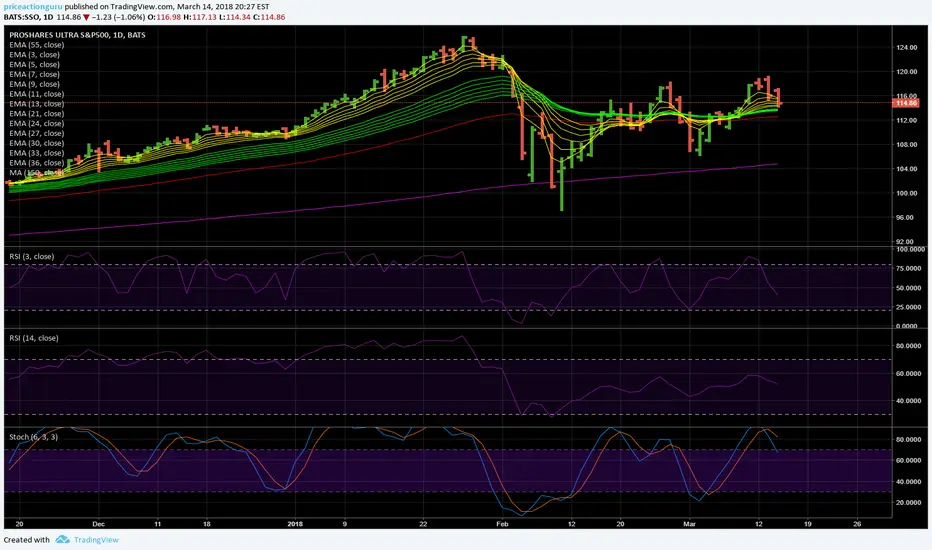
#SSO $SSO has been with me in #trade from 46.00 Really enjoying the clear indicators I use in my trades , some with John and the others
Simple helping lines and info on my screen to guide when to place smaller or larger order and when to trim .I always trim my profit first .Adding on dips is helpful for one big reason , I trade inventory , to profit on daily base when market permits best price , timing not always great ,but enough to keep staying interested. Using scrips is helpful and one must to learn on your turf.
SSO trade ideas

Learn To Trade Breakout/Flags More Efficiently - Part IIn my first tutorial, I tried to show how price channels can be used to identify and validate strong trade setups. Additionally, I attempted to show you how to identify better trade setups from what I consider invalid trade setups.
Understanding and maintaining at least a 2:1 Reward-to-risk factor for any trade you consider taking is essential. Secondly, it is essential to understand and use proper allocation levels for trades.
The simple way to understand allocation levels is to focus on the RISK amount. If your trade risks $5 per share and you can't afford to risk $500 on this trade, then you should NOT attempt to trade 100 shares of this stock.
Set your risk level based on how much you intend to risk for the trade - nothing more.
If you can only risk $250, then you would only trade 50 shares.
If you can only risk $125, then you would only trade 25 shares.
Learning to find and identify proper trade setups on Daily and Weekly charts is critical for success in the long run. I firmly believe price tells us everything we need to know about a chart, and indicators reflect price.
As you continue to learn some of the techniques I use in various price chart setups, I hope you can refine your techniques to become better traders.
I will likely create a PART II and PART III version of these types of advanced trade setups.
Hope you enjoy.

S&P500 leveraged making Sine wave pattern & returning to neckSSO is a safer 2x leveraged etf of SPX than SPXL. It recently formed slight divergence & a big engulfing candle, probably due to oversold RSI & also short coverings after Thursday’s dump & pump with investors betting massively on both directions triggered by a high CPI report.
Prices may return to the neckline (return to mean) next week.
Not trading advice

This is designed to do 2x’s the spy down or upSso will follow spy on average 2 times better if going up and 2 times worse if going down. The orange is spy

SP500 Support at 4280? A review of recent trendlines of SSO, SPLG, SPYV, IVW and UWM. First time shared analysis. Not investment advice, just sharing what I'm seeing.


6 Day 6% swing trade (+$7)Solid swing trade if support is held. stop loss set @ -1.20 and just below whole dollar.

Does this really look BEARISH to you?Longer term trend is UP... No need to panic until
proven otherwise...


SSO Pullback after break lowerSSO is pulling back nicely into a level of previous support. I will look for this to continue lower.

SSO Nice Pullback after gap lowerSSO has been consolidating at highs for the past several days. Today is gapped lower and pulled back to the previous consolidation level. This could very well be a false breakout, but I couldn't pass up such a good risk/reward ratio.

S&P 500 Current SituationThe S&P appears to be consolidated and moving sideways and I expect is will for at least the next couple trading days.
Right now, the momentum is heading down, but I wouldn't expect the price to break below 83. After the downwards momentum fades, I would expect price to retest the the highs in the 84.25 range.

Long SSO on technical supportLong SSO overnight on both a doji at the close and longer term lateral support in the ~67-68 range. I look for a quick turn around on this trade tomorrow and will stop it out in the morning if the S&P shows significant downside price action. Enter at 68.30 with a profit target of 69.30. If you follow my 10000 USD base account recommendations I advise a 200 share position.

